. 2023 Jul;22(7):e13856.
doi: 10.1111/acel.13856. Epub 2023 Apr 26.

Metabololipidomic and proteomic profiling reveals aberrant macrophage activation and interrelated immunomodulatory mediator release during aging

Affiliations

Metabololipidomic and proteomic profiling reveals aberrant macrophage activation and interrelated immunomodulatory mediator release during aging

Patrick Schädel et al. Aging Cell. 2023 Jul.

Abstract

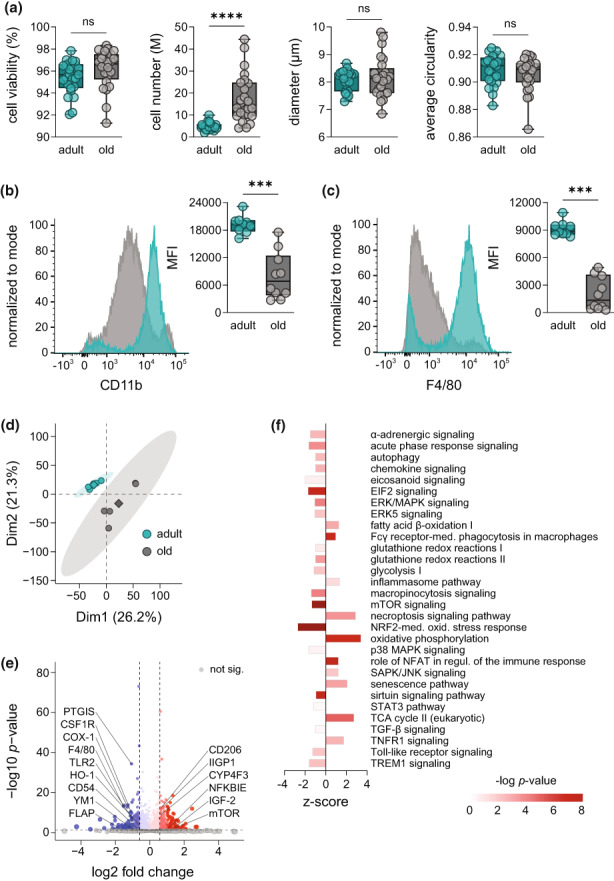
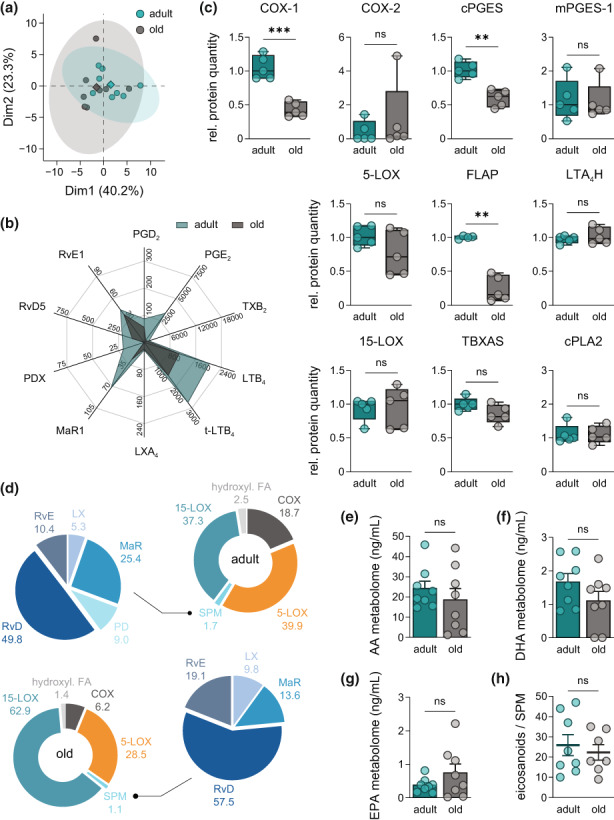
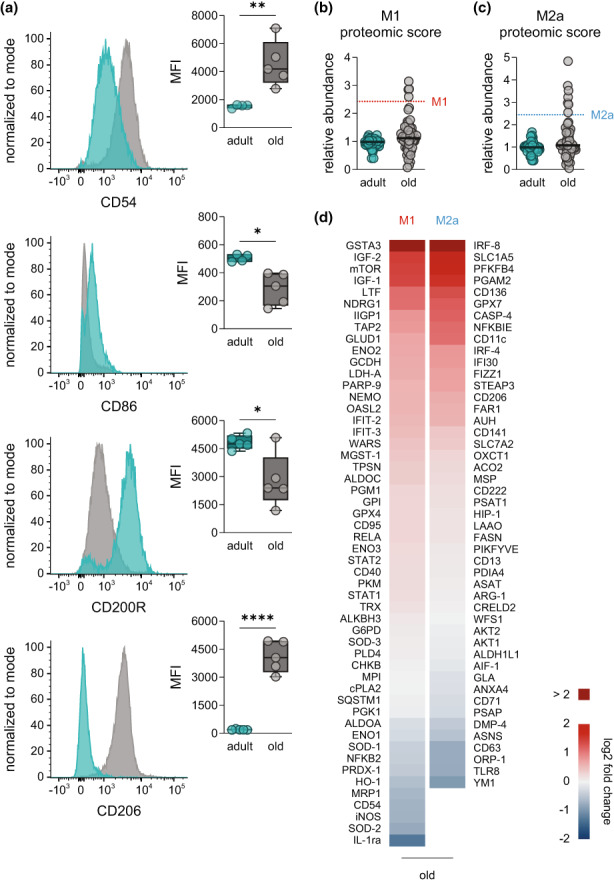
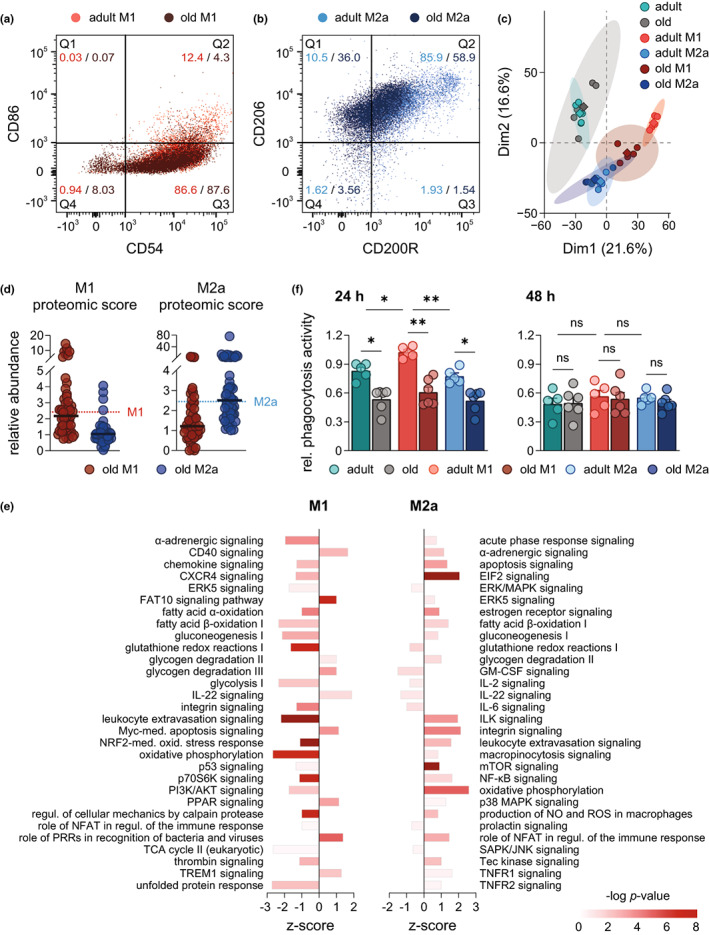
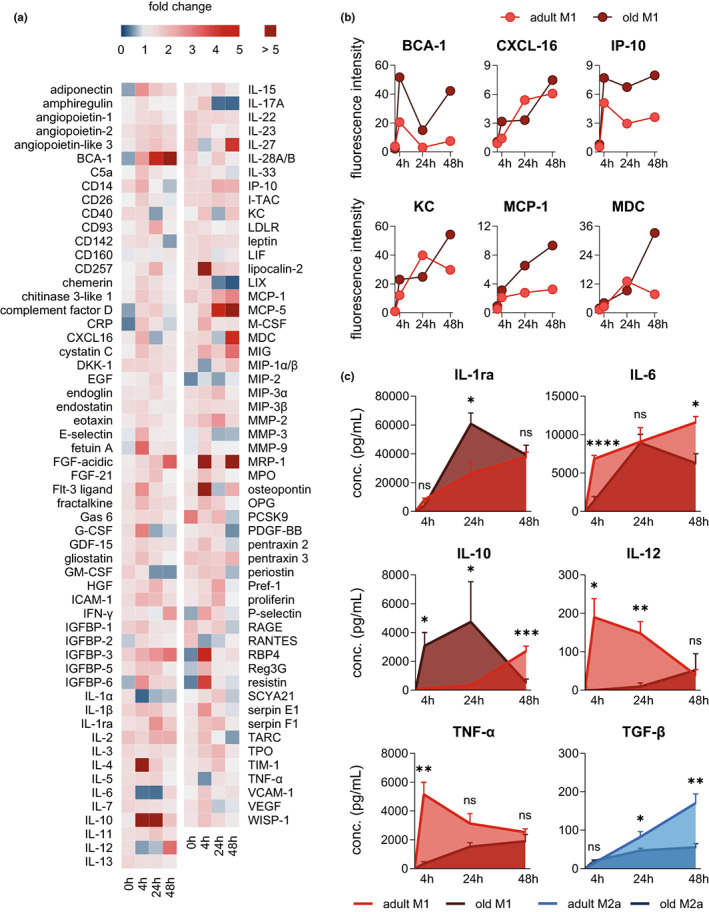
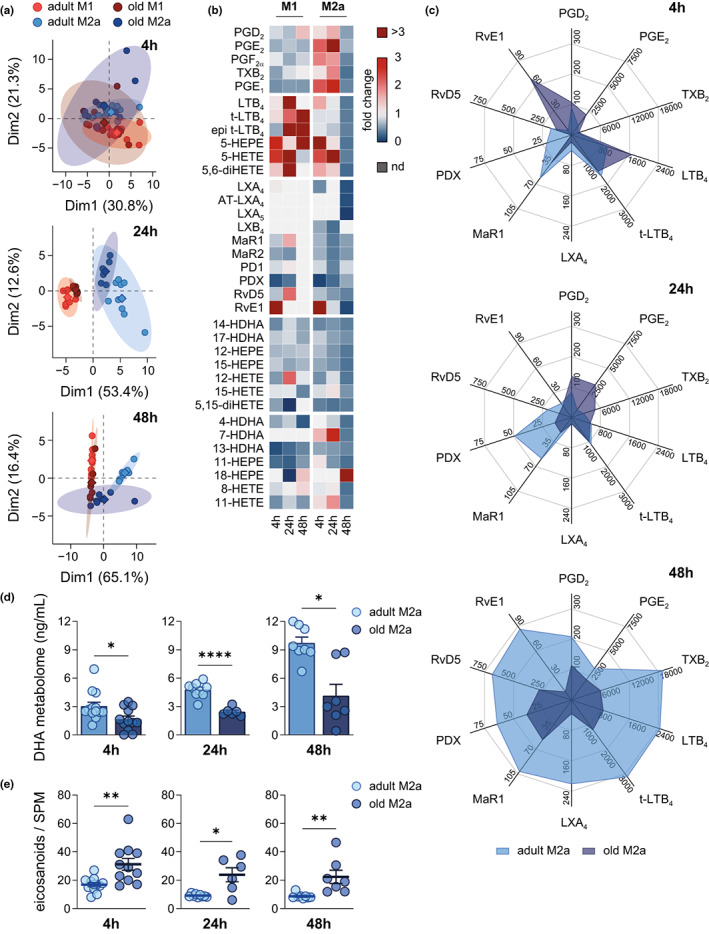
Macrophages adapt distinct pro-inflammatory (M1-like) and pro-resolving (M2-like) phenotypes with specific tasks in the immune response and tissue homeostasis. Altered macrophage responses with age are causative for unresolved inflammation, so-called inflammaging, and lead to higher infection susceptibility with unfavorable progression. Here, we reveal molecular determinants of age-related changes in phenotypic functions of murine peritoneal macrophages (PM) by employing comprehensive mass spectrometry-based proteomics (4746 protein groups) and metabololipidomics (>40 lipid mediators). Divergent expression of various macrophage-specific marker proteins and signaling pathways indicates aberrant PM phenotypes in old mice which detrimentally impact their capabilities to release immunomodulatory chemokines and cytokines. We show that aging strikingly compromises the polarization process of macrophages to adapt either pro-inflammatory or pro-resolving phenotypes, thereby yielding aberrant and afunctional macrophage subtypes that cannot be readily assigned to either a typical M1 or M2 phenotype. In particular, the phenotypic adaptation of the bacteria-challenged metabololipidome in macrophages related to inflammation is severely limited by age, which persists across ex vivo polarization towards M1 and M2a macrophages. Our results establish distinct age-associated PM phenotypes outside of the simplified M1 and M2 dichotomy and challenge the dogma of increased pro-inflammatory macrophage pre-activation due to aging by revealing maladaptive functions throughout all phases of inflammation, including resolution.

Keywords: aging; eicosanoids; inflammation; lipidomics; macrophage activation; mediators of inflammation; peritoneal macrophages; proteomics.


Conflict of interest statement

The authors declare no competing interests.

Figures

FIGURE 1
FIGURE 1
Aging establishes a distinct macrophage phenotype in the peritoneal cavity. (a) Number, viability, diameter, and circularity of isolated cells from the peritoneal cavity of adult (4–6 months) and old mice (>24 months) were assessed with a Vi‐CELL XR system (n = 25). Expression of surface markers (b) CD11b and (c) F4/80 on PM from adult (turquoise) and old mice (grey) was measured by flow cytometry (n = 9–10). Results are shown in representative histograms for both surface markers with mean fluorescence intensity (MFI) of all replicates. (d) Principal component analysis (PCA) of the proteome of PM from adult and old mice measured by DIA mass spectrometry (n = 5). (e) Volcano plot displays proteins significantly increased or decreased by aging (Table S1; n = 5). Not affected proteins are shown in grey. Dashed lines indicate a cutoff for significance of p < 0.05 and absolute fold changes (log2) > 0.58, respectively. Significantly regulated proteins of interest were labelled with an emphasis on those involved in macrophage function during inflammation. (f) Ingenuity pathway analysis of significantly regulated protein clusters in PM from old mice in comparison with adult (n = 5). Displayed pathways are among the Top 100 most significantly regulated pathways and were selected based on the relevance for aging and inflammation. Bonferroni–Holm corrected p‐values are implicated by color and z‐scores by bar size. Statistics: Data are shown as (a–c): median (min to max) or (e, f) median and p‐values were calculated by ‘a–c’ unpaired two‐tailed Student's t‐test with or without Welch's correction (Table S7), (e) Spectronaut™ (Table S1) or (f) QIAGEN Ingenuity Pathway Analysis. ***p ≤ 0.001, ****p ≤ 0.0001, ns, not significant.
FIGURE 2
FIGURE 2
Aging compromises the metabololipidome of E. coli‐infected peritoneal macrophages. (a) PCA of the metabololipidomic profile of PM from adult and old mice after E. coli infection (Table S6; n = 8). (b) Radar chart of selected bioactive LM released by PM of adult and old origin after E. coli infection (Table S6; n = 8; unit: pg/mL). (c) Relative abundance of COX‐1, COX‐2, cPGES, mPGES‐1, 5‐LOX, FLAP, LTA4H, 15‐LOX, TBXAS, and cPLA2 in PM from adult and old mice, measured by DIA mass spectrometry (n = 5). (d) Composition of the metabololipidome of adult and old PM after E. coli infection (Table S6; n = 8). Metabolites were grouped as follows: COX‐2 – PGD2, PGE2, PGF, TXB2; PGE1; 5‐LOX – LTB4, t‐LTB4, epi t‐LTB4, 5‐HETE, 5‐HEPE, 5S,6R‐diHETE; SPM – LXA4, AT‐LXA4, LXA5, LXB4, MaR1, MaR2, PD1, PDX, RvD1, AT‐RvD1, RvD2, RvD3, RvD4, RvD5, RvE1; 15‐LOX – 14‐HDHA, 17‐HDHA, 12‐HEPE, 15‐HEPE, 12‐HETE, 15‐HETE, 5,15‐diHETE; hydroxylated FA – 4‐HDHA, 7‐HDHA, 10‐HDHA, 13‐HDHA, 11‐HEPE, 18‐HEPE, 8‐HETE, 11‐HETE, 9‐HODE, 13‐HODE. Fatty acid metabolomes are given as sum of all metabolites from (e) AA, (f) DHA and (g) EPA released by PM of adult and old mice after infection with pathogenic E. coli (Table S6; n = 8). (h) Ratio of pro‐inflammatory PGE2, LTB4, t‐LTB4, and epi t‐LTB4 to all SPM (see above) released by adult and old PM after E. coli infection (Table S6; n = 8). Statistics: Data are shown as (b, d) mean or (c) median (min to max) or (e–h) mean ± SEM and p‐values were calculated by unpaired two‐tailed Student's t‐test with or without Welch's correction (Table S7). **p ≤ 0.01, ***p ≤ 0.001, ns, not significant.
FIGURE 3
FIGURE 3
Investigation of polarization markers in naive peritoneal macrophages. (a) Expression of M1 (CD54, CD86) and M2a surface markers (CD200R, CD206) in naive PM from adult and old mice was determined by flow cytometry. Results are shown as representative histograms with MFI of all replicates (n = 4–5). Abundance of (b) M1 and (c) M2a proteomic markers in PM from adult and old mice was determined by DIA mass spectrometry. Each dot represents the median of a different marker (the complete list is given in Table S2) and median of all markers is indicated by vertical bars, whereas dotted lines show median in M1‐ and M2a‐PM (48 h) from adult mice (n = 5). (d) Heatmap showing age‐related changes in the expression of M1 and M2a proteomic markers in PM from old mice in comparison with adult (n = 5). Fold change is implicated by color scale. Statistics: Data are shown as (a) median (min to max) or (b–d) as median and p‐values were calculated by unpaired two‐tailed Student's t‐test with or without Welch's correction (Table S7). *p ≤ 0.05, **p ≤ 0.01, ****p ≤ 0.0001.
FIGURE 4
FIGURE 4
Influence of aging on the phenotype and functionality of polarized peritoneal macrophages. Expression of (a) M1 (CD54, CD86) and (b) M2a (CD200R, CD206) surface markers in polarized PM (48 h) was determined by flow cytometry, and results are shown in a representative overlaid dot plot indicating percental distribution of populations (n = 5). (c) PCA of the proteome of PM from adult and old mice after 48 h of polarization measured by DIA mass spectrometry (n = 5). (d) Abundance of M1 and M2a proteomic markers in polarized PM (48 h) of old mice was determined by DIA mass spectrometry. Each dot represents the median of a different marker (complete list is given in Table S2) and median of all markers is indicated by vertical bars, whereas dotted lines show median in M1‐ and M2a‐PM (48 h) from adult mice (n = 5). (e) Ingenuity pathway analysis of significantly regulated protein clusters in M1 and M2a‐PM (48 h) from old mice in comparison with adult (n = 5). Displayed pathways are among the Top 100 most significantly regulated pathways and were selected based on their relevance for aging and inflammation. Bonferroni–Holm corrected p‐value is implicated by color and z‐score by bar size. (f) Naive and polarized PM (24 h and 48 h) from adult and old mice were incubated with fluorescent‐labelled E. coli particles for 2 h, and phagocytic activity was determined by measuring fluorescence after uptake (n = 5–6). Statistics: Data are shown as (d, e) median or (f) mean ± SEM and p‐values were calculated by (e) QIAGEN Ingenuity Pathway Analysis or (f) one‐way ANOVA for multiple comparisons with Šídák post‐hoc test or Brown‐Forsythe and Welch ANOVA with Dunnett T3 post‐hoc test (Table S7).
FIGURE 5
FIGURE 5
Aging leads to aberrant cytokine and chemokine release from polarized macrophages. The cytokine and chemokine secretome of adult and old PM after stimulation with LPS (100 ng/mL) and IFN‐γ (20 ng/mL was determined by means of a cytokine array (Figure S7, Table S4). (a) Heatmap showing global time‐related changes in the cytokine and chemokine secretome of old M1‐PM in comparison with adult. Fold change is implicated by color scale. (b) The temporal release is shown for selected and prominent pro‐inflammatory cytokines and chemokines secreted by M1‐PM of both age cohorts over the course of 48 h. (c) Concentration of pro‐inflammatory IL‐1ra, IL‐6, IL‐10, IL‐12, and TNF‐α in adult and old M1‐PM, and TGF‐β in adult and old M2a‐PM was measured by ELISA (n = 6; except 24 h [IL‐10]: n = 4–6). Statistics: Data are shown as (a, b) mean or (c) mean ± SEM and p‐values were calculated by unpaired two‐tailed Student's t‐test with or without Welch's correction (Table S7). *p ≤ 0.05, **p ≤ 0.01, ***p ≤ 0.001, ****p ≤ 0.0001, ns, not significant.
FIGURE 6
FIGURE 6
Impaired M2a macrophage polarization as consequence of aging causes a depletion of DHA‐derived SPM levels after E. coli infection. Polarized PM (4–48 h) were infected with pathogenic E. coli for 90 min at a MOI of 50 and subsequent LM levels were determined by UPL‐CM‐SMS (Table S6; 4 h: n = 12–13; 24 h: n = 6–9; 48 h: n = 7–8). (a) PCA of metabololipidomic profile of M1‐ and M2a‐PM from adult and old mice. (b) Heatmap showing age‐related changes in the temporal release (4–48 h) of LM from M1‐ and M2a‐PM of old mice in comparison with adult. Fold change is implicated by color scale and not detectable metabolites are marked (nd). For individual LM only detectable in one age‐group, fold change was calculated to corresponding LOD (Table S5). (c) Radar charts of selected bioactive LM released by adult and old M2a‐PM (unit: pg/mL). (d) DHA metabolome is given as sum of all metabolites of DHA released by M2a‐PM. (e) Ratio of pro‐inflammatory PGE2, LTB4, t‐LTB4, and epi t‐LTB4 to all SPM released by M2a‐PM. Statistics: Data are shown as (b, c) mean or (d, e) mean ± SEM and p‐values were calculated by unpaired two‐tailed Student's t‐test with or without Welch's correction (Table S7). *p ≤ 0.05, **p ≤ 0.01, ****p ≤ 0.0001.

References

    1. Aiello, A. , Farzaneh, F. , Candore, G. , Caruso, C. , Davinelli, S. , Gambino, C. M. , Ligotti, M. E. , Zareian, N. , & Accardi, G. (2019). Immunosenescence and its hallmarks: How to oppose aging strategically? A review of potential options for therapeutic intervention. Frontiers in Immunology, 10, 2247. 10.3389/fimmu.2019.02247 - DOI - PMC - PubMed
    1. Almanzar, N. , Antony, J. , Baghel, A. S. , Bakerman, I. , Bansal, I. , Barres, B. A. , Beachy, P. A. , Berdnik, D. , Bilen, B. , Brownfield, D. , Cain, C. , Chan, C. K. F. , Chen, M. B. , Clarke, M. F. , Conley, S. D. , Darmanis, S. , Demers, A. , Demir, K. , De Morree, A. , … Zou, J. (2020). A single‐cell transcriptomic atlas characterizes ageing tissues in the mouse. Nature, 583(7817), 590–595. 10.1038/s41586-020-2496-1 - DOI - PMC - PubMed
    1. Arango Duque, G. , & Descoteaux, A. (2014). Macrophage cytokines: Involvement in immunity and infectious diseases. Frontiers in Immunology, 5, 491. 10.3389/fimmu.2014.00491 - DOI - PMC - PubMed
    1. Arnardottir, H. H. , Dalli, J. , Colas, R. A. , Shinohara, M. , & Serhan, C. N. (2014). Aging delays resolution of acute inflammation in mice: Reprogramming the host response with novel nano‐proresolving medicines. The Journal of Immunology, 193(8), 4235–4244. 10.4049/jimmunol.1401313 - DOI - PMC - PubMed
    1. Bain, C. C. , Hawley, C. A. , Garner, H. , Scott, C. L. , Schridde, A. , Steers, N. J. , Mack, M. , Joshi, A. , Guilliams, M. , Mowat, A. M. I. , Geissmann, F. , & Jenkins, S. J. (2016). Long‐lived self‐renewing bone marrow‐derived macrophages displace embryo‐derived cells to inhabit adult serous cavities. Nature Communications, 7(1), 11852. 10.1038/ncomms11852 - DOI - PMC - PubMed

Publication types