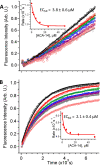
KRAS Inhibitor that Simultaneously Inhibits Nucleotide Exchange Activity and Effector Engagement
- PMID: 37101428
- PMCID: PMC10125367
- DOI: 10.1021/acsbiomedchemau.2c00045
KRAS Inhibitor that Simultaneously Inhibits Nucleotide Exchange Activity and Effector Engagement
Abstract
We describe a small molecule ligand ACA-14 (2-hydroxy-5-{[(2-phenylcyclopropyl) carbonyl] amino} benzoic acid) as an initial lead for the development of direct inhibitors of KRAS, a notoriously difficult anticancer drug target. We show that the compound binds to KRAS near the switch regions with affinities in the low micromolar range and exerts different effects on KRAS interactions with binding partners. Specifically, ACA-14 impedes the interaction of KRAS with its effector Raf and reduces both intrinsic and SOS-mediated nucleotide exchange rates. Likely as a result of these effects, ACA-14 inhibits signal transduction through the MAPK pathway in cells expressing mutant KRAS and inhibits the growth of pancreatic and colon cancer cells harboring mutant KRAS. We thus propose compound ACA-14 as a useful initial lead for the development of broad-acting inhibitors that target multiple KRAS mutants and simultaneously deplete the fraction of GTP-loaded KRAS while abrogating the effector-binding ability of the already GTP-loaded fraction.
© 2022 The Authors. Published by American Chemical Society.
Conflict of interest statement
The authors declare no competing financial interest.
Figures


 , where P1 and P2 are polarization of free
and RBD-bound KRAS, respectively, c is the total
concentration of KRAS, and x is the total concentration
of RBD. (B–D) Representative western blots, including loading
controls total GFP-KRAS(G12D) and total endogenous RAS (B), level
of GFP-tagged GTP-KRAS(G12D) (C), and endogenous RAS (D) pulled-down
by GST-RBD after treatment of BHK cell lysates ectopically expressing
GFP-tagged KRAS(G12D) with increasing concentrations of ACA-14. (E) Representative western blots of whole cell
lysates from BHK cells expressing GFP-tagged KRAS(G12D) treated for
3 h with vehicle (DMSO) or the indicated concentrations of ACA-14 under serum-starved condition. Vinculin was used as a loading control.
(F–H) Quantitation of the levels of phosphorylated c-Raf (p-cRaf)
(F), ERK (p-ERK) (G), and AKT (p-AKT) (H). (C,D,F–H) Values
are normalized against DMSO control and averaged from three independent
experiments. Statistical significance was calculated between vehicle
(DMSO) and compound-treated samples using unpaired Student’s t test.
Similar articles
-
Small-Molecule Inhibition of KRAS through Conformational Selection.ACS Omega. 2023 Aug 18;8(34):31419-31426. doi: 10.1021/acsomega.3c04013. eCollection 2023 Aug 29. ACS Omega. 2023. PMID: 37663463 Free PMC article.
-
Blockade of mutant RAS oncogenic signaling with a special emphasis on KRAS.Pharmacol Res. 2021 Oct;172:105806. doi: 10.1016/j.phrs.2021.105806. Epub 2021 Aug 24. Pharmacol Res. 2021. PMID: 34450320 Review.
-
Oncogenic KRAS activates hedgehog signaling pathway in pancreatic cancer cells.J Biol Chem. 2007 May 11;282(19):14048-55. doi: 10.1074/jbc.M611089200. Epub 2007 Mar 12. J Biol Chem. 2007. PMID: 17353198
-
BI-3406, a Potent and Selective SOS1-KRAS Interaction Inhibitor, Is Effective in KRAS-Driven Cancers through Combined MEK Inhibition.Cancer Discov. 2021 Jan;11(1):142-157. doi: 10.1158/2159-8290.CD-20-0142. Epub 2020 Aug 19. Cancer Discov. 2021. PMID: 32816843 Free PMC article.
-
Pharmacological strategies to target oncogenic KRAS signaling in pancreatic cancer.Pharmacol Res. 2017 Mar;117:370-376. doi: 10.1016/j.phrs.2017.01.006. Epub 2017 Jan 8. Pharmacol Res. 2017. PMID: 28077300 Review.
Cited by
-
Structure-based design of an aromatic helical foldamer-protein interface.Chem Sci. 2025 Jun 2;16(27):12385-12396. doi: 10.1039/d5sc01826a. eCollection 2025 Jul 10. Chem Sci. 2025. PMID: 40510324 Free PMC article.
-
New insights into protein-protein interaction modulators in drug discovery and therapeutic advance.Signal Transduct Target Ther. 2024 Dec 6;9(1):341. doi: 10.1038/s41392-024-02036-3. Signal Transduct Target Ther. 2024. PMID: 39638817 Free PMC article. Review.
-
RAS-targeted cancer therapy: Advances in drugging specific mutations.MedComm (2020). 2023 May 27;4(3):e285. doi: 10.1002/mco2.285. eCollection 2023 Jun. MedComm (2020). 2023. PMID: 37250144 Free PMC article. Review.
-
KRAS Mutation Subtypes and Their Association with Other Driver Mutations in Oncogenic Pathways.Cells. 2024 Jul 19;13(14):1221. doi: 10.3390/cells13141221. Cells. 2024. PMID: 39056802 Free PMC article. Review.
-
Isothermal chemical denaturation assay for monitoring protein stability and inhibitor interactions.Sci Rep. 2023 Nov 16;13(1):20066. doi: 10.1038/s41598-023-46720-w. Sci Rep. 2023. PMID: 37973851 Free PMC article.
References
LinkOut - more resources
Full Text Sources
Research Materials
Miscellaneous
