. 2023 Feb 10;9(3):e13602.
doi: 10.1016/j.heliyon.2023.e13602. eCollection 2023 Mar.

The gut microbiome-Does stool represent right?

Affiliations

The gut microbiome-Does stool represent right?

Orly Levitan et al. Heliyon. .

Abstract

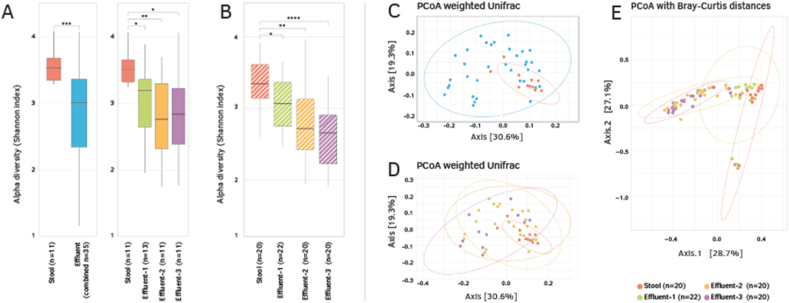
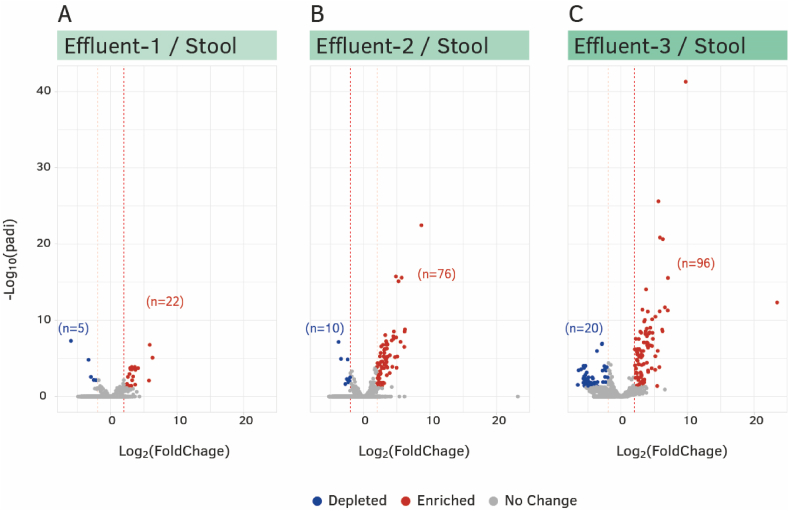
Many stool-based gut microbiome studies have highlighted the importance of the microbiome. However, we hypothesized that stool is a poor proxy for the inner-colonic microbiome and that studying stool samples may be inadequate to capture the true inner-colonic microbiome. To test this hypothesis, we conducted prospective clinical studies with up to 20 patients undergoing an FDA-cleared gravity-fed colonic lavage without oral purgative pre-consumption. The objective of this study was to present the analysis of inner-colonic microbiota obtained non-invasively during the lavage and how these results differ from stool samples. The inner-colonic samples represented the descending, transverse, and ascending colon. All samples were analyzed for 16S rRNA and shotgun metagenomic sequences. The taxonomic, phylogenetic, and biosynthetic gene cluster analyses showed a distinctive biogeographic gradient and revealed differences between the sample types, especially in the proximal colon. The high percentage of unique information found only in the inner-colonic effluent highlights the importance of these samples and likewise the importance of collecting them using a method that can preserve these distinctive signatures. We proposed that these samples are imperative for developing future biomarkers, targeted therapeutics, and personalized medicine.

Keywords: 16S rRNA; Biogeography; Bowel Prep; Bowel prep; Colonoscopy; Drug design; Gut microbiome; Innovation; Microbiome; NGS; Personalized medicine; Prep; Stratification; WGS.


Conflict of interest statement

The authors declare no competing interests.

Figures

Fig. 1
Fig. 1
Unique and shared microbial strains in inner-colonic effluent and stool samples, as detected by 16S rRNA sequencing and Amplicon Sequencing Variants (ASV) analysis. A. A Venn diagram representing the number (and percentage) of microbial strains that are unique and shared between stool (red) and the three inner-colonic effluent sample types pooled together (blue). The pie charts represent the microbial strains distribution for each group (unique to stool, unique to effluent, shared) by phylum taxonomic rank. For stool n = 11; n = 35 for inner-colonic effluent samples; and n = 46 for shared microbial strains. B. Number (and percentage) of microbial strains that are unique and shared between stool and the different inner-colonic effluent sample types “Effluent 1–3” representing the different colonic segments. For stool n = 11; Descending (left) colon, “Effluent-1”, n = 13; transverse colon “Effluent-2”, n = 11; and ascending (right) colon, “Effluent-3”, n = 11. . (For interpretation of the references to color in this figure legend, the reader is referred to the Web version of this article.)
Fig. 2
Fig. 2
Comparison of the microbial community diversity of inner-colonic effluent samples collected during high-volume colon irrigation and home-collected stool samples. A. Alpha diversity of microbial strains based on 16S rRNA sequencing and ASV analysis. Left: Stool samples (n = 11) compared to combined data from all effluent samples (n = 35). Right: Comparison between stool (n = 11) and the three different effluent sample types, where: descending (left) colon, “Effluent-1”, n = 13; transverse colon, “Effluent-2”, n = 11; and, ascending (right) colon “Effluent-3”, n = 11. B. Alpha diversity of bacterial strains detected in whole genome sequencing. Sample types are: Stool, n = 20; Descending (left) colon, “Effluent-1”, n = 22; transverse colon, “Effluent-2”, n = 20; and ascending (right) colon (“Effluent-3”) n = 20. For both A and B, Results are presented as Shannon index. NS indicates p > 0.05; *p ≤ 0.05, **p ≤ 0.01; ***p ≤ 0.001, and ****p ≤ 0.0001. C and D. Beta diversity based on 16S rRNA sequencing and ASV analysis and represented by PCoA weighted Unifrac analysis. Inner-colonic effluent samples are represented in the different panels both as combined (C, n = 35) and separated into three inner-colonic sample types (D), representing the ascending (left) colon, “Effluent-1”, n = 13; transverse colon, “Effluent-2”, n = 11; and descending (right) colon, “Effluent-3”, n = 11. For stool samples, n = 11. E. Beta diversity based on whole genome sequencing and represented by PCoA with Bray-Curtis distances where: descending (left) colon, “Effluent-1”, n = 22; transverse colon, “Effluent-2” n = 20; and ascending (right) colon, “Effluent-3”, n = 20. For stool samples, n = 20.
Fig. 3
Fig. 3
Differential abundance analysis comparing stool samples (n = 20) to the inner-colonic effluent samples, from the distal colon, “Effluent-1” representing the descending (left) colon (n = 22) (panel A), to “Effluent-2” representing the transverse colon (n = 22) (panel B), and the proximal “Effluent-3” representing the ascending (right) colon (n = 20) (panel C). The red dots indicate species that are significantly enriched in Effluent samples and whose log2fold change was bigger than 2. Blue dots indicate species that are significantly enriched in stool and whose log2fold change was bigger than 2. The grey dots indicate species whose padj was bigger than 0.05 or the log2fold change was not bigger than 2. The horizontal red dash line indicates the padj equals to 0.05; The two vertical dashed lines indicate the absolute values of log2fold change equal to 2. . (For interpretation of the references to color in this figure legend, the reader is referred to the Web version of this article.)
Fig. 4
Fig. 4
Biosynthetic Genes Cluster (BGC) analysis of inner-colonic effluent and stool samples. The Venn Diagram on the left part represents the number and percentage of BGCs found only in stool samples (red, n = 20), the number and percentage of BGCs shared between stool and inner-colonic effluent samples (purple, n = 82), and the number and percentage of identified BGCs found only in the inner-colonic effluent sample (all effluent samples combined, blue, n = 62). To the right, the buddying circles from the blue part of the Venn diagram represent the number and percentage of unique BGCs detected in the different biogeographic parts of the colon, represented by green for descending (left) colon, “Effluent-1”, n = 22; Orange for transverse colon, “Effluent-2”, n = 20; and plum for ascending (right) colon, “Effluent-3”, n = 20. (For interpretation of the references to color in this figure legend, the reader is referred to the Web version of this article.)

References

    1. Grice E.A., Segre J.A. The human microbiome: our second genome. Annu. Rev. Genom. Hum. Genet. 2012;13:151–170. doi: 10.1146/annurev-genom-090711-163814. - DOI - PMC - PubMed
    1. Lynch S.V., Pedersen O. The human intestinal microbiome in health and disease. N. Engl. J. Med. 2016;375(24):2369–2379. doi: 10.1056/NEJMra1600266. - DOI - PubMed
    1. Shapiro H., Suez J., Elinav E. Personalized microbiome-based approaches to metabolic syndrome management and prevention. J. Diabetes. 2017;9(3):226–236. doi: 10.1111/1753-0407.12501. - DOI - PubMed
    1. Woyke T. Beyond the census of human gut dwellers. Nat. Rev. Microbiol. 2019;17(7):401. doi: 10.1038/s41579-019-0220-7. 401. - DOI - PubMed
    1. Zmora N., Soffer E., Elinav E. Transforming medicine with the microbiome. Sci. Transl. Med. 2019;11(477) doi: 10.1126/scitranslmed.aaw1815. eaaw1815-eaaw1815. - DOI - PubMed