. 2023 Apr 10:14:1158222.
doi: 10.3389/fphar.2023.1158222. eCollection 2023.

Predicting individual-specific cardiotoxicity responses induced by tyrosine kinase inhibitors

Affiliations

Predicting individual-specific cardiotoxicity responses induced by tyrosine kinase inhibitors

Jaehee V Shim et al. Front Pharmacol. .

Abstract

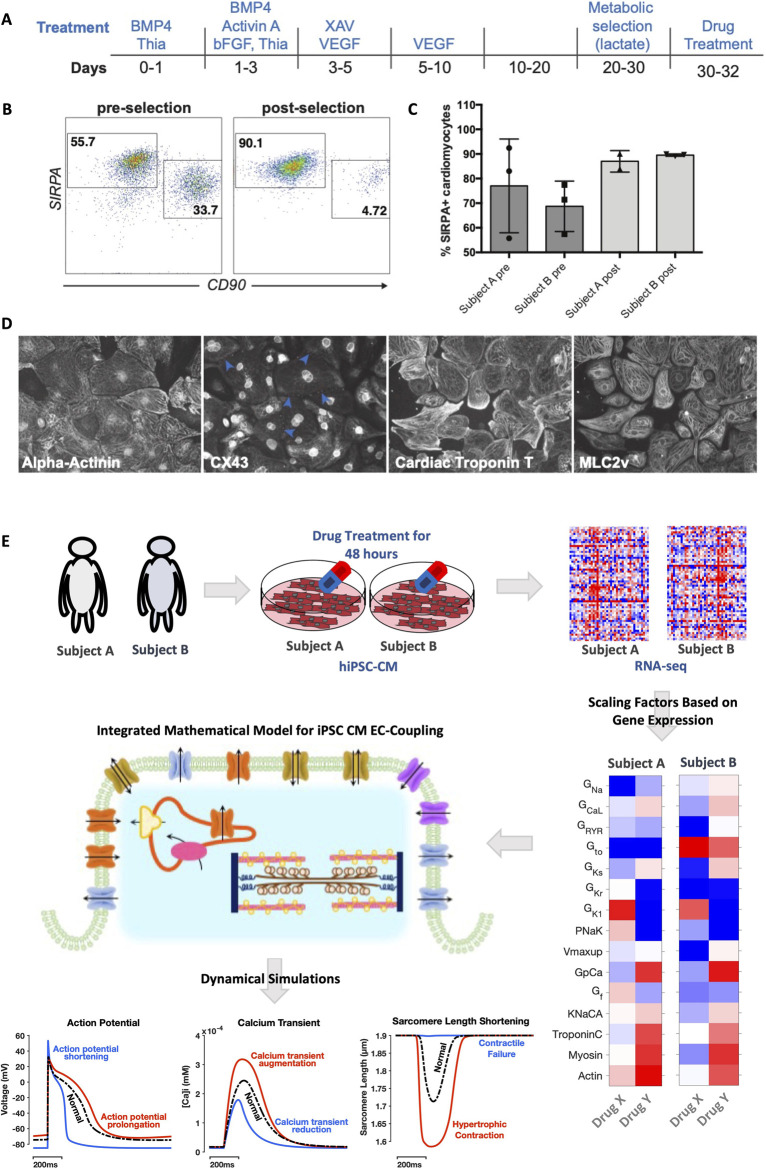
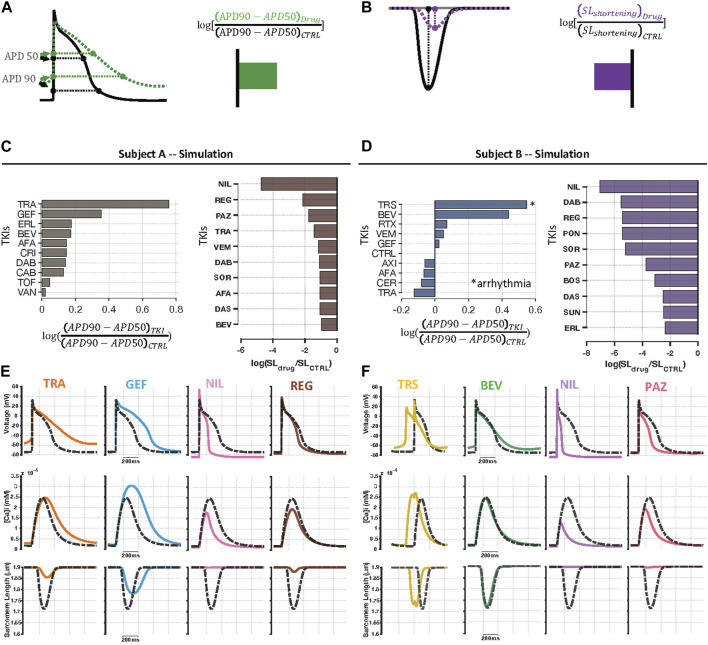
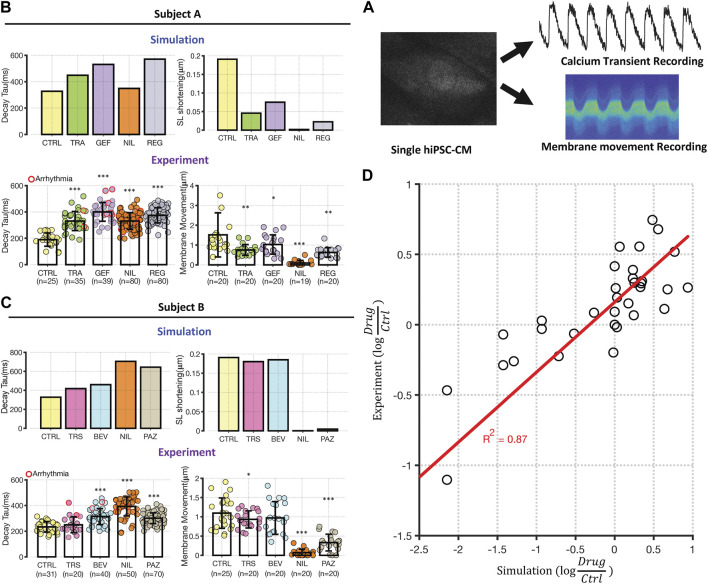
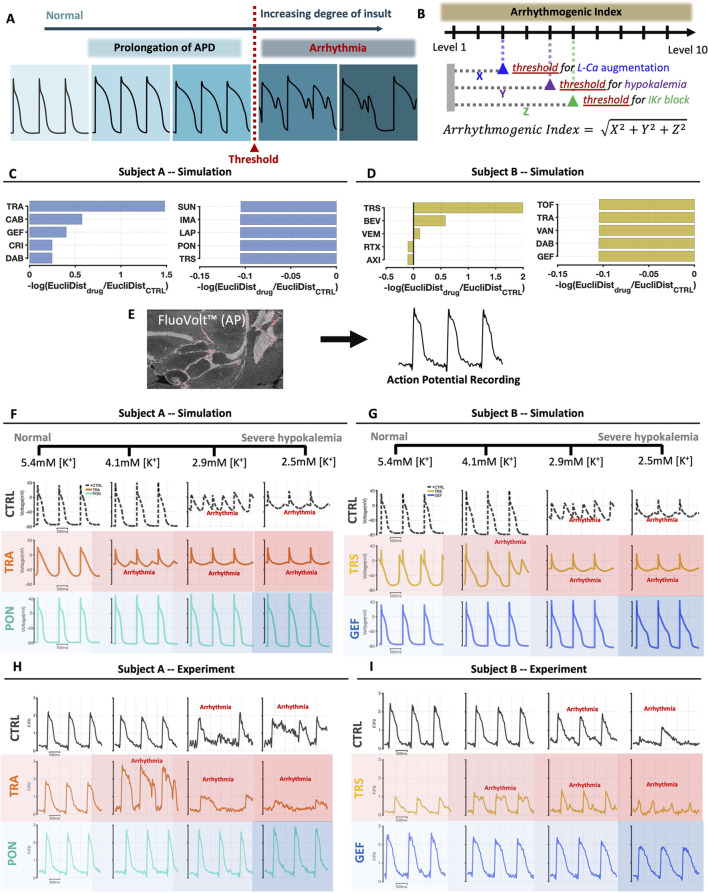
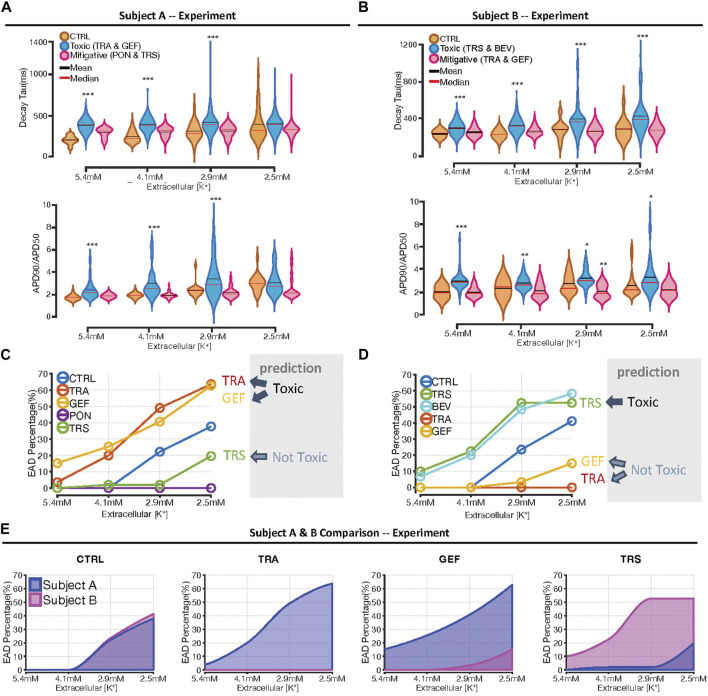
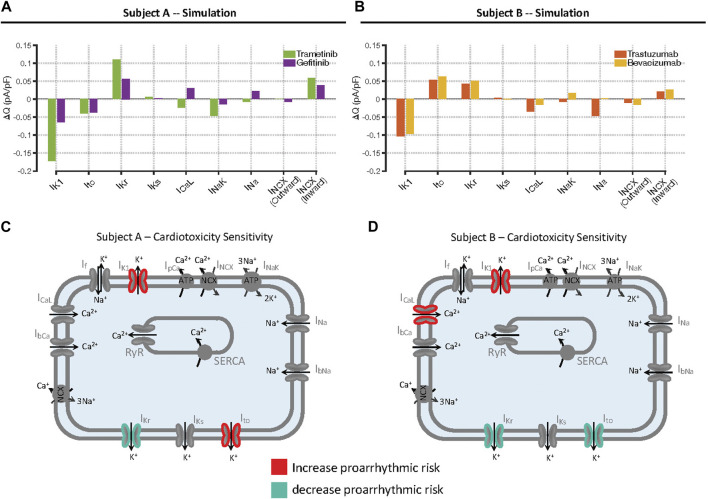
Introduction: Tyrosine kinase inhibitor drugs (TKIs) are highly effective cancer drugs, yet many TKIs are associated with various forms of cardiotoxicity. The mechanisms underlying these drug-induced adverse events remain poorly understood. We studied mechanisms of TKI-induced cardiotoxicity by integrating several complementary approaches, including comprehensive transcriptomics, mechanistic mathematical modeling, and physiological assays in cultured human cardiac myocytes. Methods: Induced pluripotent stem cells (iPSCs) from two healthy donors were differentiated into cardiac myocytes (iPSC-CMs), and cells were treated with a panel of 26 FDA-approved TKIs. Drug-induced changes in gene expression were quantified using mRNA-seq, changes in gene expression were integrated into a mechanistic mathematical model of electrophysiology and contraction, and simulation results were used to predict physiological outcomes. Results: Experimental recordings of action potentials, intracellular calcium, and contraction in iPSC-CMs demonstrated that modeling predictions were accurate, with 81% of modeling predictions across the two cell lines confirmed experimentally. Surprisingly, simulations of how TKI-treated iPSC-CMs would respond to an additional arrhythmogenic insult, namely, hypokalemia, predicted dramatic differences between cell lines in how drugs affected arrhythmia susceptibility, and these predictions were confirmed experimentally. Computational analysis revealed that differences between cell lines in the upregulation or downregulation of particular ion channels could explain how TKI-treated cells responded differently to hypokalemia. Discussion: Overall, the study identifies transcriptional mechanisms underlying cardiotoxicity caused by TKIs, and illustrates a novel approach for integrating transcriptomics with mechanistic mathematical models to generate experimentally testable, individual-specific predictions of adverse event risk.

Keywords: IPSC-CM cardiomyocytes; cardiotoxicity; kinase inhibitor; mRNA sequencing; mRNASeq; mathematical model.


Conflict of interest statement

The authors declare that the research was conducted in the absence of any commercial or financial relationships that could be construed as a potential conflict of interest.

Figures

FIGURE 1
FIGURE 1
Preparation of purified iPSC-CMs and computational pipeline for simulation analysis. (A) Schematic of differentiation and metabolic selection of human pluripotent stem cells. (B) Flow cytometry analysis for SIRPA (cardiomyocyte marker) and CD90 (fibroblast marker) at day 20 (before lactate selection) and day 30 (after lactate selection). (C) Quantification of SIRPA+ cells before and after lactate selection in the two cell lines, based on n = 3 differentiations in each cell line. (D) IF analysis of iPSC-CMs after lactate selection at day 30, Cells were stained with antibodies against α-actinin, Connexin 43 (CX43), cardiac Troponin T and MLC2v. (E) Study workflow illustrates how iPSCs derived from two healthy human volunteers were differentiated into cardiac myocytes, then treated with 26 FDA-approved tyrosine kinase inhibitor drugs. Gene expression was quantified in each cell line with mRNA-seq, and genes relevant to iPSC-CM excitation-contraction coupling were extracted and converted into fold changes, indicating relative changes resulting from drug treatment. These fold changes corresponded to alterations in mathematical model parameters, specific to each cell line, and simulations predicted changes in action potentials, intracellular Ca2+ transients, and sarcomere shortening caused by drugs.
FIGURE 2
FIGURE 2
Individual specific predictions of physiological alterations caused by TKIs. (A) To examine TKI-induced effects on electrophysiology, we computed triangulation of AP waveforms from the simulation output for each drug. In the diagram, the green curve, representing drug-induced changes, shows a more triangular waveform than the black curve, representing the baseline model, which indicates an increase in triangulation. (B) TKI-induced contractile dysfunction was evaluated using sarcomere length shortening simulation results. Because the drug-treated purple curve exhibits reduced shortening compared with the black (control) curve, this change is summarized as a decrease in contraction strength. (C, D) Individual specific, top 10 rankings for log-transformed AP triangulation and contractile failure metrics. Amongst the top 10 most highly-ranked TKIs, there was higher level of correlation between subject A and B in contractile dysfunction (Spearman’s rank correlation, ρ = 0.64, p = 0.054) than AP triangulation rankings (ρ = -0.16, p = 0.65). (E, F) Example AP, CaT, and SL shortening simulation results in the two cell lines showing examples of drug-induced AP triangulation and contractile failure. Dashed black curves represent untreated cells, and colored lines represent predictions for, from left to right, trametinib, gefitinib, nilotinib, and regorafenib in Cell Line A, and trastuzumab, bevacizumab, nilotinib, and pazopanib in Cell Line B.
FIGURE 3
FIGURE 3
Experimental testing of transcriptomic based simulation predictions. (A) Schematic illustrating that iPSC-CMs were loaded with either fluo3 or FluoVolt for CaT or membrane movement recordings, respectively. Metrics were extracted from fluorescence time course measurements for comparison with simulation results. (B, C) Comparison between simulations of Decay Tau (left bar graphs) and SL shortening (right bar graphs) in the two cell lines. Simulation results for control conditions and four drugs in each cell line are shown above experimental results under the same conditions. Results from Cell Lines A and B are displayed in panels (B) and (C), respectively. Error bars indicate standard deviation, and asterisks indicate significantly different from control, based on two sample, unpaired t-test (*p < 0.05, **p < 0.01 and ***p < 0.001). The number of experimental samples in each group is provided beneath the experimental bar graphs. (D) Direct comparison of modeling predictions (abscissa) with experimental data (ordinate), with each expressed as the logarithm of the change in drug-treated relative to vehicle-treated iPSC-CMs. Each dot represents a change in a time course metric (Decay Tau, CaT triangulation, CaT AUC, and SL shortening) caused by changes in gene expression induced by a particular drugs. Results from Cell Lines A and B are grouped together, and the calculated R2 of 0.87 includes 3 data points that induce extreme changes to metrics and are not visible on this scale.
FIGURE 4
FIGURE 4
Simulations and recordings show that the response of iPSC-CMs to arrhythmogenic secondary insults is drug-specific and cell line-specific. (A) Schematic illustrating the calculation of iPSC-CM susceptibility to secondary insults. In simulations, the degree of insult is progressively increased, and the level at which arrhythmic dynamics such as early afterdepolarizations are seen is taken as the threshold. (B) Arrhythmic index (AI), for each drug and in each cell line, is calculated as a weighted average of threshold values for three insults applied, with data transformations applied such that positive AI represents increased susceptibility, and negative AI represents reduced susceptibility. (C, D) Bar graphs show the 5 drugs with the largest and smallest values of AI, in Cell Lines A and B respectively. Note that AI was computed for all 26 drugs tested in the study; results from 16 simulations in each cell line are not shown. (E) Schematic illustrating that APs were recorded in iPSC-CMs loaded with the fluorescent membrane potential indictor FluoVolt. (F, G) Simulated AP traces in Cell Lines A and B, respectively, showing results in untreated cells, in cells treated with a TKI predicted to increase susceptibility, and in cells treated with a TKI predicted to decrease susceptibility. Results are shown at four different levels of hypokalemia, ranging from normal (5.4 mM) to severe hypokalemia (2.5 mM). (H, I) Exemplar AP recordings in Cell Lines A and B, respectively, showing results in untreated cells, in cells treated with a TKI predicted to increase susceptibility, and in cells treated with a TKI predicted to decrease susceptibility. Results are shown at four different levels of hypokalemia, ranging from normal (5.4 mM) to severe hypokalemia (2.5 mM).
FIGURE 5
FIGURE 5
Summary data indicating differential response to hypokalemia between cell lines. (A, B) Violin plots indicating the distributions of Decay Tau (top plots), and AP triangulation (bottom plots), as a function of extracellular [K+], in Cell Lines A and B, respectively. To facilitate statistical comparisons, drug treatments are grouped as either “toxic” drugs or “mitigative” drugs predicted to increase or decrease susceptibility, respectively. Asterisks indicate conditions statistically different from vehicle-treated control cells at the same level of extracellular [K+], using a two sample, unpaired t-test (*p < 0.05, **p < 0.01 and ***p < 0.001). (C, D) Percentage of samples exhibiting arrhythmic dynamics, as a function of extracellular [K+], in Cell Lines A and B, respectively. Drugs predicted to be toxic, namely, trametinib and gefitinib in Cell Line A, and trastuzumab and bevacizumab in Cell Line B, exhibited an increase in arrhythmia percentage at all levels of extracellular [K+]. (E) Comparison of arrhythmia percentage between cell lines, as a function of [K+], under different conditions. The numbers of cells and cover slips under each condition are provided in Supplementary Table S1.
FIGURE 6
FIGURE 6
Mechanisms underlying increased arrhythmia susceptibility caused by individual drugs in the two cell lines. (A, B) Calculations of changes in total charge, ΔQ, passing through individual ionic currents, in Cell Lines A and B, respectively. Simulations were performed at the level of extracellular [K+] immediately before arrhythmias occurred in drug-treated cells, and the integral of each current during the action potential was computed. Bars represent the difference in integrated current, or charge (Q), between drug-treated and untreated cells. (C, D) Summary of changes in ionic currents that accounted for increased susceptibility in the two cell lines. Each panel shows the changes in ionic currents that act to increase arrhythmia risk in red, contrasted with the changes that act to decrease arrhythmia risk in blue.

Similar articles

Cited by

References

    1. Blinova K., Dang Q., Millard D., Smith G., Pierson J., Guo L., et al. (2018). International multisite study of human-induced pluripotent stem cell-derived cardiomyocytes for drug proarrhythmic potential assessment. Cell Rep. 24, 3582–3592. 10.1016/j.celrep.2018.08.079 - DOI - PMC - PubMed
    1. Burridge P. W., Li Y. F., Matsa E., Wu H., Ong S-G., Sharma A., et al. (2016). Human induced pluripotent stem cell–derived cardiomyocytes recapitulate the predilection of breast cancer patients to doxorubicin-induced cardiotoxicity. Nat. Med. 22, 547–556. 10.1038/nm.4087 - DOI - PMC - PubMed
    1. Charwat V., Charrez B., Siemons B. A., Finsberg H., Jaeger K. H., Edwards A. G., et al. (2022). Validating the arrhythmogenic potential of high-intermediate-and low-risk drugs in a human-induced pluripotent stem cell-derived cardiac microphysiological system. ACS Pharmacol. Transl. Sci. 5, 652–667. 10.1021/acsptsci.2c00088 - DOI - PMC - PubMed
    1. Dobin A., Davis C. A., Schlesinger F., Drenkow J., Zaleski C., Jha S., et al. (2013). Star: Ultrafast universal RNA-seq aligner. Bioinformatics 29, 15–21. 10.1093/bioinformatics/bts635 - DOI - PMC - PubMed
    1. Dubois N. C., Craft A. M., Sharma P., Elliott D. A., Stanley E. G., Elefanty A. G., et al. (2011). SIRPA is a specific cell-surface marker for isolating cardiomyocytes derived from human pluripotent stem cells. Nat. Biotechnol. 29, 1011–1018. 10.1038/nbt.2005 - DOI - PMC - PubMed