. 2023 Mar 4;9(4):e13944.
doi: 10.1016/j.heliyon.2023.e13944. eCollection 2023 Apr.

Typical localised element-specific finite element anterior eye model

Affiliations

Typical localised element-specific finite element anterior eye model

Joseph Towler et al. Heliyon. .

Abstract

Purpose: The study presents an averaged anterior eye geometry model combined with a localised material model that is straightforward, appropriate and amenable for implementation in finite element (FE) modelling.

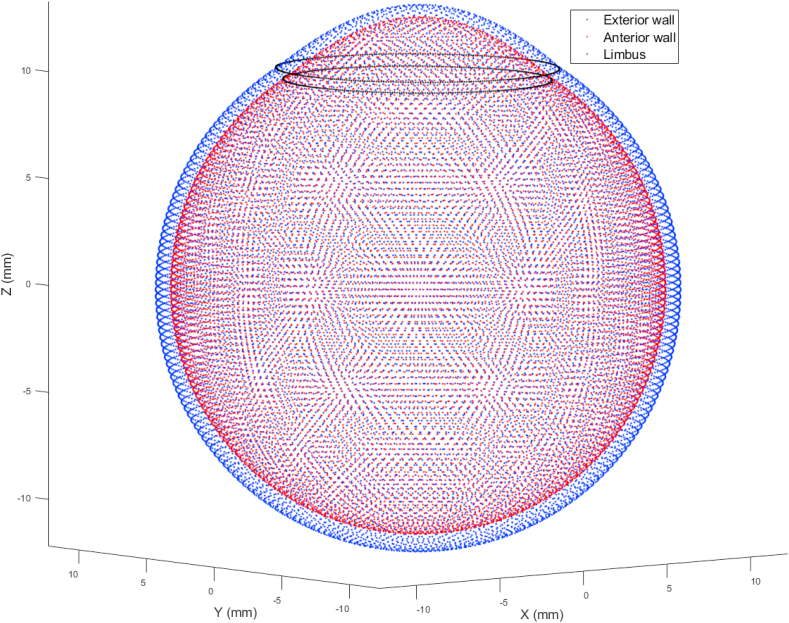
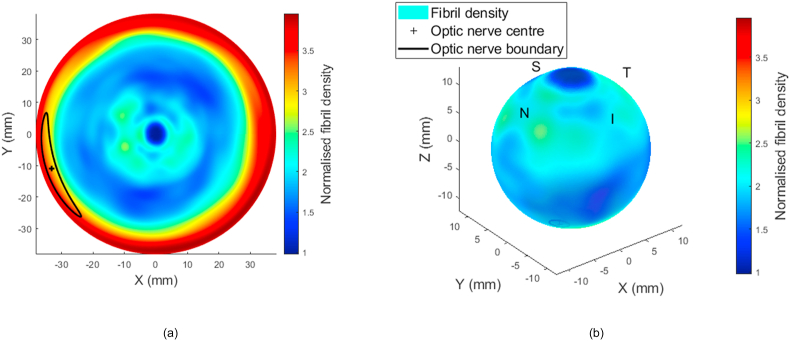
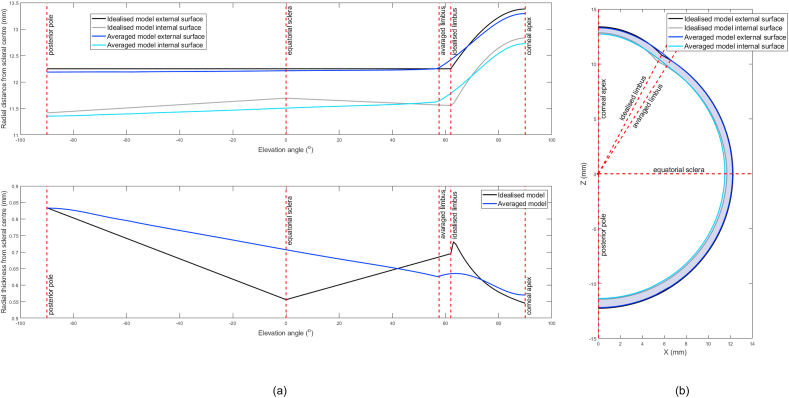
Methods: Both right and left eye profile data of 118 subjects (63 females and 55 males) aged 22-67 years (38.5 ± 7.6) were used to build an averaged geometry model. Parametric representation of the averaged geometry model was achieved through two polynomials dividing the eye into three smoothly connected volumes. This study utilised the collagen microstructure x-ray data of 6 ex-vivo healthy human eyes, 3 right eyes and 3 left eyes in pairs from 3 donors, 1 male and 2 females aged between 60 and 80 years, to build a localised element-specific material model for the eye.

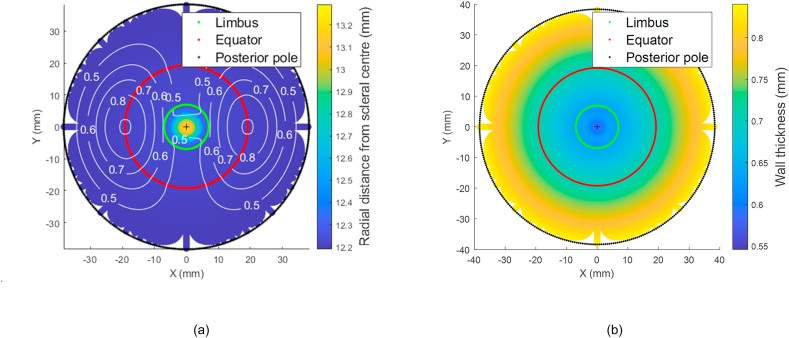
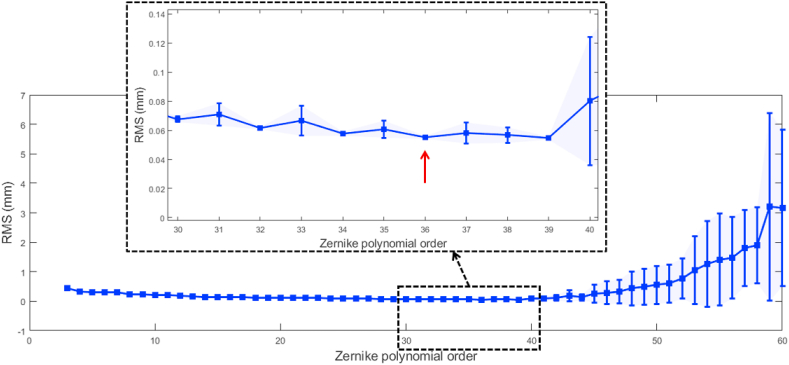
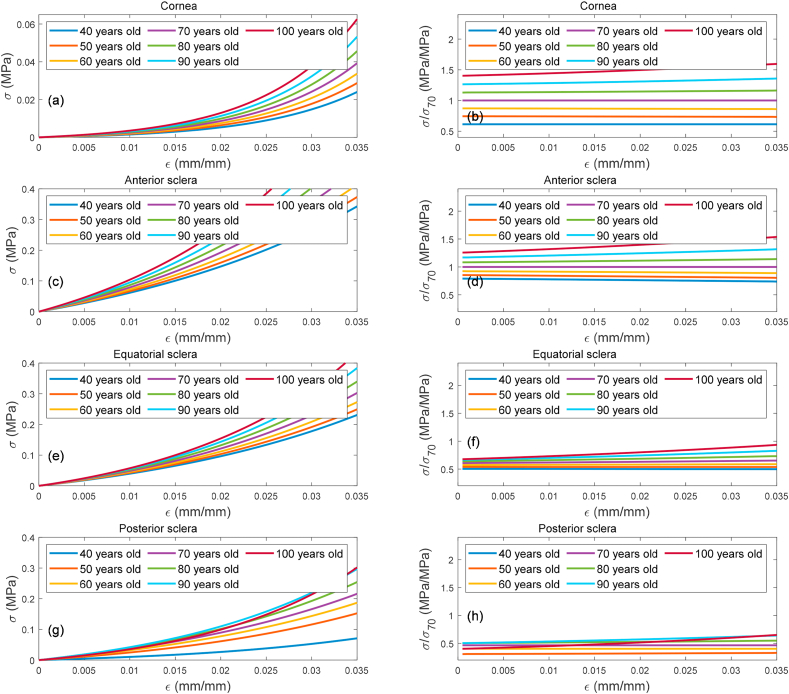
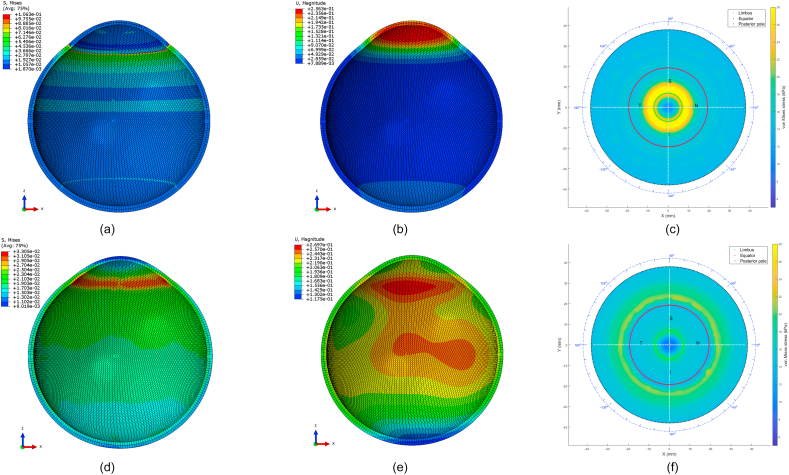
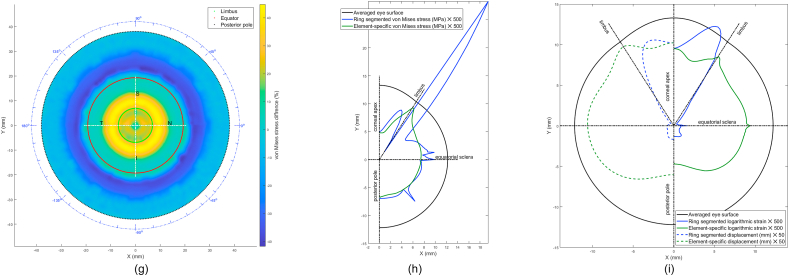
Results: Fitting the cornea and the posterior sclera sections to a 5th-order Zernike polynomial resulted in 21 coefficients. The averaged anterior eye geometry model recorded a limbus tangent angle of 37° at a radius of 6.6 mm from the corneal apex. In terms of material models, the difference between the stresses generated in the inflation simulation up to 15 mmHg in the ring-segmented material model and localised element-specific material model were significantly different (p < 0.001) with the ring-segmented material model recording average Von-Mises stress 0.0168 ± 0.0046 MPa and the localised element-specific material model recording average Von-Mises stress 0.0144 ± 0.0025 MPa.

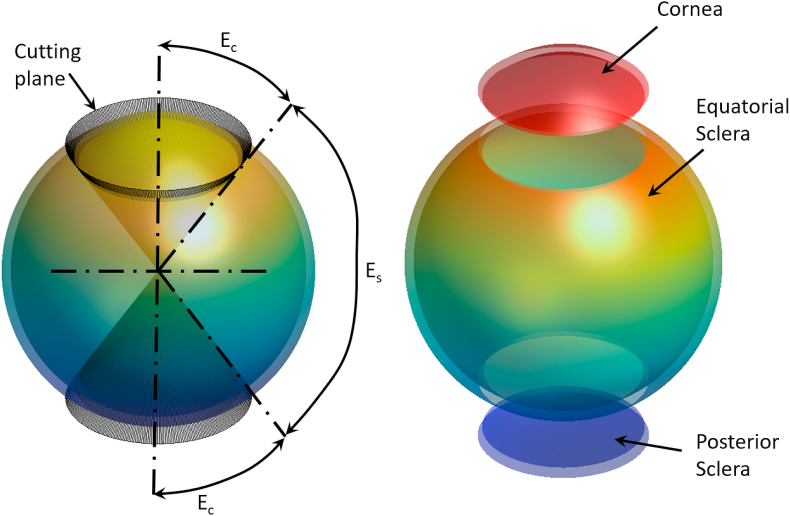
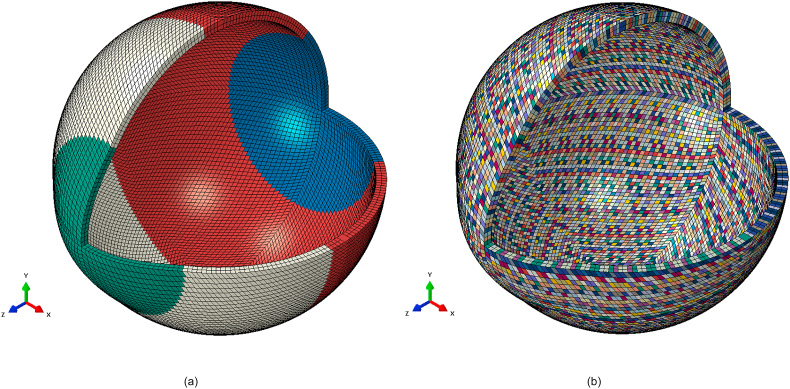
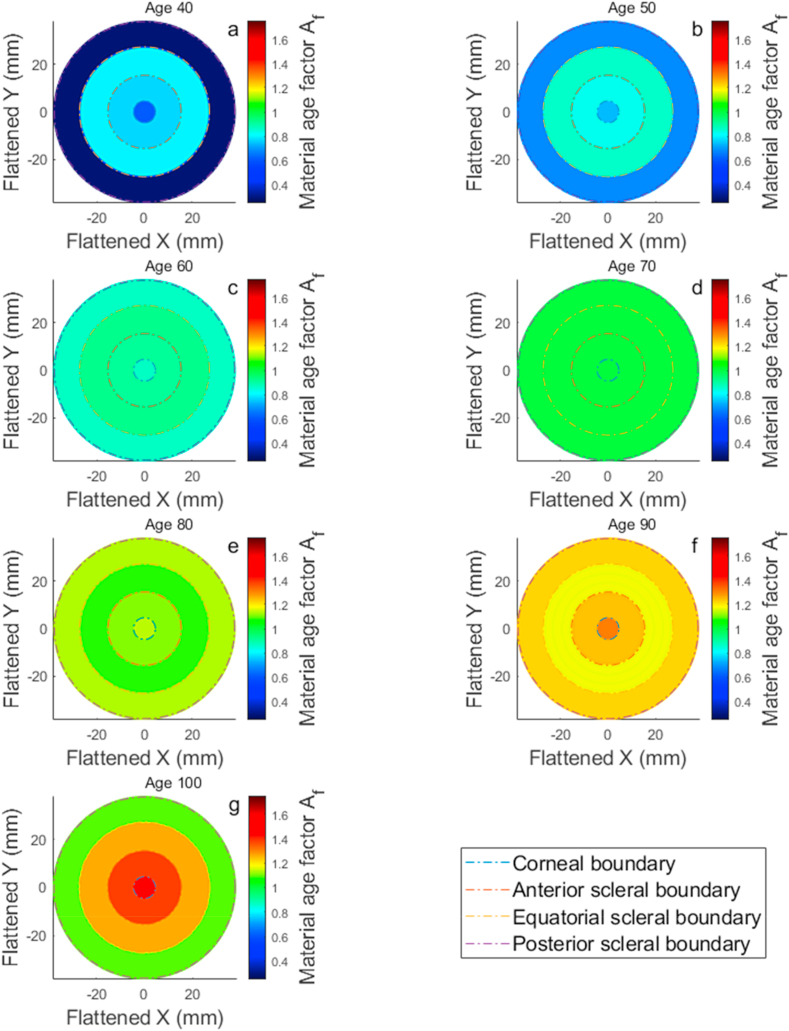
Conclusions: The study illustrates an averaged geometry model of the anterior human eye that is easy to generate through two parametric equations. This model is combined with a localised material model that can be used either parametrically through a Zernike fitted polynomial or non-parametrically as a function of the azimuth angle and the elevation angle of the eye globe. Both averaged geometry and localised material models were built in a way that makes them easy to implement in FE analysis without additional computation cost compared to the limbal discontinuity so-called idealised eye geometry model or ring-segmented material model.

Keywords: Average eye; Eye model; Ideal eye; Localised eye; Mathematical model.


Figures

Fig. 1
Fig. 1
Mathematical modelling plan layout. Green items are the main elements of this study; however, red items are presented to allow comparison of the new models with conventional models.
Fig. 2
Fig. 2
Mean eye globe model resulting from averaging 118 eyes.
Fig. 3
Fig. 3
(a) Mean radial distances of the averaged eye 3D surfaces model flattened to two-dimensional view. The white contour line represents the standard deviation (b) Average eye globe thickness map flattened to two-dimensional view.
Fig. 4
Fig. 4
The eye globe is divided into three sections based on the corneal edge elevation angle Ec and equatorial scleral elevation angle Es, (a) The deviation process, (b) Eye globe volumes separated for display purposes.
Fig. 5
Fig. 5
Averaged geometry eye model with different colours corresponding to different materials (a) Ring-segmented material model, (b) Localised element-specific material model.
Fig. 6
Fig. 6
(a) Fibril density map of the eye flattened in 2D with the corneal apex at the centre and the posterior pole at the periphery. The map is normalised against the fibril density at the corneal apex at the centre of the map. (b) Fibril density map of the eye mapped to the 3D eye shape.
Fig. 7
Fig. 7
K-fold cross-validation RMS error with standard deviation plotted as error bars.
Fig. 8
Fig. 8
Age related effect in corneal stiffness represented by stress-strain behaviour as concluded in [75,123], a, c, e & g. Stresses in the second column subfigures b, d, f & h) were normalised against the stress behaviour of age 70 years ocular tissues.
Fig. 9
Fig. 9
Age related effect in corneal material stiffness age factor maps flatten to two-dimensional views and cover the age range 40(a) to 100(g) years. Subplots b, c, d, e & f represent ages 50, 60, 70, 80 and 90 years, respectively.
Fig. 10
Fig. 10
Limbal discontinuity (idealised) eye model versus averaged eye model geometries (a) against elevation angle, (b) in Cartesian coordinates.
Fig. 11
Fig. 11
Finite element model of the averaged human eye; (a, b, c) without considering localised material model (Ogden model parameters are μc = 0.07, αc = 110.8, μs1 = 0.441, αs1 = 124.5, μs2 = 0.349, αs2 = 138.5, μs3 = 0.308 and αs3 = 162.2); (d, e, f) considering localised material model. Von Mises stresses distribution is shown in (a, d), and displacements distribution (b, e) is plotted at 15 mmHg IOP. The difference between von mises stress in the ring-segmented model (c), and regional element-specific model (f) is shown in (g) as a map and in (h) as a polar plot. Finally, maximum logarithmic strains resulted in the stress-free analysis and their relevant displacements are presented in (i). The Z-axis is aligned with the axial direction of the eye in all subplots.
Fig. 11
Fig. 11
Finite element model of the averaged human eye; (a, b, c) without considering localised material model (Ogden model parameters are μc = 0.07, αc = 110.8, μs1 = 0.441, αs1 = 124.5, μs2 = 0.349, αs2 = 138.5, μs3 = 0.308 and αs3 = 162.2); (d, e, f) considering localised material model. Von Mises stresses distribution is shown in (a, d), and displacements distribution (b, e) is plotted at 15 mmHg IOP. The difference between von mises stress in the ring-segmented model (c), and regional element-specific model (f) is shown in (g) as a map and in (h) as a polar plot. Finally, maximum logarithmic strains resulted in the stress-free analysis and their relevant displacements are presented in (i). The Z-axis is aligned with the axial direction of the eye in all subplots.

References

    1. Pinero D.P., Alcon N. Corneal biomechanics: a review. Clin. Exp. Optom. 2015;98(2):107–116. - PubMed
    1. Dupps W.J., Jr. Biomechanical modeling of corneal ectasia. J. Refract. Surg. 2005;21(2):186–190. - PubMed
    1. Alastrué V. Biomechanical modeling of refractive corneal surgery. J. Biomech. Eng. 2005;128(1):150. - PubMed
    1. Schwiegerling J., Snyder R.W. Custom photorefractive keratectomy ablations for the correction of spherical and cylindrical refractive error and higher-order aberration. J. Opt. Soci. Am. A: Opt. Image Sci. Vis. 1998;15(9):2572–2579. - PubMed
    1. Elsheikh A., et al. Numerical study of the effect of corneal layered structure on ocular biomechanics. Curr. Eye Res. 2009;34(1):26–35. - PubMed

LinkOut - more resources