

Performance of Body Adiposity Index and Relative Fat Mass in Predicting Bioelectric Impedance Analysis-Derived Body Fat Percentage: A Cross-Sectional Study among Patients with Type 2 Diabetes in the Ho Municipality, Ghana
- PMID: 37101689
- PMCID: PMC10125734
- DOI: 10.1155/2023/1500905
Performance of Body Adiposity Index and Relative Fat Mass in Predicting Bioelectric Impedance Analysis-Derived Body Fat Percentage: A Cross-Sectional Study among Patients with Type 2 Diabetes in the Ho Municipality, Ghana
Abstract
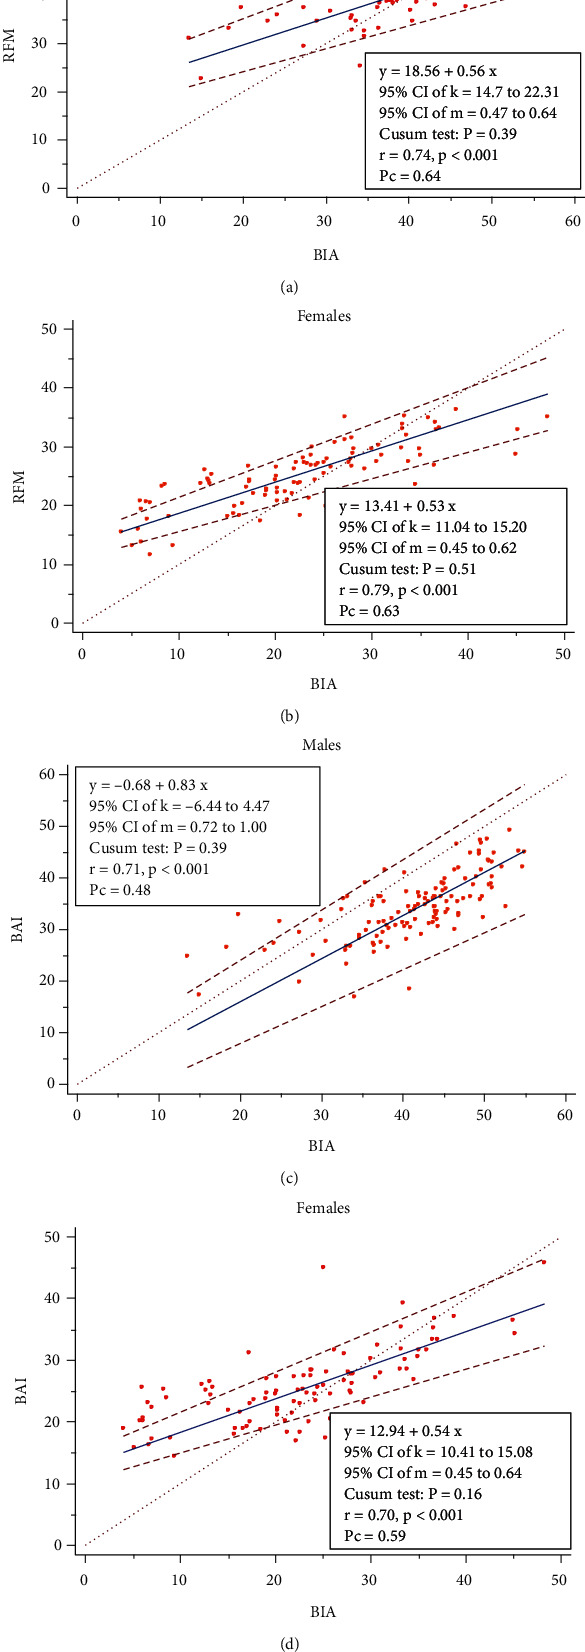
Objective: The study sought to determine the diagnostic accuracy of body adiposity index (BAI) and relative fat mass (RFM) to predict BIA-derived BFP among patients with type 2 diabetes in the Ho municipality. Materials and Method. This hospital-based cross-sectional study involved 236 patients with type 2 diabetes. Demographic data, including age and gender were obtained. Height, waist circumference (WC), and hip circumference (HC) were measured using standard methods. BFP was estimated on a bioelectrical impedance analysis (BIA) scale. The validity of BAI and RFM as alternative estimates for BIA-derived BFP was evaluated based on mean absolute percentage error (MAPE), Passing-Bablok regression, Bland-Altman plots, receiver-operating characteristic curve (ROC), and kappa statistics analyses. A p value less than 0.05 was considered statistically significant.
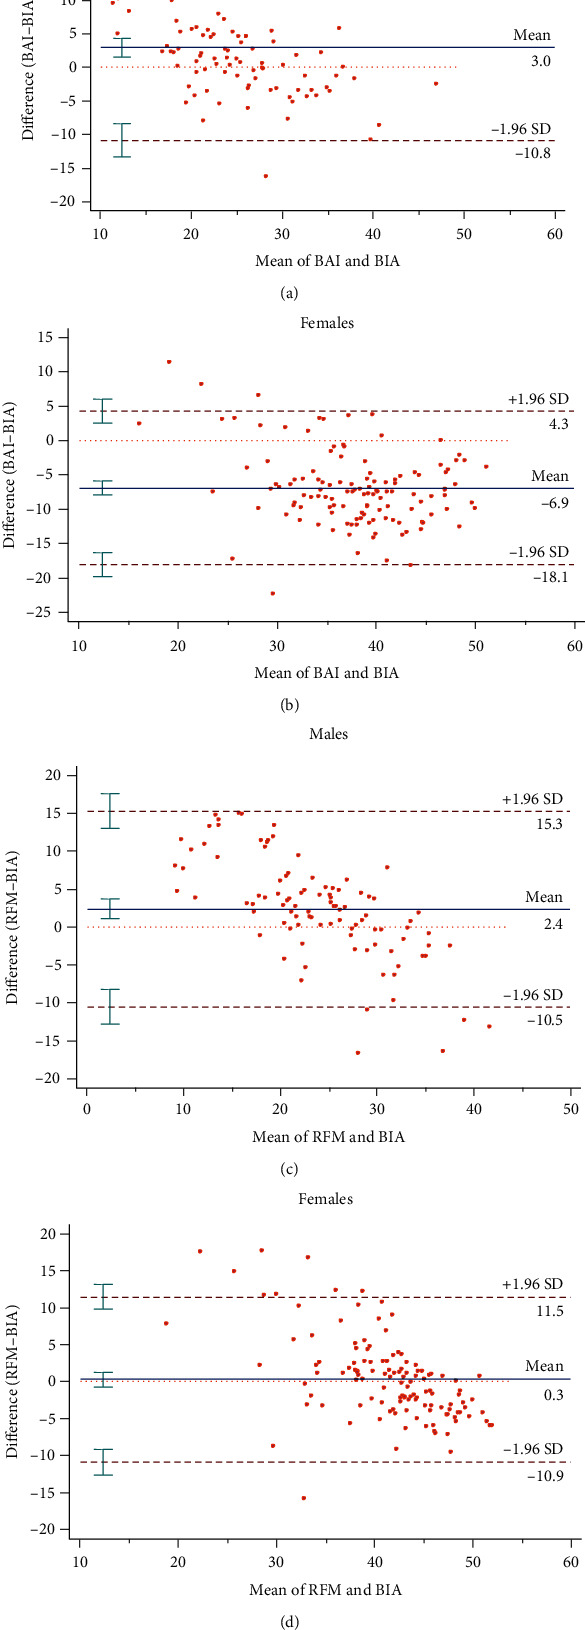
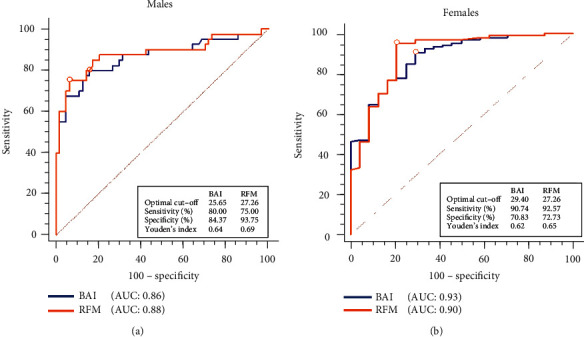
Results: BAI showed systematic bias in estimating BIA-derived BFP in both genders, but this was not evident between RFM and BFP among females (t = -0.62; p = 0.534). While BAI showed "good" predictive accuracy in both genders, RFM exhibited "high" predictive accuracy for BFP (MAPE: 7.13%; 95% CI: 6.27-8.78) among females according to MAPE analysis. From the Bland-Altman plot analysis, the mean difference between RFM and BFP was acceptable among females [0.3 (95% LOA: -10.9 to 11.5)], but both BAI and RFM recorded large limits of agreement and low Lin's concordance correlation coefficient with BFP (Pc < 0.90) in the two gender populations. The optimal cut-off, sensitivity, specificity, and Youden index for RFM were >27.2, 75%, 93.75%, and 0.69, respectively, while those of BAI were >25.65, 80%, 84.37%, and 0.64, respectively, among males. Among females, the values for RFM were >27.26, 92.57%, 72.73%, and 0.65, whereas those of BAI were >29.4, 90.74%, 70.83%, and 0.62, respectively. The accuracy of discriminating between BFP levels was higher among females [BAI (AUC: 0.93) and RFM (AUC: 0.90)] compared to males [BAI (AUC: 0.86) and RFM (AUC: 0.88)].
Conclusion: RFM had a better predictive accuracy of BIA-derived BFP in females. However, both RFM and BAI failed as valid estimates for BFP. Furthermore, gender-specific performance in the discrimination of BFP levels for RFM and BAI was observed.
Copyright © 2023 Sylvester Yao Lokpo et al.
Conflict of interest statement
The authors declare that there is no conflict of interest.
Figures
Similar articles
-
The Role of Body Adiposity Index in Determining Body Fat Percentage in Colombian Adults with Overweight or Obesity.Int J Environ Res Public Health. 2017 Sep 21;14(10):1093. doi: 10.3390/ijerph14101093. Int J Environ Res Public Health. 2017. PMID: 28934175 Free PMC article.
-
Body Adiposity Index Performance in Estimating Body Fat Percentage in Colombian College Students: Findings from the FUPRECOL-Adults Study.Nutrients. 2017 Jan 17;9(1):40. doi: 10.3390/nu9010040. Nutrients. 2017. PMID: 28106719 Free PMC article.
-
[Screening value and correlation of body measurement indices for metabolic syndrome in the population undergoing physical examinations in Chengdu during 2018-2020].Wei Sheng Yan Jiu. 2024 Jan;53(1):21-29. doi: 10.19813/j.cnki.weishengyanjiu.2024.01.004. Wei Sheng Yan Jiu. 2024. PMID: 38443169 Chinese.
-
Validity of the Body Adiposity Index in Predicting Body Fat in Adults: A Systematic Review.Adv Nutr. 2018 Sep 1;9(5):617-624. doi: 10.1093/advances/nmy043. Adv Nutr. 2018. PMID: 30239583 Free PMC article.
-
Visceral adiposity and inflammatory bowel disease.Int J Colorectal Dis. 2021 Nov;36(11):2305-2319. doi: 10.1007/s00384-021-03968-w. Epub 2021 Jun 9. Int J Colorectal Dis. 2021. PMID: 34104989 Review.
Cited by
-
Comparison of Several Anthropometric Indices Related to Body Fat in Predicting Cardiorespiratory Fitness in School-Aged Children-A Single-Center Cross-Sectional Study.J Clin Med. 2023 Sep 27;12(19):6226. doi: 10.3390/jcm12196226. J Clin Med. 2023. PMID: 37834868 Free PMC article.
-
Relative Fat Mass and Physical Indices as Predictors of Gallstone Formation: Insights From Machine Learning and Logistic Regression.Int J Gen Med. 2025 Jan 31;18:509-527. doi: 10.2147/IJGM.S507013. eCollection 2025. Int J Gen Med. 2025. PMID: 39911297 Free PMC article.
-
Adiposity indices mediate the association between dietary inflammatory index and type 2 diabetes risk in women with prior gestational diabetes mellitus.Diabetol Metab Syndr. 2025 Jul 16;17(1):275. doi: 10.1186/s13098-025-01826-1. Diabetol Metab Syndr. 2025. PMID: 40671107 Free PMC article.
-
Gender Differences in the Predictive Value of Obesity Indices for Insulin Resistance in Adult Mexican Individuals.Endocr Metab Immune Disord Drug Targets. 2024;24(14):1640-1650. doi: 10.2174/0118715303284893240215070923. Endocr Metab Immune Disord Drug Targets. 2024. PMID: 38415492
-
Validity of non-traditional measures of obesity compared to total body fat across the life course: A systematic review and meta-analysis.Obes Rev. 2025 Jun;26(6):e13894. doi: 10.1111/obr.13894. Epub 2025 Jan 24. Obes Rev. 2025. PMID: 39861925 Free PMC article.
References
-
- NCD Risk Factor Collaboration (NCD-RisC) Trends in adult body-mass index in 200 countries from 1975 to 2014: a pooled analysis of 1698 population-based measurement studies with 19·2 million participants. The Lancet . 2016;387(10026):1377–1396. doi: 10.1016/S0140-6736(16)30054-X. - DOI - PMC - PubMed
MeSH terms
LinkOut - more resources
Full Text Sources
Medical
