

Azithromycin Protects Retinal Glia Against Oxidative Stress-Induced Morphological Changes, Inflammation, and Cell Death
- PMID: 37101900
- PMCID: PMC10125304
- DOI: 10.1021/acsbiomedchemau.2c00013
Azithromycin Protects Retinal Glia Against Oxidative Stress-Induced Morphological Changes, Inflammation, and Cell Death
Abstract
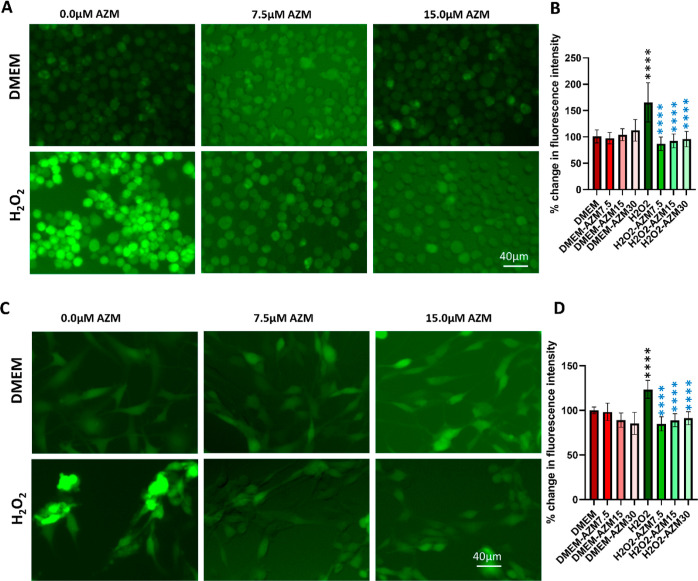
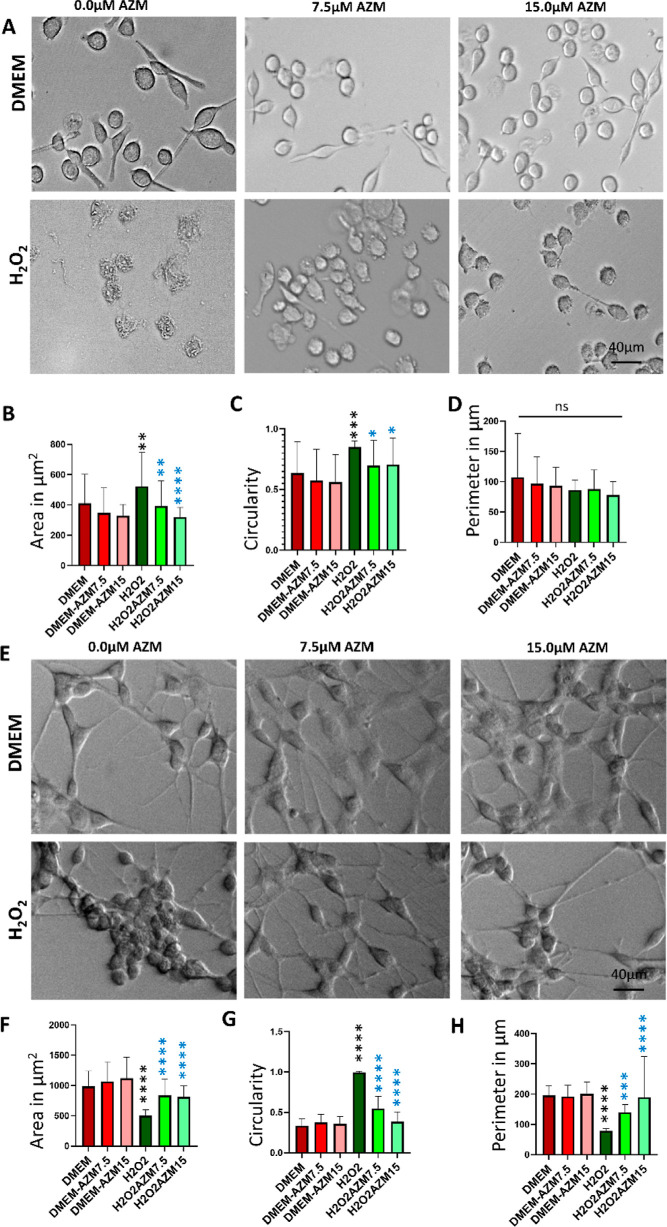
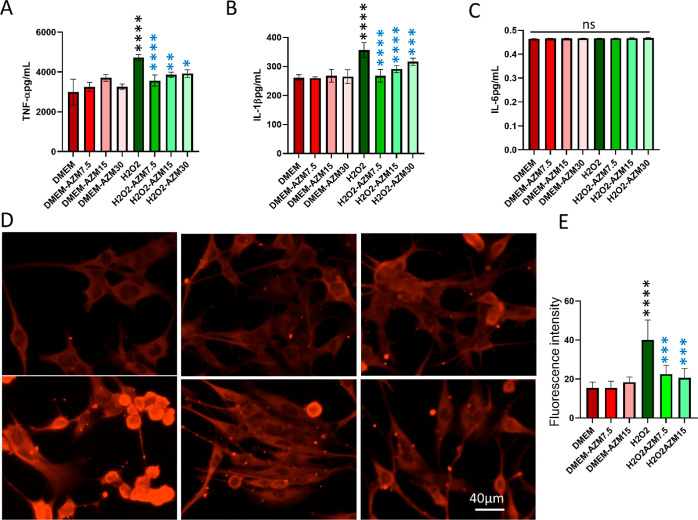
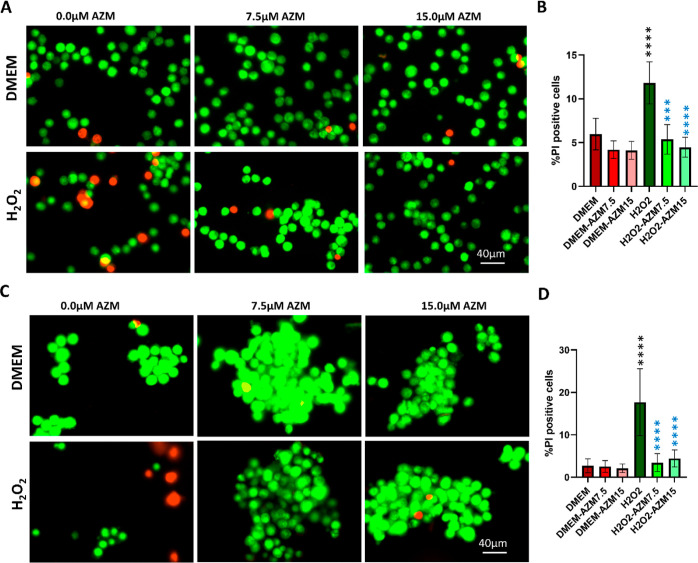
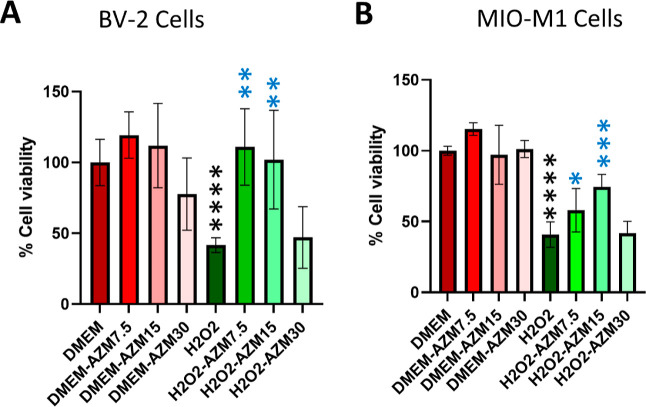
The reactivity of retinal glia in response to oxidative stress has a significant effect on retinal pathobiology. The reactive glia change their morphology and secret cytokines and neurotoxic factors in response to oxidative stress associated with retinal neurovascular degeneration. Therefore, pharmacological intervention to protect glial health against oxidative stress is crucial for maintaining homeostasis and the normal function of the retina. In this study, we explored the effect of azithromycin, a macrolide antibiotic with antioxidant, immunomodulatory, anti-inflammatory, and neuroprotective properties against oxidative stress-induced morphological changes, inflammation, and cell death in retinal microglia and Müller glia. Oxidative stress was induced by H2O2, and the intracellular oxidative stress was measured by DCFDA and DHE staining. The change in morphological characteristics such as the surface area, perimeter, and circularity was calculated using ImageJ software. Inflammation was measured by enzyme-linked immunosorbent assays for TNF-α, IL-1β, and IL-6. Reactive gliosis was characterized by anti-GFAP immunostaining. Cell death was measured by MTT assay, acridine orange/propidium iodide, and trypan blue staining. Pretreatment of azithromycin inhibits H2O2-induced oxidative stress in microglial (BV-2) and Müller glial (MIO-M1) cells. We observed that azithromycin inhibits oxidative stress-induced morphological changes, including the cell surface area, circularity, and perimeter in BV-2 and MIO-M1 cells. It also inhibits inflammation and cell death in both the glial cells. Azithromycin could be used as a pharmacological intervention on maintaining retinal glial health during oxidative stress.
© 2022 The Authors. Published by American Chemical Society.
Conflict of interest statement
The authors declare no competing financial interest.
Figures
Similar articles
-
Mustard gas exposure instigates retinal Müller cell gliosis.Exp Eye Res. 2023 May;230:109461. doi: 10.1016/j.exer.2023.109461. Epub 2023 Apr 5. Exp Eye Res. 2023. PMID: 37023936 Free PMC article.
-
Effects of Cord Blood Serum (CBS) on viability of retinal Müller glial cells under in vitro injury.PLoS One. 2020 Jun 4;15(6):e0234145. doi: 10.1371/journal.pone.0234145. eCollection 2020. PLoS One. 2020. PMID: 32497126 Free PMC article.
-
Matrix metalloproteinase-9 (MMP-9) and tissue inhibitor of metalloproteinases 1 (TIMP-1) are localized in the nucleus of retinal Müller glial cells and modulated by cytokines and oxidative stress.PLoS One. 2021 Jul 16;16(7):e0253915. doi: 10.1371/journal.pone.0253915. eCollection 2021. PLoS One. 2021. PMID: 34270579 Free PMC article.
-
Cellular and molecular alterations in neurons and glial cells in inherited retinal degeneration.Front Neuroanat. 2022 Sep 26;16:984052. doi: 10.3389/fnana.2022.984052. eCollection 2022. Front Neuroanat. 2022. PMID: 36225228 Free PMC article. Review.
-
Regulations of Retinal Inflammation: Focusing on Müller Glia.Front Cell Dev Biol. 2022 Apr 27;10:898652. doi: 10.3389/fcell.2022.898652. eCollection 2022. Front Cell Dev Biol. 2022. PMID: 35573676 Free PMC article. Review.
Cited by
-
Mustard gas exposure instigates retinal Müller cell gliosis.Exp Eye Res. 2023 May;230:109461. doi: 10.1016/j.exer.2023.109461. Epub 2023 Apr 5. Exp Eye Res. 2023. PMID: 37023936 Free PMC article.
-
The metabolic footprint of Vero E6 cells highlights the key metabolic routes associated with SARS-CoV-2 infection and response to drug combinations.Sci Rep. 2024 Apr 4;14(1):7950. doi: 10.1038/s41598-024-57726-3. Sci Rep. 2024. PMID: 38575586 Free PMC article.
-
Glial Modulator Antibiotics for Neuropathic Pain: Current Insights and Future Directions.Pharmaceuticals (Basel). 2025 Feb 28;18(3):346. doi: 10.3390/ph18030346. Pharmaceuticals (Basel). 2025. PMID: 40143124 Free PMC article. Review.
-
The Mechanism of PMC (2,2,5,7,8-Pentamethyl-6-chromanol), a Sterically Hindered Phenol Antioxidant, in Rescuing Oxidized Low-Density-Lipoprotein-Induced Cytotoxicity in Human Retinal Pigment Epithelial Cells.Antioxidants (Basel). 2025 Aug 14;14(8):996. doi: 10.3390/antiox14080996. Antioxidants (Basel). 2025. PMID: 40867892 Free PMC article.
-
Nanomedicine in Ophthalmology: From Bench to Bedside.J Clin Med. 2024 Dec 16;13(24):7651. doi: 10.3390/jcm13247651. J Clin Med. 2024. PMID: 39768574 Free PMC article. Review.
References
LinkOut - more resources
Full Text Sources
Miscellaneous