. 2023 Mar 7;4(2):48-59.
doi: 10.1016/j.cvdhj.2023.03.001. eCollection 2023 Apr.

Artificial intelligence-enabled classification of hypertrophic heart diseases using electrocardiograms

Affiliations

Artificial intelligence-enabled classification of hypertrophic heart diseases using electrocardiograms

Julian S Haimovich et al. Cardiovasc Digit Health J. .

Abstract

Background: Differentiating among cardiac diseases associated with left ventricular hypertrophy (LVH) informs diagnosis and clinical care.

Objective: To evaluate if artificial intelligence-enabled analysis of the 12-lead electrocardiogram (ECG) facilitates automated detection and classification of LVH.

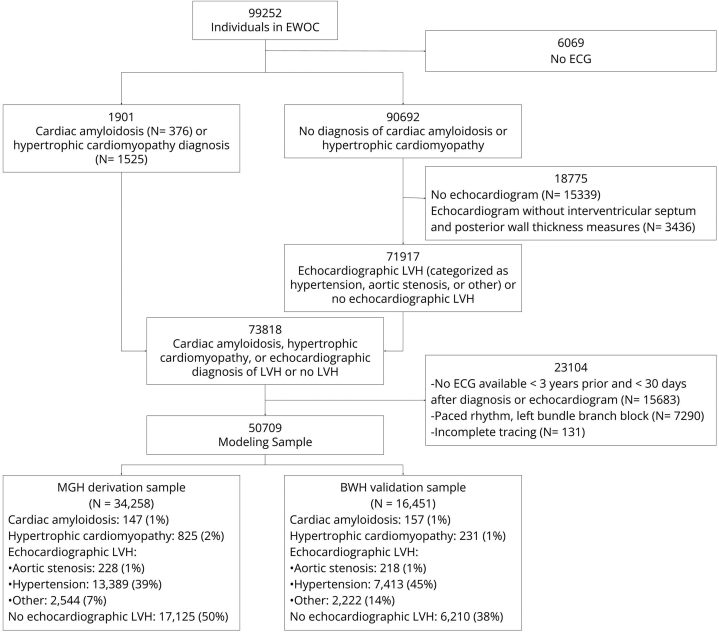
Methods: We used a pretrained convolutional neural network to derive numerical representations of 12-lead ECG waveforms from patients in a multi-institutional healthcare system who had cardiac diseases associated with LVH (n = 50,709), including cardiac amyloidosis (n = 304), hypertrophic cardiomyopathy (n = 1056), hypertension (n = 20,802), aortic stenosis (n = 446), and other causes (n = 4766). We then regressed LVH etiologies relative to no LVH on age, sex, and the numerical 12-lead representations using logistic regression ("LVH-Net"). To assess deep learning model performance on single-lead data analogous to mobile ECGs, we also developed 2 single-lead deep learning models by training models on lead I ("LVH-Net Lead I") or lead II ("LVH-Net Lead II") from the 12-lead ECG. We compared the performance of the LVH-Net models to alternative models fit on (1) age, sex, and standard ECG measures, and (2) clinical ECG-based rules for diagnosing LVH.

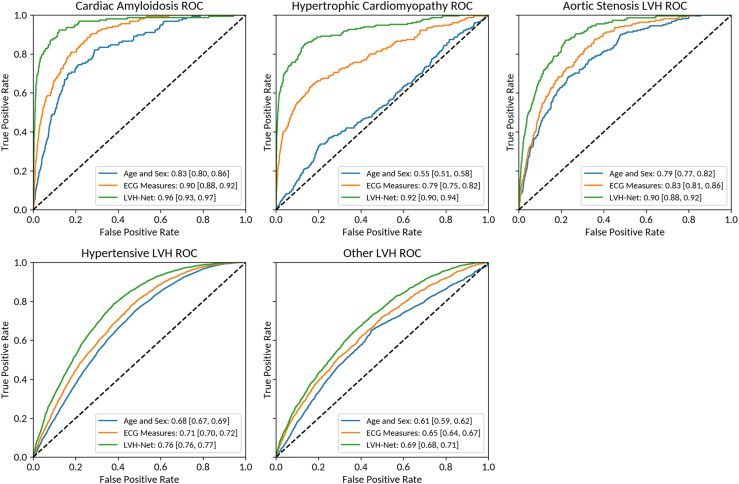
Results: The areas under the receiver operator characteristic curve of LVH-Net by specific LVH etiology were cardiac amyloidosis 0.95 [95% CI, 0.93-0.97], hypertrophic cardiomyopathy 0.92 [95% CI, 0.90-0.94], aortic stenosis LVH 0.90 [95% CI, 0.88-0.92], hypertensive LVH 0.76 [95% CI, 0.76-0.77], and other LVH 0.69 [95% CI 0.68-0.71]. The single-lead models also discriminated LVH etiologies well.

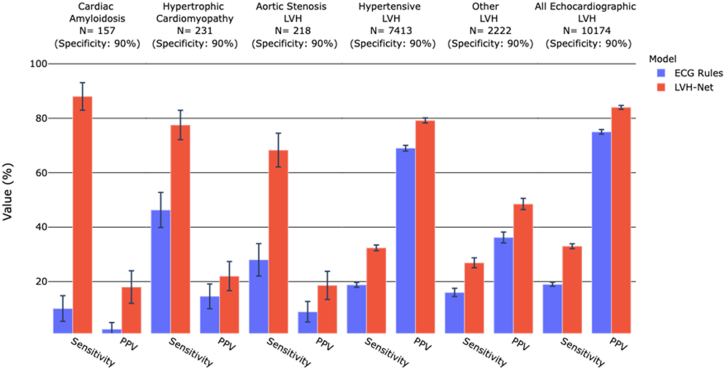
Conclusion: An artificial intelligence-enabled ECG model is favorable for detection and classification of LVH and outperforms clinical ECG-based rules.

Keywords: Artificial intelligence; Cardiac amyloidosis; Electrocardiography; Hypertrophic cardiomyopathy; Hypertrophic heart disease.


Figures

Figure 1
Figure 1
CONSORT diagram of Massachusetts General Hospital (MGH) derivation and Brigham and Women’s Hospital (BWH) validation samples. ECG = electrocardiogram; EWOC = Enterprise Warehouse of Cardiology; LVH = left ventricular hypertrophy.
Figure 2
Figure 2
Modeling overview. Modeling schema of comparison models (A) and deep learning models (B). A: The Age and Sex Model includes terms for patient age and sex in a logistic regression model. The ECG Measures Model includes quantitative electrocardiogram (ECG) measures along with patient age and sex in a logistic regression model. B: In LVH-Net, the 12-lead ECG waveform is first converted into a 320-dimensional representation using PCLR (Patient Contrastive Learning of Representations; see text). The representation, along with patient age and sex, are input into a logistic regression model that is trained to classify left ventricular hypertrophy (LVH) etiology, including cardiac amyloidosis, hypertrophic cardiomyopathy, aortic stenosis LVH, hypertensive LVH, other LVH, and no LVH. LVH-Net Lead I and LVH-Net Lead II models use PCLR representations derived only from ECG waveform data of ECG leads I and II, respectively.
Figure 3
Figure 3
Receiver operating characteristic curves (ROC) of LVH-Net and comparison models by left ventricular hypertrophy (LVH) etiology vs no LVH. ROC curves of comparison models (age and sex, electrocardiogram [ECG] measures) and LVH-Net by LVH etiology vs no LVH comparator with corresponding area under the ROC and 95% confidence interval shown in the legend. Dashed line shows expected performance of “no skill” random classifier at area under the curve of 0.5.
Figure 4
Figure 4
Median waveforms of electrocardiograms (ECGs) predicted to be at low risk (5th percentile) (green) and high risk (95th percentile) (red) of LVH-Net risk of A: cardiac amyloidosis and B: hypertrophic cardiomyopathy. Grid measures correspond to standard ECG scaling (1 small box per 0.1 mm on y-axis, and 1 small box per 0.2 seconds on x-axis). Median waveforms are shown for leads I, II, V1, and V5.
Figure 5
Figure 5
Test characteristics of clinical electrocardiogram (ECG) rules vs deep learning models for classification of left ventricular hypertrophy (LVH) etiology vs no LVH at equivalent specificity. Grouped bar plot of sensitivity and positive predictive value (PPV) for classification of LVH etiology and echocardiographic LVH vs no LVH by clinical ECG LVH rules (blue) and LVH-Net (red). LVH-Net test characteristics were calculated at the probability cutoff that yielded a specificity equal to the specificity of the clinical ECG LVH rules. The specificity of the clinical ECG rules is shown above each facet, along with the number of cases in the validation sample. Error bars represent 95% confidence interval.
Figure 6
Figure 6
Cumulative incidence of clinical outcomes by predicted LVH-Net risk of cardiac amyloidosis and hypertrophic cardiomyopathy. Cumulative incidence of heart failure, atrial fibrillation, and mortality by tertiles of increasing predicted LVH-Net risk of A: cardiac amyloidosis and B: hypertrophic cardiomyopathy in the validation sample, excluding individuals with known cardiac amyloid and hypertrophic cardiomyopathy. At-risk counts for each tertile are shown below each plot. Error bars represent 95% confidence intervals.

References

    1. Vakili B.A., Okin P.M., Devereux R.B. Prognostic implications of left ventricular hypertrophy. Am Heart J. 2001;141:334–341. - PubMed
    1. Savage D.D., Garrison R.J., Kannel W.B., et al. The spectrum of left ventricular hypertrophy in a general population sample: the Framingham Study. Circulation. 1987;75:I26–I33. - PubMed
    1. Gertz M.A., Dispenzieri A. Systemic amyloidosis recognition, prognosis, and therapy: a systematic review. JAMA. 2020;324:79–89. - PubMed
    1. Gradman A.H., Alfayoumi F. From left ventricular hypertrophy to congestive heart failure: management of hypertensive heart disease. Prog Cardiovasc Dis. 2006;48:326–341. - PubMed
    1. Makavos G., Kappaairis C., Tselegkidi M.E., et al. Hypertrophic cardiomyopathy: an updated review on diagnosis, prognosis, and treatment. Heart Fail Rev. 2019;24:439–459. - PubMed

LinkOut - more resources