. 2023 Mar 29;26(4):106509.
doi: 10.1016/j.isci.2023.106509. eCollection 2023 Apr 21.

Novel enhancers conferring compensatory transcriptional regulation of Nkx2-5 in heart development

Affiliations

Novel enhancers conferring compensatory transcriptional regulation of Nkx2-5 in heart development

Jiejie Zhang et al. iScience. .

Abstract

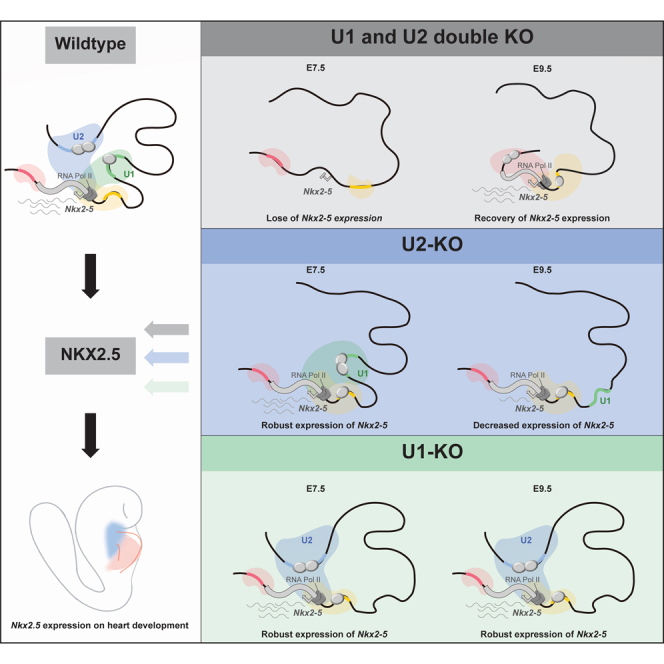
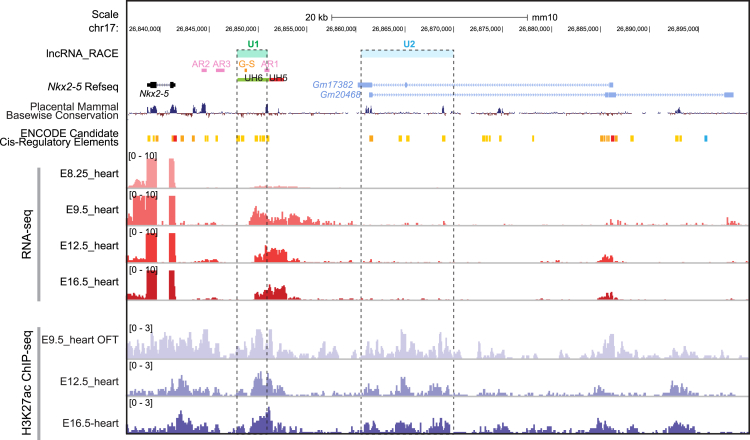
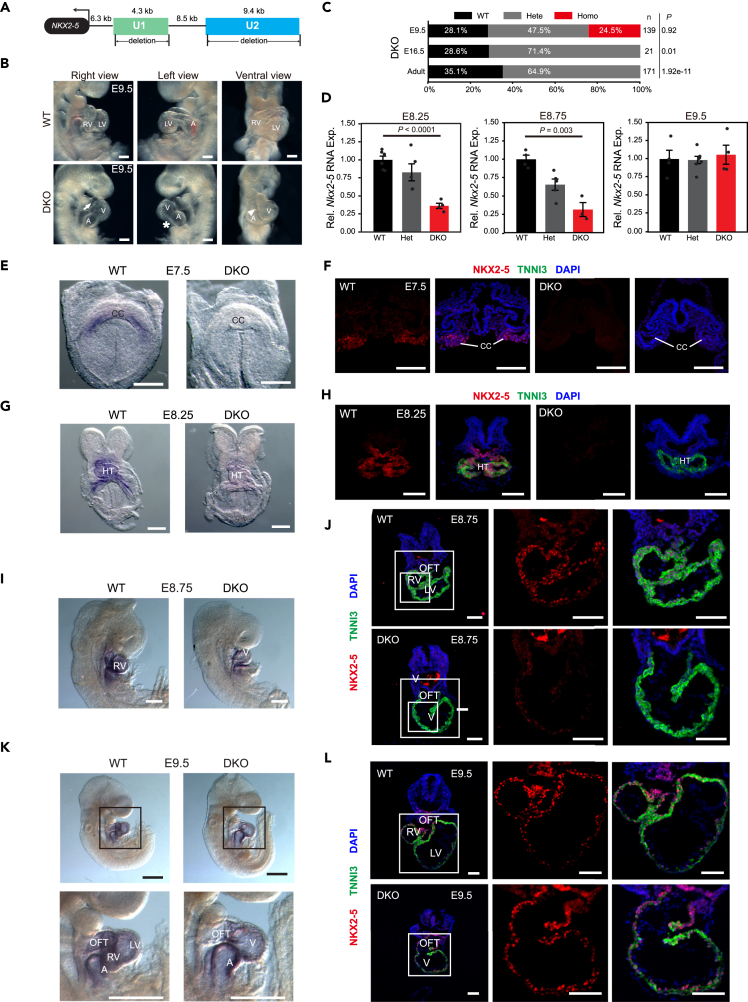
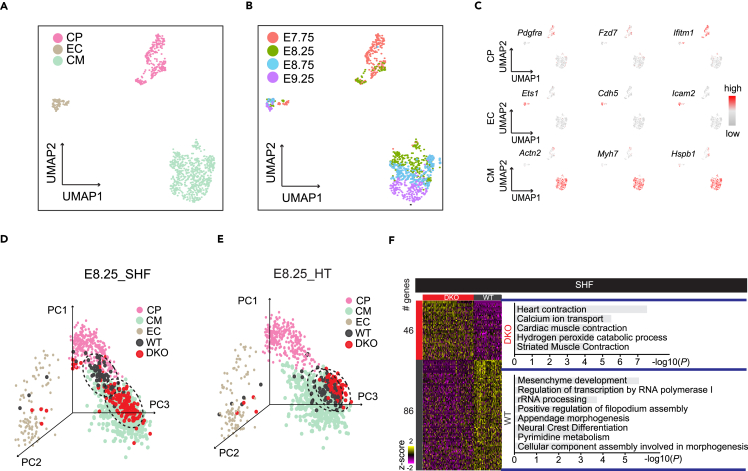
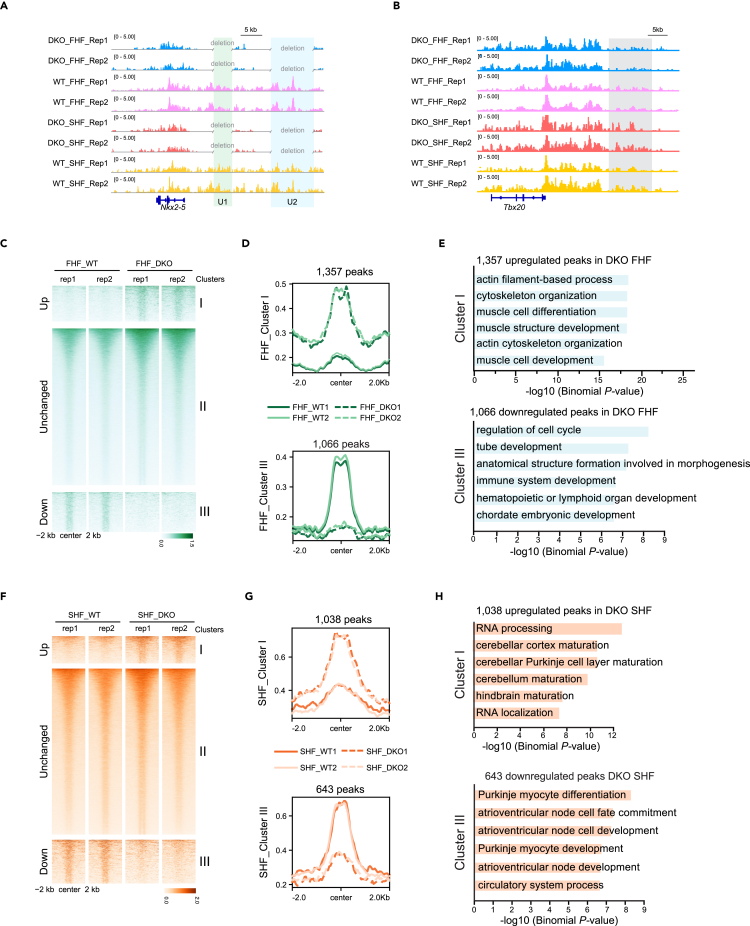
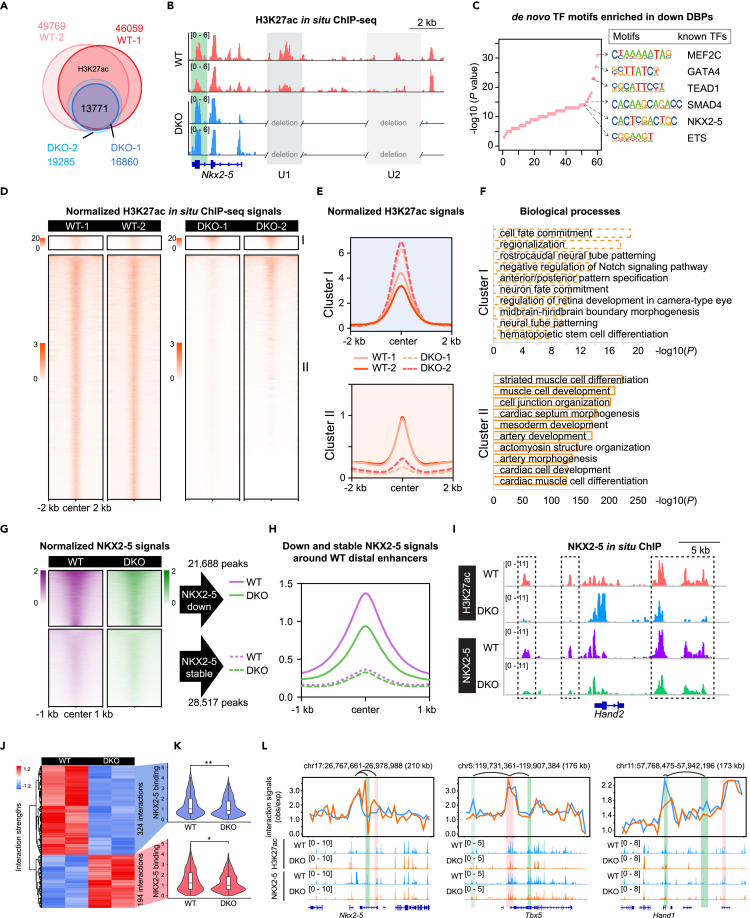
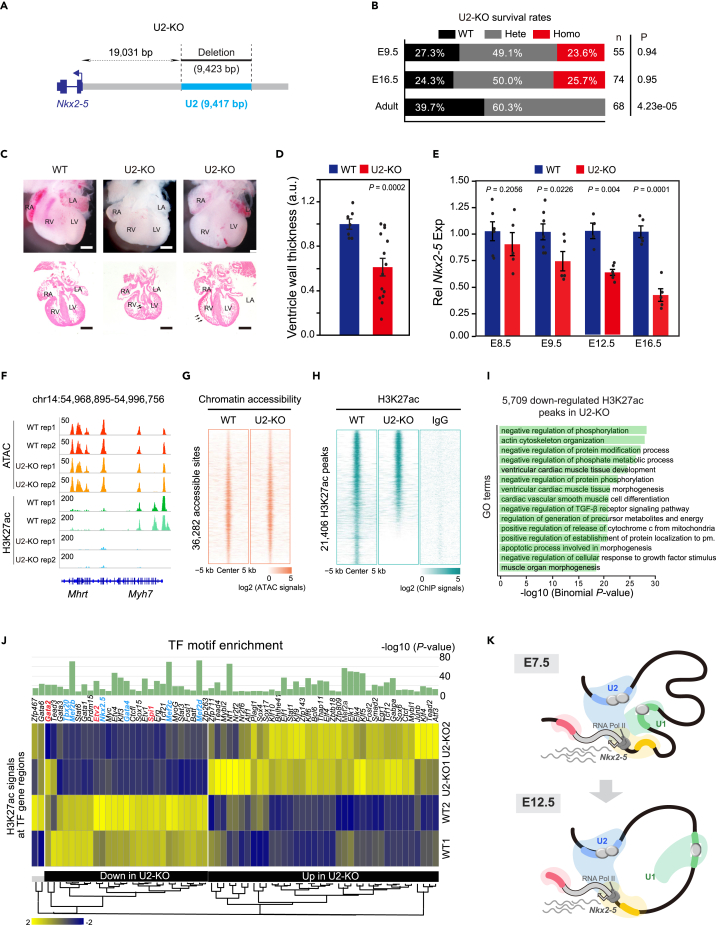
Cell type-specific expression of the developmental gene is conferred by distinct enhancer elements. Current knowledge about mechanisms in Nkx2-5 transcriptional regulation and its specific roles in multistage heart morphogenesis is limited. We comprehensively interrogate enhancers U1 and U2 in controlling Nkx2-5 transcription during heart development. Serial genomic deletions in mice reveal U1 and U2 function redundantly to confer Nkx2-5 expression at early stages, but U2 instead of U1 supports its expression at later stages. Combined deletions markedly reduce Nkx2-5 dosage as early as E7.5, despite being largely reinstated two days later, displaying heart malformations with precocious differentiation of cardiac progenitors. Cutting-edge low-input chromatin immunoprecipitation sequencing (ChIP-seq) confirmed that not only genomic NKX2-5 occupancy but also its regulated enhancer landscape is mostly disturbed in the double-deletion mouse hearts. Together, we propose a model that the temporal and partially compensatory regulatory function of two enhancers dictates a transcription factor (TF)'s dosage and specificity during development.

Keywords: Biological sciences; Developmental biology; Developmental genetics.


Conflict of interest statement

The authors declare no competing interests.

Figures

None
Graphical abstract
Figure 1
Figure 1
Characterization of regulatory regions around Nkx2-5 during early heart development RNA-seq tracks for E8.25 (EBI: ERR332388), E9.5 (GEO: GSE104670), E12.5 (GEO: GSE82471), and E16.5 (GEO: GSE78317) hearts were in red. H3K27ac ChIP-seq tracks for E9.5 OFT, E12.5 (GEO: GSE82449), and E16.5 (GEO: GSE82973) hearts were in purple. The AR1, AR2, and AR3 enhancers (Schwartz & Olson, 1999) were in magenta, and the G-S enhancer (III et al., 2004) was in orange, as well as the UH5 and UH6 enhancers (Chi et al., 2005) were in red and blue, respectively. The newly identified U1 and U2 enhancers were in light green and light blue, respectively. OFT, outflow tract. See also Figure S1.
Figure 2
Figure 2
Temporal alteration of Nkx2-5 expression in U1/U2 double-deletion mice during heart developmental progression (A) Schematic of the strategy for the double-knockout (DKO) mice generation. (B) Gross morphological examination of E9.5 hearts from DKO mice. DKO mice showed severe SHF defects. The arrow indicated the underdeveloped outflow tract. The asterisk indicated the open atrioventricular chamber. The arrowhead indicated the single ventricle. Scale bar, 200 μm. (C) Survival analysis of DKO strains determined by heterozygote intercrosses at three indicated developmental stages. p-value was calculated by chi-squared test. (D) RT-qPCR for Nkx2-5 in WT, Het (Heterozygotes), and DKO embryonic hearts at E8.25, E8.75, and E9.5. RNA expression levels were normalized to 18s rRNA. Data were mean ± s.e.m. p-value was calculated by Student’s t-test. (E, G, I, and K) Whole-mount in situ hybridization of Nkx2-5 in WT and DKO embryos at E7.5 (E), E8.25 (G), E8.75 (I), and E9.5 (K). Scale bar, 500 μm in (K) and 200 μm in (E, G, and I). (F, H, J, and L) Immunofluorescence staining of NKX2-5 (red), TNNI3 (green), and DAPI (blue) in WT and DKO at E7.5 (F), E8.25 (H), E8.75 (J), and E9.5 (L). Insets of heart regions were shown in higher magnification on the right. Scale bar, 100 μm.
Figure 3
Figure 3
Double deletions result in precocious differentiation of cardiac progenitor cells from SHF (A and B) UMAP visualization of all single cells from published data (GSE108963) colored by cell types in (A) and embryonic stages in (B). CP, cardiac progenitor cells; EC, endothelial cells; CM, cardiomyocytes. (C) Shown were the expression patterns of representative genes highly enriched in each cell type. (D and E) 3-Dimensional PCA showing single cells from SHF in (D) and HT in (E) of WT and DKO projected onto reference lineages in (A). (F) Heatmaps showing differentially expressed genes in single cells from SHF between WT and DKO (left) and top enriched GO terms in each group (right). See also Figure S2.
Figure 4
Figure 4
Differential enhancer dynamics between FHF and SHF of E8.25 DKO and WT hearts (A) Track view showing H3K27ac signals in FHF and SHF of E8.25 WT/DKO hearts around Nkx2-5 locus. U1 and U2 enhancers were highlighted by green and blue shading, respectively. (B) Track view showing the H3K27ac in situ ChIP-seq signals in FHF and SHF of E8.25 WT/DKO hearts around the Tbx20 locus. Stronger H3K27ac signals around the Tbx20 enhancer in SHF of DKO hearts were highlighted by gray shading. (C) Heatmaps showing H3K27ac signals at 60,836 peaks in E8.25 FHF of WT and DKO hearts. Groups consist of K-means clusters: cluster I (increased; n = 1,357), cluster II (unchanged; n = 58,413), and cluster III (decreased; n = 1,066). The heatmaps and aggregate plots were both generated with DeepTools. (D) Aggregate plots of H3K27ac signals at ± 2 kb of peak centers of cluster I and cluster III in (C). (E) Top 6 enriched GO terms of genes nearby upregulated and downregulated peaks in (C). p-value was calculated by Binomial test. (F) Heatmaps showing H3K27ac signals at 44,375 peaks in E8.25 SHF of WT and DKO hearts. Groups consist of K-means clusters: cluster I (increased; n = 1,038), cluster II (unchanged; n = 42,694), and cluster III (decreased; n = 643). Heatmaps and aggregate plots were generated with DeepTools. (G) Aggregate plots of H3K27ac signals at ± 2 kb of peak centers of cluster I and cluster III in (F). (H) Top 6 enriched GO terms of genes nearby upregulated and downregulated peaks in (F). p-value was calculated by Binomial test. See also Figure S3.
Figure 5
Figure 5
Genome-wide decommissioning of heart enhancers is associated with perturbation of NKX2-5 binding in DKO mice (A) Venn diagram showing overlapping of H3K27ac peaks between WT and DKO. (B) Track view showing H3K27ac in situ ChIP signals in DKO and WT hearts around Nkx2-5 locus. U1 and U2 enhancers were highlighted by light gray, and the highlighted green shading represented increased enhancer signals after U1 and U2 double knockout. (C) Dot plots showing de novo motifs in downregulated DBPs discovered using Homer. Besides were matched known TFs. p-value was calculated by the Binomial test. (D) Non-promoter H3K27ac signals around 52,251 non-promoter H3K27ac peaks in E9.5 WT and DKO hearts. Groups consisted of K-means clusters: cluster I (increased; n = 2,046) and cluster II (reduced; n = 50,205). The heatmaps and aggregate plots were both generated with DeepTools. (E) Aggregate plots of H3K27ac ChIP-seq signals at ± 2 kb of peak centers in (D). (F) Top 10 GO terms enriched in genes nearby increased and reduced peaks in (D). p-value was calculated by Binomial test. (G) Heatmap showing NKX2-5 ChIP-seq signals around downregulated H3K27ac peaks in DKO hearts (n = 21,688 for downregulated NKX2-5 peaks and n = 28,517 for stable NKX2-5 peaks). (H) Aggregation plot of NKX2-5 ChIP-seq signals at ± 1 kb of H3K27ac peak centers in (G). (I) Track view showing decreased NKX2-5 binding signals at distal enhancers of Hand2 in DKO hearts. (J) Heatmap displaying the strengths of most interactions between downregulated H3K27ac peaks in E9.5 DKO, and the promoters of heart developmental gene were weakened in DKO. ANOVA was performed for identifying significantly variable interactions. (K) Violin plot showing the significantly decreased NKX2-5 binding signals on disrupted interactions between enhancers and promoters in (J). (L) Visualization of chromatin interactions, H3K27ac, and NKX2-5 binding signals around Nkx2-5, Tbx5, and Hand1 loci. The highlighted red and green shading represented increased and decreeased interactions in DKO, respectively. See also Figure S4.
Figure 6
Figure 6
Characterization of U2-KO heart malformation and chromatin states (A) Schematic of the strategy for the U2-knockout (U2-KO) mice generation. (B) Survival analysis of U2-KO strains determined by heterozygote intercrosses at three indicated developmental stages. p-value was calculated by chi-squared test. (C) Gross heart morphology and H&E staining of sections of E16.5 U2-KO and WT hearts. Arrows indicate ventricular septal defect (VSD) and thinner ventricle wall. Scale bar, 500 μm. (D) Quantification analysis of the right ventricle thickness in (C). Data were mean ± s.e.m. p-value was calculated by Student’s t-test. (E) RT-qPCR of Nkx2-5 in WT and U2-KO embryonic hearts at E8.5, E9.5, E12.5, and E16.5. Data were mean ± s.e.m. p-value was calculated by Student’s t-test. (F) Track view showing ATAC-seq and H3K27ac ChIP-seq signals at Nkx2-5 or Myh7 locus in E16.5 heart apex. (G) Heatmaps showing ATAC-seq signals at non-duplicated 36,282 peaks from all replicates. Each column was plotted at the 10 kb regions of the peak centers, and rows were sorted by log2 (WT+1)/log2(U2-KO+1) ATAC-seq signals. (H) Heatmaps showing H3K27ac ChIP-seq signals at non-duplicated peaks from all replicates. Each column was plotted at the 10 kb regions of the peak centers, and rows were sorted by log2 (WT+1)/log2(U2 -KO+1) signals. log2 (ChIP signals) were shown in 15,501 peaks with WT/U2-KO > 1 and 5,095 peaks with WT/U2-KO ≤ 1. (I) Bar plot showing top 15 GO terms enriched in genes nearby 5,709 significantly (FDR ≤ 0.05) downregulated H3K27ac peaks in U2-KO hearts. p-value was calculated by the Binomial test. (J) H3K27ac ChIP-seq signals at TF regions whose motifs were enriched in down/upregulated H3K27ac peaks in E16.5 U2-KO hearts. TF motif p-value was calculated by Binomial test, and the H3K27ac signals were scaled by row Z score. Several cardiac feature genes were highlighted by blue, and the hematopoietic feature genes were highlighted by red. (K) A working model showing the regulatory mechanisms of U1 and U2 regulating Nkx2-5 transcription during heart development. As early as E7.5, U1 and U2 work additively to sustain Nkx2-5 transcription, both of which could compensate for the loss of each other. From E12.5 and onward, U1 becomes insufficient to support Nkx2-5 expression. See also Figures S6 and S7.

References

    1. Ong C.T., Corces V.G. Enhancer function: new insights into the regulation of tissue-specific gene expression. Nat. Rev. Genet. 2011;12:283–293. doi: 10.1038/nrg2957. - DOI - PMC - PubMed
    1. Levine M. Transcriptional enhancers in animal development and evolution. Curr. Biol. 2010;20:R754–R763. doi: 10.1016/j.cub.2010.06.070. - DOI - PMC - PubMed
    1. Schoenfelder S., Fraser P. Long-range enhancer-promoter contacts in gene expression control. Nat. Rev. Genet. 2019;20:437–455. doi: 10.1038/s41576-019-0128-0. - DOI - PubMed
    1. Cashman T.J., Trivedi C.M. Super enhancers: enhancing human cardiogenesis. Circ. Res. 2020;127:1156–1158. doi: 10.1161/CIRCRESAHA.120.318000. - DOI - PMC - PubMed
    1. Wamstad J.A., Wang X., Demuren O.O., Boyer L.A. Distal enhancers: new insights into heart development and disease. Trends Cell Biol. 2014;24:294–302. doi: 10.1016/j.tcb.2013.10.008. - DOI - PubMed

LinkOut - more resources