. 2023 Jun 27;14(3):e0005223.
doi: 10.1128/mbio.00052-23. Epub 2023 Apr 27.

Aging-Associated Augmentation of Gut Microbiome Virulence Capability Drives Sepsis Severity

Affiliations

Aging-Associated Augmentation of Gut Microbiome Virulence Capability Drives Sepsis Severity

James F Colbert et al. mBio. .

Abstract

Prior research has focused on host factors as mediators of exaggerated sepsis-associated morbidity and mortality in older adults. This focus on the host, however, has failed to identify therapies that improve sepsis outcomes in the elderly. We hypothesized that the increased susceptibility of the aging population to sepsis is not only a function of the host but also reflects longevity-associated changes in the virulence of gut pathobionts. We utilized two complementary models of gut microbiota-induced experimental sepsis to establish the aged gut microbiome as a key pathophysiologic driver of heightened disease severity. Further murine and human investigations into these polymicrobial bacterial communities demonstrated that age was associated with only subtle shifts in ecological composition but also an overabundance of genomic virulence factors that have functional consequence on host immune evasion. IMPORTANCE Older adults suffer more frequent and worse outcomes from sepsis, a critical illness secondary to infection. The reasons underlying this unique susceptibility are incompletely understood. Prior work in this area has focused on how the immune response changes with age. The current study, however, focuses instead on alterations in the community of bacteria that humans live with within their gut (i.e., the gut microbiome). The central concept of this paper is that the bacteria in our gut evolve along with the host and "age," making them more efficient at causing sepsis.

Keywords: aging; host-pathogen interaction; metagenomics; microbiome; sepsis.


Conflict of interest statement

The authors declare no conflict of interest.

Figures
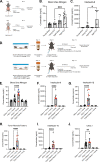
FIG 1
FIG 1
Age of the animal from which infectious insult is derived determines sepsis outcomes. (A to C) Experimental design and measurements of sepsis severity via blood urea nitrogen (B) and circulating interleukin-6 (C) after cecal ligation and puncture compared between young and aged mice and with contemporaneous sham surgery control. n = 7 to 12 animals per group. Experimental dropout (i.e., mortality) 0% in all groups besides aged CLP with 17% (2/12 animals) 24-h mortality. (D) The complementary fecal slurry experimental sepsis model was utilized to assess the relative contribution of the aged gut microbiota to sepsis severity phenotype in young mice. Sepsis severity markers include acute kidney injury (E), circulating plasma cytokines (F to I), and chemokines (J) 24 h after intraperitoneal fecal slurry injection. Intraperitoneal injection of saline and filtered slurry (0.22-μm filter) served as control conditions. n = 10 to 25 animals per group. Experimental dropout was 0% in all groups besides aged slurry [FS(A)] injection into young mice (32% mortality [8/25 animals]). Sex and origin of donor animals for FS(A) are noted as follows: black dots, aged male from the National Institute on Aging; blue dots, aged male from Denver, Colorado; and red dots, aged female from the National Institute on Aging. Pairwise statistical testing presented for experimental sepsis groups of interest only (young CLP group versus aged CLP group in panels B and C. FS(Y) injection into young mice versus FS(A) injection into young mice in panels E-J). *, P < 0.05; **, P < 0.01; ***, P < 0.001; ****, P < 0.0001. Schematics (panels A and D) created with BioRender.com.
FIG 2
FIG 2
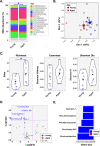
Longevity is not associated with an overabundance of known pathogenic taxa. Fecal slurry utilized for in vivo experiments subsequently underwent 16S rRNA gene sequencing and analysis for description of bacterial communities. n = 10 contemporaneous pairs of FS(Y) and FS(A), which are created from cages containing 5 animals per cage. (A) Relative abundance chart summarizing microbiota distributions between age groups. *, P < 0.05 measured by a permutational ANOVA (PERMANOVA) test with the Morisita-Horn dissimilarity index. PERMANOVA P values were inferred through 106 label permutations. (B) Principal-coordinate analysis (PCoA) plot generated using the Morisita-Horn dissimilarity index. Individual slurry samples are shown as small symbols (circles, squares), while group mean PC1 and PC2 scores are indicated by larger symbols (circles, squares) with 95% confidence intervals. (C) Alpha diversity indices represented by violin plots indicating mean values (closed circles), individual data points (open circles), and overall distribution of values. *, P < 0.05 as measured by ANOVA. (D) Volcano plot demonstrating differentially abundant taxa in young (blue) and aged (red) mice, as determined by ANOVA-like differential expression (ALDEx2) analysis with cutoffs of P value of <0.05 and log fold change of >2.0. (E) Effect sizes for individual significant taxa generated through ALDEx2 analysis.
FIG 3
FIG 3
Aging is associated with an overabundance of virulence factors in the gut murine microbiome. The same fecal slurry samples with high-quality bacterial DNA [FS(Y), n = 8, and FS(A), n = 6] from in vivo experiments and 16S rRNA analysis underwent whole-genome shotgun sequencing and targeted metagenomic analysis focused on virulence factor abundance utilizing the Virulence Factor Database (VFDB) (25). (A) Volcano plot showing VFDB hits overabundant in FS(A) (red circles) versus FS(Y) (blue circles). Cutoff values of P of <0.05 and log-fold change >2. (B) Heatmap with all statistically significant (P < 0.05) individual virulence factor genes and relative fold change coded by color.
FIG 4
FIG 4
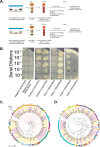
Aging selects for blood-resistant pathogens in the murine gut microbiome. (A) Study design demonstrating screening process for whole-blood killing resistance in fecal slurry. Biological replicates were performed using young mouse blood, and aged mouse blood (see Fig. S2 in the supplemental material). Control conditions included Trypticase soy broth (negative control), whole blood (negative control), and FS(Y) and FS(A) without coincubation with blood (positive control). After 1 h of coincubation in blood, samples were allowed to grow overnight followed by serial dilution and quantification of colonies. (B) Representative image showing all control conditions and two experimental replicates of FS(Y) plus whole blood and FS(A) plus whole blood. Blood-resistant colonies were identified by MALDI-TOF. (C, D) Red-circled colony, E. coli (JC001); blue-circled colony, E. faecalis (JC002), followed by whole-genome sequencing of isolates. Core genome phylogeny of E. coli and E. faecalis isolates from human blood and urine. Maximum-likelihood trees of publicly available E. coli (n = 59) and E. faecalis (n = 58) isolates as determined by Roary and RAxML along with JC001 and JC002 isolated in this study. Isolates are colored as per their source of origin indicated in the key (red, blood; yellow, urine). The phylogenetic tree was visualized and annotated using iTOL. ST denotes sequence type. An asterisk denotes that the ST was inconclusive, and the depicted ST is the nearest ST determined. E. coli clade B2 is indicated by red dotted lines. Schematic (panel A) created with BioRender.com.
FIG 5
FIG 5
The aging human gut microbiome demonstrates an analogous overabundance of genomic virulence factors. Data from a previously published metagenomic data set (29) underwent the same analysis strategy as our murine data (Fig. 3). n = 62 total patients, n = 38 in the “aged human” group. (A) Volcano plot showing VFDB (25) hits overabundant in aged human gut microbiota (red circles) versus young human gut microbiota (blue circles). Cutoff values of P value of <0.05 and log fold change of >2. (B) Heatmap with all statistically significant (P < 0.05) individual virulence factor genes and relative fold change coded by color.
FIG 6
FIG 6
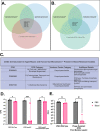
Identified exopolysaccharide virulence genes promote blood survival. (A) Venn diagram demonstrating Cluster of Orthologous Gene (COG) overlap between the aged murine gut microbiota, aged human gut microbiota, and isolated (blood-resistant) E. coli. (B) Analogous Venn diagram with isolated, blood-resistant E. faecalis. (C) Table highlighting in detail the three COGs overabundant in both murine and human gut microbiota, as well as both blood-resistant isolates. (D, E) Blood-killing assay of various strains of E. faecalis with genetic manipulation of the enterococcal polysaccharide antigen (epaAC) gene (COG0451). Data presented as percentage of PBS control (no blood killing). (D) Comparison of wild-type (V583 isolate) E. faecalis blood survival versus an engineered epaAC knockout and epaAC knockout plus plasmid complementation. (E) Comparison of V583 versus a phage-resistant strain (4RSR) with a missense point mutation in epaAC rendering the product nonfunctional. n = 9 per group (3 biological replicates and 3 technical replicates per group). Paired t tests with correction for multiple comparisons were applied to biological replicates (technical replicates were combined into one biological data point) with *, P < 0.05; **, P < 0.01; and ***, P < 0.001.

Update of

References

    1. Angus DC, Linde-Zwirble WT, Lidicker J, Clermont G, Carcillo J, Pinsky MR. 2001. Epidemiology of severe sepsis in the United States: analysis of incidence, outcome, and associated costs of care. Crit Care Med 29:1303–1310. doi:10.1097/00003246-200107000-00002. - DOI - PubMed
    1. Martin GS, Mannino DM, Eaton S, Moss M. 2003. The epidemiology of sepsis in the United States from 1979 through 2000. N Engl J Med 348:1546–1554. doi:10.1056/NEJMoa022139. - DOI - PubMed
    1. Martin GS, Mannino DM, Moss M. 2006. The effect of age on the development and outcome of adult sepsis. Crit Care Med 34:15–21. doi:10.1097/01.ccm.0000194535.82812.ba. - DOI - PubMed
    1. Quintano Neira RA, Hamacher S, Japiassú AM. 2018. Epidemiology of sepsis in Brazil: incidence, lethality, costs, and other indicators for Brazilian Unified Health System hospitalizations from 2006 to 2015. PLoS One 13:e0195873. doi:10.1371/journal.pone.0195873. - DOI - PMC - PubMed
    1. Juthani-Mehta M. 2007. Asymptomatic bacteriuria and urinary tract infection in older adults. Clin Geriatr Med 23:585–594. doi:10.1016/j.cger.2007.03.001. - DOI - PubMed

Publication types