. 2023 Jun 15;133(12):e170682.
doi: 10.1172/JCI170682.

Machine learning links unresolving secondary pneumonia to mortality in patients with severe pneumonia, including COVID-19

Affiliations

Machine learning links unresolving secondary pneumonia to mortality in patients with severe pneumonia, including COVID-19

Catherine A Gao et al. J Clin Invest. .

Abstract

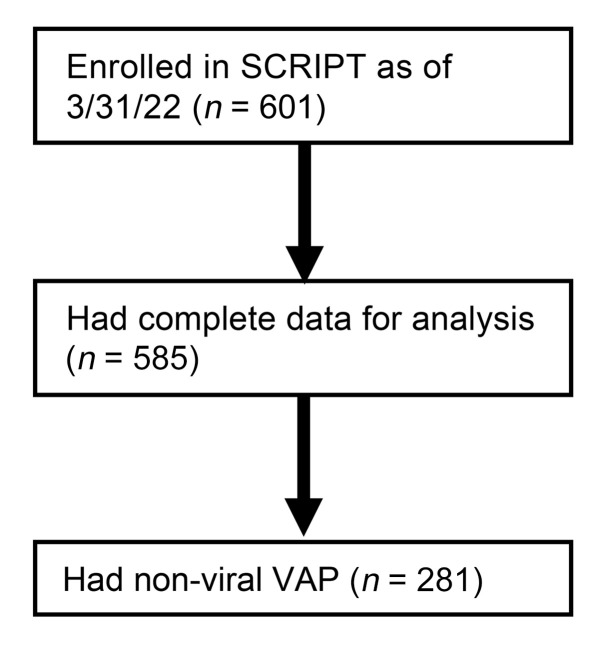
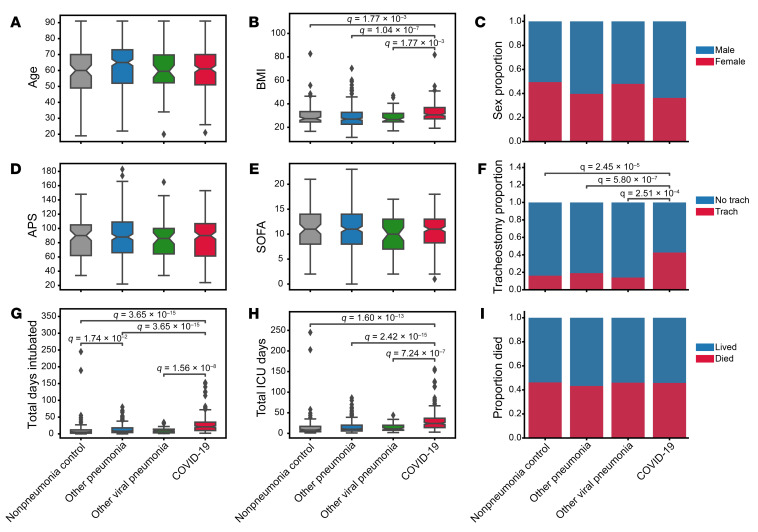
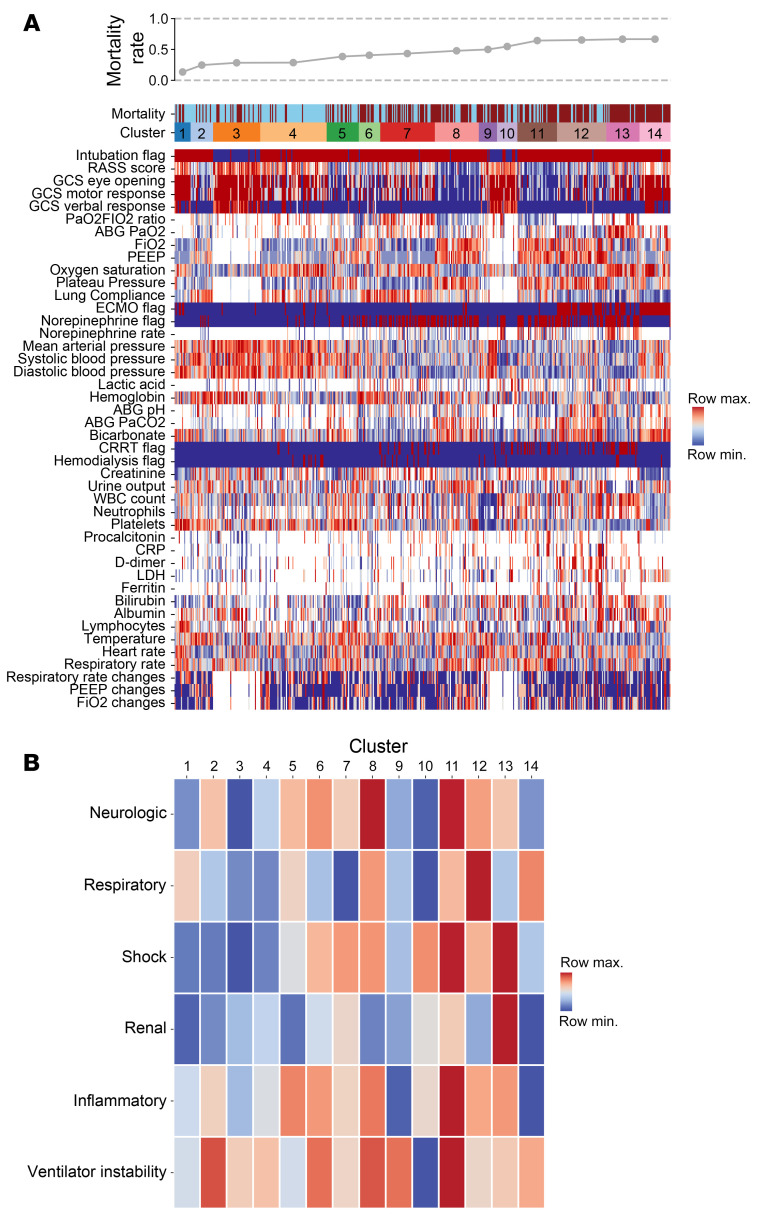
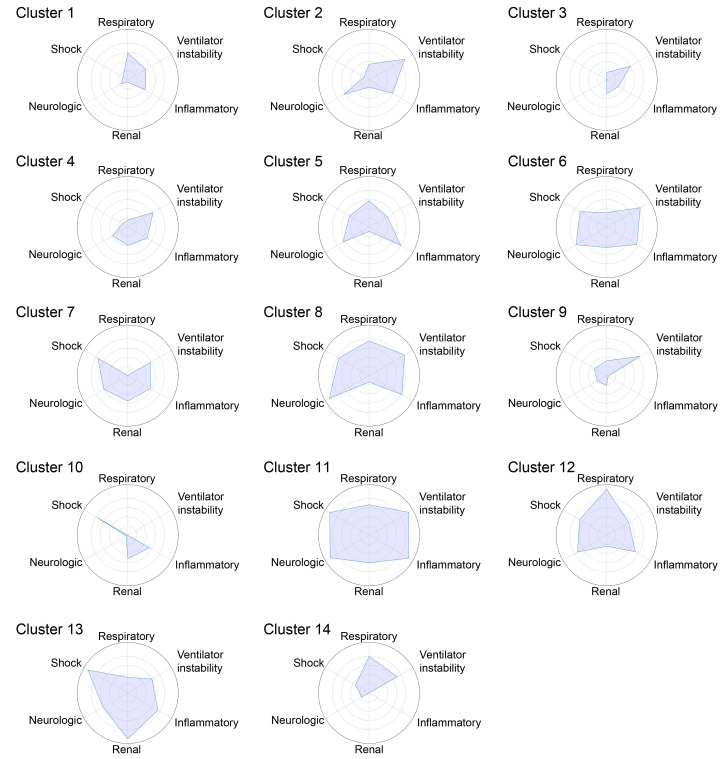
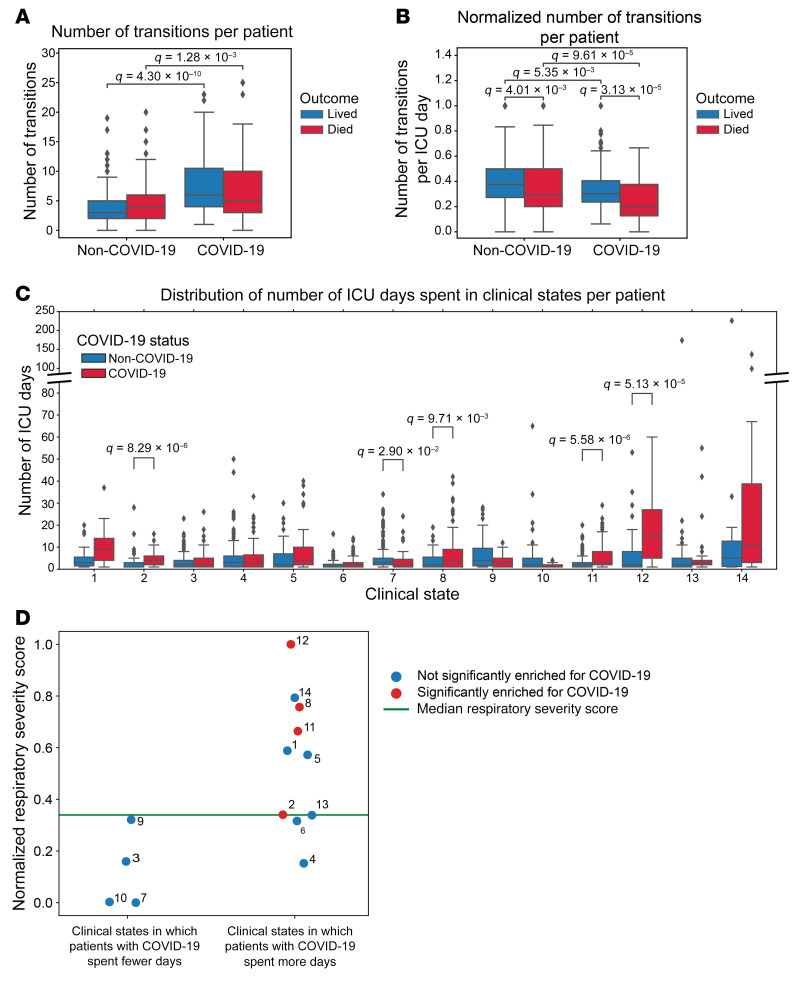
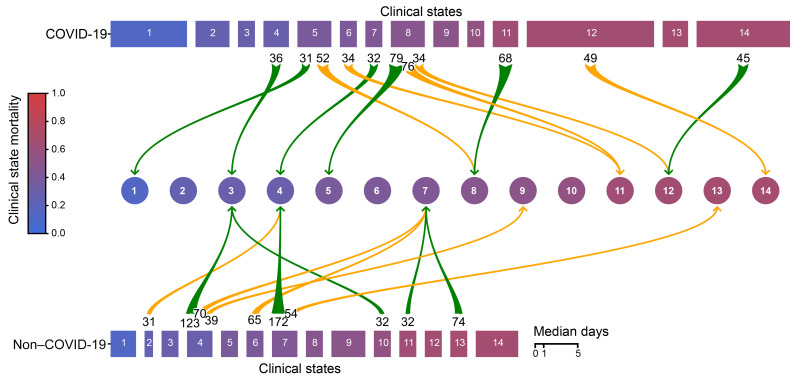
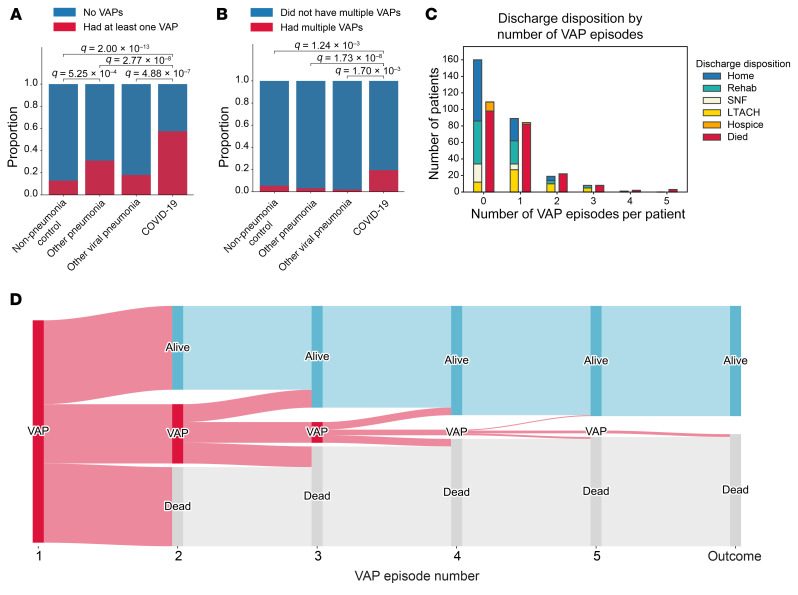
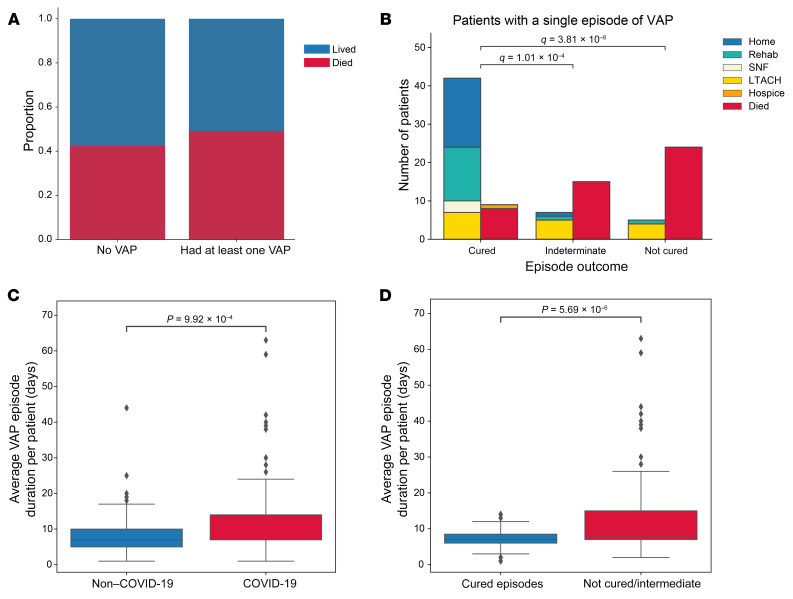
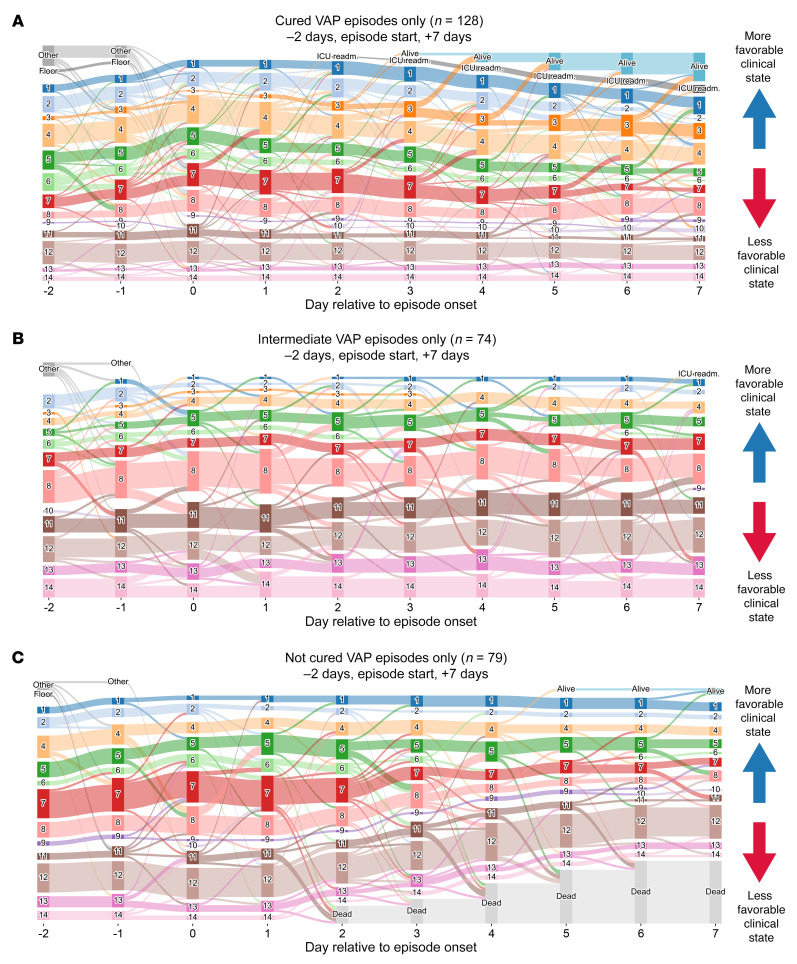
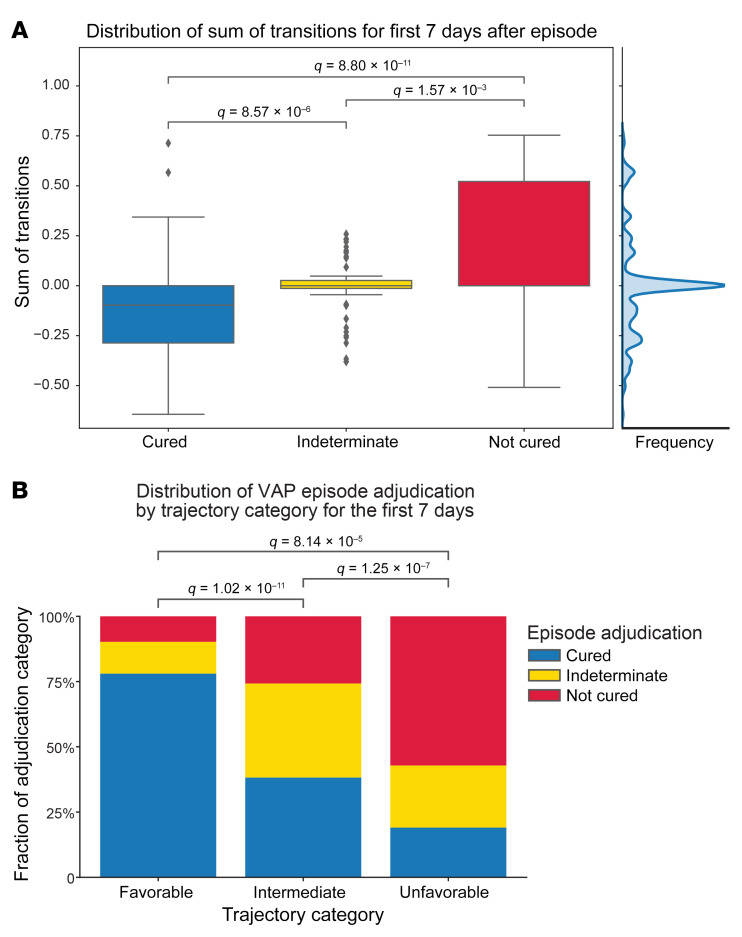
BACKGROUNDDespite guidelines promoting the prevention and aggressive treatment of ventilator-associated pneumonia (VAP), the importance of VAP as a driver of outcomes in mechanically ventilated patients, including patients with severe COVID-19, remains unclear. We aimed to determine the contribution of unsuccessful treatment of VAP to mortality for patients with severe pneumonia.METHODSWe performed a single-center, prospective cohort study of 585 mechanically ventilated patients with severe pneumonia and respiratory failure, 190 of whom had COVID-19, who underwent at least 1 bronchoalveolar lavage. A panel of intensive care unit (ICU) physicians adjudicated the pneumonia episodes and endpoints on the basis of clinical and microbiological data. Given the relatively long ICU length of stay (LOS) among patients with COVID-19, we developed a machine-learning approach called CarpeDiem, which grouped similar ICU patient-days into clinical states based on electronic health record data.RESULTSCarpeDiem revealed that the long ICU LOS among patients with COVID-19 was attributable to long stays in clinical states characterized primarily by respiratory failure. While VAP was not associated with mortality overall, the mortality rate was higher for patients with 1 episode of unsuccessfully treated VAP compared with those with successfully treated VAP (76.4% versus 17.6%, P < 0.001). For all patients, including those with COVID-19, CarpeDiem demonstrated that unresolving VAP was associated with a transitions to clinical states associated with higher mortality.CONCLUSIONSUnsuccessful treatment of VAP is associated with higher mortality. The relatively long LOS for patients with COVID-19 was primarily due to prolonged respiratory failure, placing them at higher risk of VAP.FUNDINGNational Institute of Allergy and Infectious Diseases (NIAID), NIH grant U19AI135964; National Heart, Lung, and Blood Institute (NHLBI), NIH grants R01HL147575, R01HL149883, R01HL153122, R01HL153312, R01HL154686, R01HL158139, P01HL071643, and P01HL154998; National Heart, Lung, and Blood Institute (NHLBI), NIH training grants T32HL076139 and F32HL162377; National Institute on Aging (NIA), NIH grants K99AG068544, R21AG075423, and P01AG049665; National Library of Medicine (NLM), NIH grant R01LM013337; National Center for Advancing Translational Sciences (NCATS), NIH grant U01TR003528; Veterans Affairs grant I01CX001777; Chicago Biomedical Consortium grant; Northwestern University Dixon Translational Science Award; Simpson Querrey Lung Institute for Translational Science (SQLIFTS); Canning Thoracic Institute of Northwestern Medicine.

Keywords: Bacterial infections; Bioinformatics; Infectious disease; Pulmonology.


Figures

Figure 1
Figure 1. CONSORT diagram of the SCRIPT study participants and analysis.
Figure 2
Figure 2. Demographics and outcomes of the cohort grouped by pneumonia category.
Distribution of (A) patient age in years, (B) BMI in kg/m2 (1 patient did not have BMI data available), (C) sex, (D) APS, (E) SOFA score, (F) tracheostomy placement, (G) duration of intubation, (H) length of ICU stay, and (I) hospital mortality. Total days intubated (G) and total ICU days (H) include only days at our hospital and do not capture intubation duration or ICU LOS at a transferring hospital. Data on patients who lived include dispositions of discharge to home, acute inpatient rehabilitation, and admission to a long-term acute care hospital (LTACH) or skilled nursing facility (SNF) (see Supplemental Table 1). Data on patients who died include patients who died in the hospital, patients who underwent lung transplantation for refractory respiratory failure, and patients who were transferred to home or inpatient hospice. The APS score from APACHE IV was calculated from the worst value within the first 2 ICU days, and SOFA score was calculated from the worst value within the first 2 ICU days. In the box-and-whisker plots, the box shows quartiles and the median, and the whiskers show the minimum and maximum values except for outliers, which are shown as individual data points. Notches are bootstrapped 95% CI of the median. Numerical values were compared with the Mann-Whitney U test with FDR correction using the Benjamini-Hochberg procedure. Categorical values were compared using Fisher’s exact tests with FDR correction using the Benjamini-Hochberg procedure. A q value of less than 0.05 was the threshold for statistical significance. Numerical values and additional details are available in Supplemental Tables 1 and 2.
Figure 3
Figure 3. CarpeDiem groups patient-days into clusters representing clinical states associated with differential hospital mortality.
(A) Heatmap of 44 clinical parameters with columns (representing 12,495 ICU patient-days for 585 patients) grouped into CarpeDiem-generated clusters (clinical states) ordered from the lowest to highest mortality rates. Rows are sorted into physiologically related groups. The top row signifies the hospital mortality outcome of the patient shown in the column (blue = lived, red = died). The hospital mortality rate associated with each cluster is shown above the heatmap. (B) Heatmap of the composite signal from each cluster and physiological group with ordering the same as in A.
Figure 4
Figure 4. CarpeDiem clinical states have different patterns of organ dysfunction.
Spider plots of minimum–maximum normalized composite features from Figure 3B for each clinical state. Circles indicate values of 0.2 (innermost), 0.4, 0.6, 0.8, and 1 (outermost).
Figure 5
Figure 5. The long LOS among patients with COVID-19 is driven by a lower frequency of transitions, resulting in longer durations of time spent in certain clinical states.
(A) Distribution of transitions per patient. (B) Distribution of transitions normalized by ICU LOS. (C) Distribution of ICU days spent in each clinical state per patient. The y-axis is discontinuous to accommodate all data points. (D) Respiratory severity score per clinical state, which is numbered next to each point, split by whether that cluster was enriched in patient-days for patients with COVID-19. Green line indicates the median respiratory severity score for the cohort. For the box-and-whisker plots, the box shows quartiles and the median, and whiskers show the minimum and maximum values except for outliers, which are shown as individual data points. Numerical values were compared using Mann-Whitney U tests with FDR correction using the Benjamini-Hochberg procedure. A q value of less than 0.05 was our threshold for statistical significance.
Figure 6
Figure 6. Patients with SARS-CoV-2 pneumonia have a longer LOS and fewer transitions between clinical states per day compared with patients with non–COVID-19–related respiratory failure.
Clinical states are ordered and numbered 1–14 according to their associated mortality (blue to red). Rectangle width reflects the median number of days spent in each clinical state. Green arrows indicate transitions to a more favorable (lower mortality) clinical state; yellow arrows mark transitions to a less favorable (higher mortality) clinical state. Numbers at the arrow bases represent the number of transitions between the 2 clinical states connected by the arrow. Only transitions that occurred more than 30 times are shown.
Figure 7
Figure 7. Patients with COVID-19 experience more VAP episodes than do patients without COVID-19.
(A) Proportion of patients with at least 1 VAP. (B) Proportion of patients with more than 1 VAP. (C) Outcomes for patients experiencing different numbers of VAP episodes. Outcomes are displayed in 2 columns: the first column aggregates favorable discharge dispositions (home, rehabilitation, SNF, LTACH); the second column aggregates unfavorable discharge dispositions (hospice, died). (D) Sankey diagram of VAP episodes and outcomes for each VAP episode. Categorical values were compared using Fisher’s exact test with FDR correction using the Benjamini-Hochberg procedure. A q value of less than 0.05 was the threshold for statistical significance.
Figure 8
Figure 8. Unresolving VAP is associated with worse outcomes.
(A) Mortality associated with at least 1 episode of VAP. (B) Outcomes for patients who experienced 1 episode of VAP that was cured, of indeterminate cure status, or that was not cured by day 14 following diagnosis. Outcomes are displayed in 2 columns: the first column aggregates favorable discharge dispositions (home, rehabilitation, SNF, LTACH); the second column aggregates unfavorable discharge dispositions (hospice, died). (C) VAP episode duration for patients with COVID-19 compared with patients without COVID-19. (D) VAP episode duration for patients who were cured or not cured or of indeterminate cure status. For the box-and-whisker plots, the box shows quartiles and the median, and whiskers show minimum and maximum values except for outliers, which are shown as individual data points. Numerical values were compared using the Mann-Whitney U test with FDR correction using the Benjamini-Hochberg procedure. Categorical values were compared using Fisher’s exact test with FDR correction using the Benjamini-Hochberg procedure. A q value of less than 0.05 was the threshold for statistical significance.
Figure 9
Figure 9. Trajectory analysis reveals that unresolving VAP is associated with transitions to progressively unfavorable clinical states.
On these Sankey diagrams, day 0 represents the day that a BAL procedure was performed to evaluate VAP adjudicated as (A) cured, (B) indeterminate, or (C) not cured. More favorable (lower mortality) clinical states are at the top of the graphs, with leaving the ICU alive being the highest, and less favorable (higher mortality) clinical states are at the bottom, with death being the lowest. Graphs start at 2 days prior to the onset of the episode; patients who were not in our ICU are labeled as “Other” (patients who were received in external transfer or chronically ventilated patients) or “Floor” (within 48 hours of extubation or chronically ventilated patients). readm., readmission.
Figure 10
Figure 10. Unresolving VAP episodes are associated with unfavorable clinical states.
(A) Distribution of the sum of transitions for the 7 days following VAP diagnosis by episode outcome, identifying a breakpoint of 0.1 in the middle of the distribution (shown by the cumulative data histogram along the right axis). Higher sums of transitions reflect transitions to unfavorable (higher mortality) clusters. (B) Proportion of VAP episode outcomes in each trajectory category. Trajectories were grouped into favorable (sum of transitions < –0.1), indeterminate (–0.1–0.1), and unfavorable (>0.1) categories. For box-and-whisker plots, the box shows quartiles and the median, and whiskers show minimum and maximum values except for outliers, which are shown as individual data points. Numerical values were compared using the Mann-Whitney U test with FDR correction using the Benjamini-Hochberg procedure. Categorical values were compared using χ2 tests with FDR correction with the Benjamini-Hochberg procedure. A q value of less than 0.05 was the threshold for statistical significance.

Comment in

References

    1. RECOVERY Collaborative Group. et al. Dexamethasone in hospitalized patients with COVID-19 — preliminary report. N Engl J Med. 2020;384(8):693–704. - PMC - PubMed
    1. Ferrando C, et al. Clinical features, ventilatory management, and outcome of ARDS caused by COVID-19 are similar to other causes of ARDS. Intensive Care Med. 2020;46(12):2200–2211. doi: 10.1007/s00134-020-06192-2. - DOI - PMC - PubMed
    1. Gamberini L, et al. Factors influencing liberation from mechanical ventilation in coronavirus disease 2019: multicenter observational study in fifteen Italian ICUs. J Intensive Care Med. 2020;8(1):80. doi: 10.1186/s40560-020-00499-4. - DOI - PMC - PubMed
    1. Roedl K, et al. Mechanical ventilation and mortality among 223 critically ill patients with coronavirus disease 2019: a multicentric study in Germany. Aust Crit Care. 2020;34(2):167–175. - PMC - PubMed
    1. Guan WJ, et al. Clinical characteristics of coronavirus disease 2019 in China. N Engl J Med. 2020;382(18):1708–1720. doi: 10.1056/NEJMoa2002032. - DOI - PMC - PubMed

Publication types

MeSH terms