. 2023 May 22;8(10):e168470.
doi: 10.1172/jci.insight.168470.

Heterologous versus homologous boosting elicits qualitatively distinct, BA.5-cross-reactive T cells in transplant recipients

Affiliations

Heterologous versus homologous boosting elicits qualitatively distinct, BA.5-cross-reactive T cells in transplant recipients

Elizabeth A Thompson et al. JCI Insight. .

Abstract

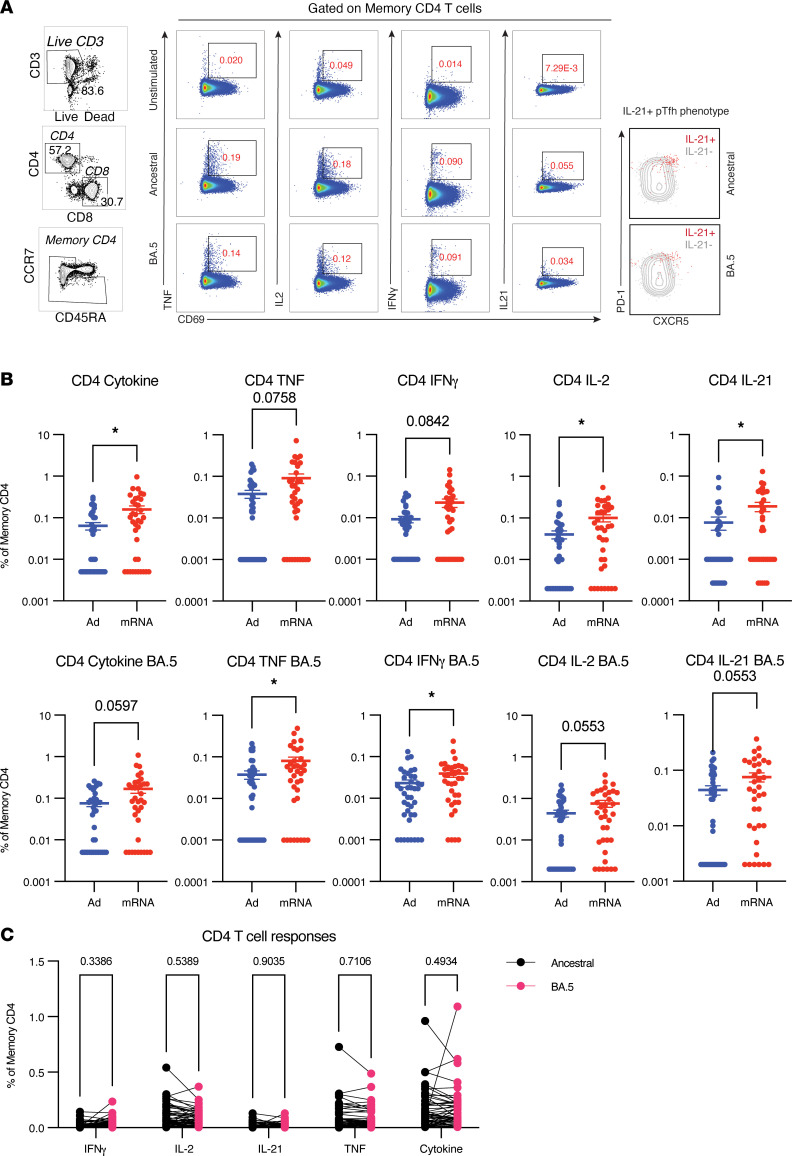
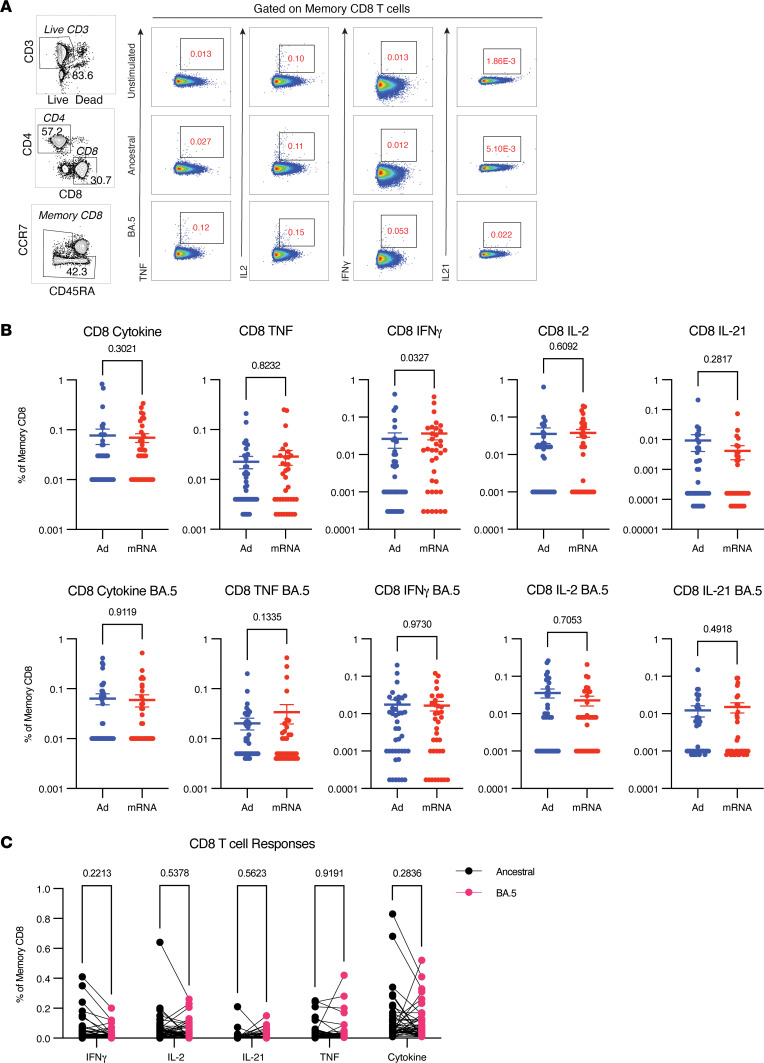
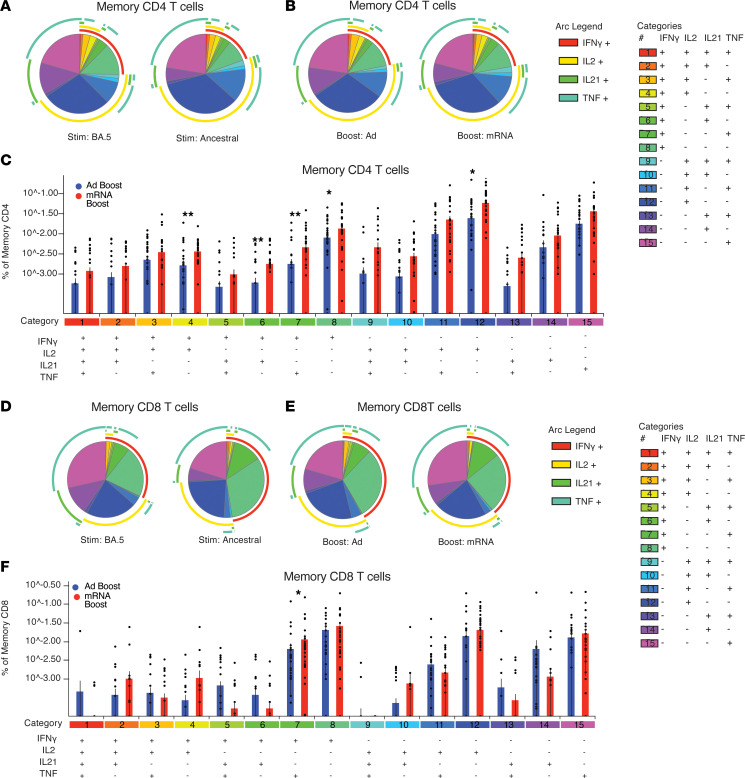
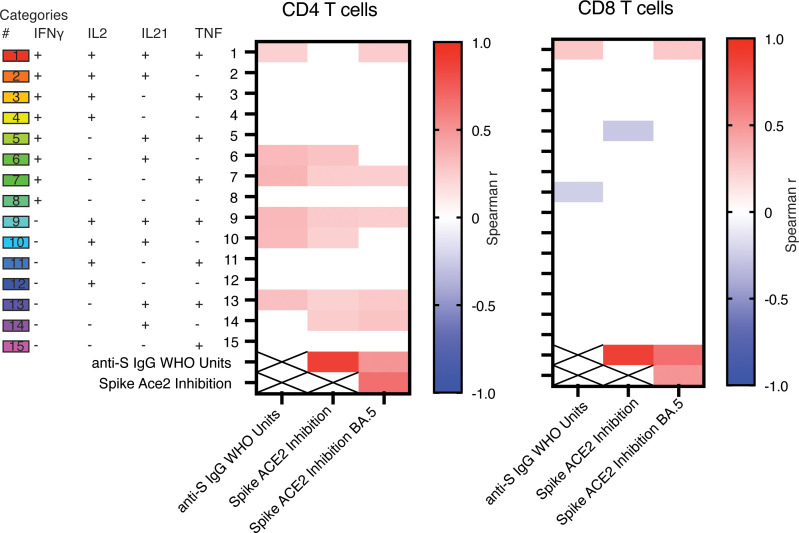
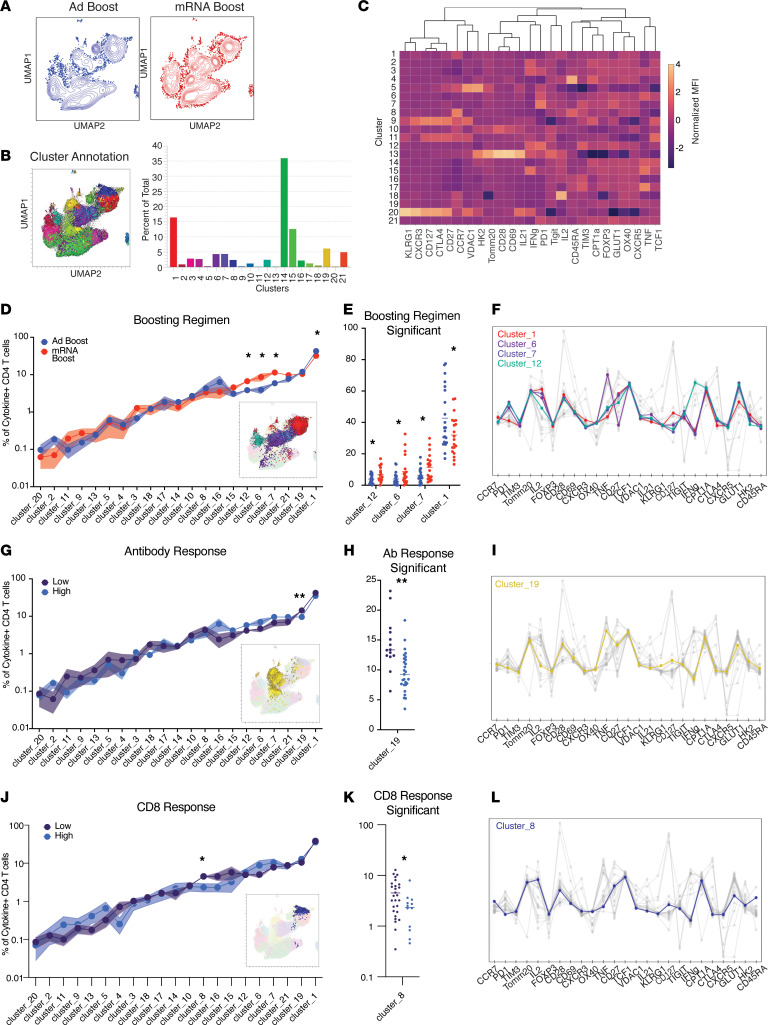
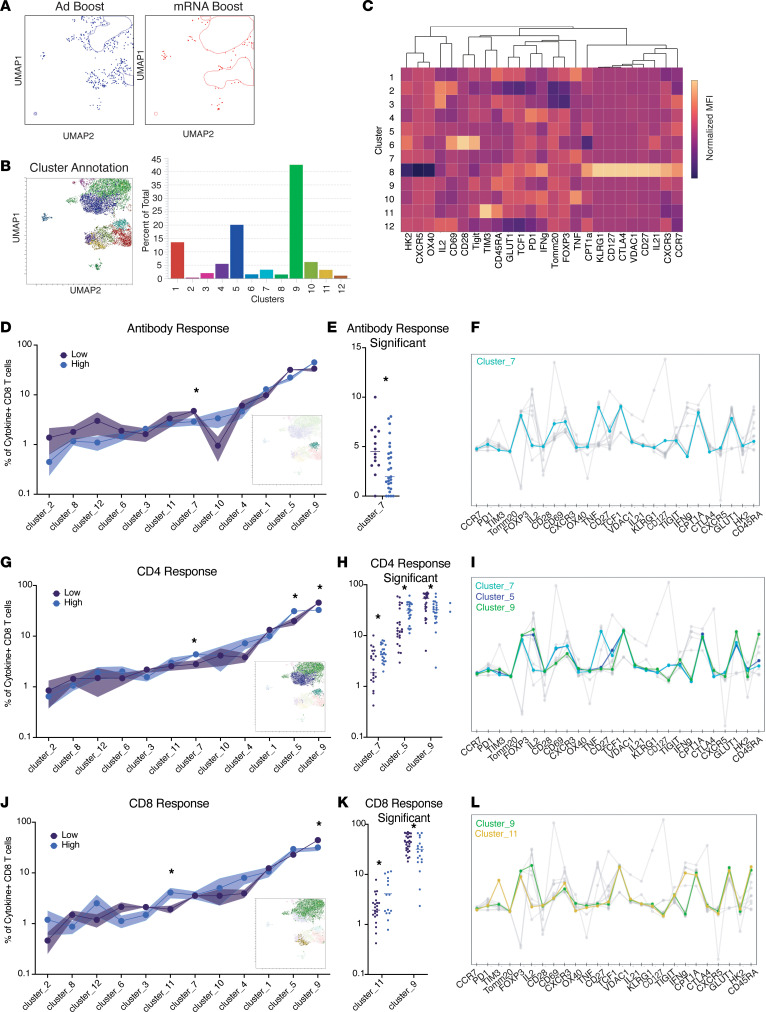
BackgroundThe SARS-CoV-2 Omicron BA.5 subvariant escapes vaccination-induced neutralizing antibodies because of mutations in the spike (S) protein. Solid organ transplant recipients (SOTRs) develop high COVID-19 morbidity and poor Omicron variant recognition after COVID-19 vaccination. T cell responses may provide a second line of defense. Therefore, understanding which vaccine regimens induce robust, conserved T cell responses is critical.MethodsWe evaluated anti-S IgG titers, subvariant pseudo-neutralization, and S-specific CD4+ and CD8+ T cell responses from SOTRs in a national, prospective, observational trial (n = 75). Participants were selected if they received 3 doses of mRNA (homologous boosting) or 2 doses of mRNA followed by Ad26.COV2.S (heterologous boosting).ResultsHomologous boosting with 3 mRNA doses induced the highest anti-S IgG titers. However, antibodies induced by both vaccine regimens demonstrated lower pseudo-neutralization against BA.5 compared with the ancestral strain. In contrast, vaccine-induced S-specific T cells maintained cross-reactivity against BA.5 compared with ancestral recognition. Homologous boosting induced higher frequencies of activated polyfunctional CD4+ T cell responses, with polyfunctional IL-21+ peripheral T follicular helper cells increased in mRNA-1273 compared with BNT162b2. IL-21+ cells correlated with antibody titers. Heterologous boosting with Ad26.COV2.S did not increase CD8+ responses compared to homologous boosting.ConclusionBoosting with the ancestral strain can induce cross-reactive T cell responses against emerging variants in SOTRs, but alternative vaccine strategies are required to induce robust CD8+ T cell responses.FundingBen-Dov Family; NIH National Institute of Allergy and Infectious Diseases (NIAID) K24AI144954, NIAID K08AI156021, NIAID K23AI157893, NIAID U01AI138897, National Institute of Diabetes and Digestive and Kidney Diseases T32DK007713, and National Cancer Institute 1U54CA260492; Johns Hopkins Vice Dean of Research Support for COVID-19 Research in Immunopathogenesis; and Emory COVID-19 research repository.

Keywords: Adaptive immunity; COVID-19; Organ transplantation; T cells; Vaccines.


Conflict of interest statement

Conflict of interest: NR has been a paid consultant for ICON and Emmes as a safety consultant for clinical trials and serves on the advisory board for Moderna, and Emory receives funds for her to conduct research from Sanofi, Eli Lilly and Co., Merck, Quidel, and Pfizer. WAW has received consulting fees from GlobalData, has received payment or honoraria from AstraZeneca, is on the advisory board for Novavax, and is a website editor for CDC/Infectious Diseases Society of America COVID-19 Real-Time Learning Network. DLS has received consulting fees from AstraZeneca, Novavax, Novartis, CareDx, Transmedics, CSL Behring, Jazz Pharmaceuticals, Veloxis, Mallinckrodt Pharmaceuticals, and Thermo Fisher Scientific. He has received payment for lectures and the like from Sanofi, AstraZeneca, Optum, CareDx, and Novartis and is a journal editor for Springer.

Figures

Figure 1
Figure 1. Increased Ab titers following mRNA boost with loss of BA.5 recognition regardless of regimen.
Plasma Ab responses were evaluated in participants who received 2 doses of an mRNA COVID-19 vaccine followed by adenoviral vector boost (Ad boost, blue, n = 40) or a third mRNA dose (mRNA boost, red, n = 35). Samples were collected approximately 2 weeks following the third dose. (A) Anti-spike (Anti-S) IgG titers as determined by Meso Scale Diagnostics (MSD) research assay. Significance tested using the Mann-Whitney U test. (B) Correlation between anti-S IgG and pseudo-neutralization MSD ACE2 binding inhibition assay against the ancestral WA-1 S protein or the BA.5 S protein. Significance tested using nonparametric Spearman correlation. (C and D) Comparison of ancestral ACE2 inhibition (C) or BA.5 ACE2 inhibition (D). Significance tested using the Mann-Whitney U test. (E) Sample matched comparison of ACE2 inhibition using ancestral or BA.5 S protein. Significance tested using Wilcoxon matched pairs signed-rank test. *P < 0.05. All data shown as mean ± SEM with each dot representing 1 individual.
Figure 2
Figure 2. CD4+ T cells maintain cross-reactivity against BA.5, with higher responses following mRNA boost.
Peripheral blood mononuclear cells (PBMCs) were stimulated overnight with overlapping peptides (15-mers overlapping by 11) against ancestral or BA.5 spike (S) protein. S protein–specific CD4+ T cell responses were evaluated in participants who received 2 doses of an mRNA COVID-19 vaccine followed by adenoviral vector boost (Ad boost, blue, n = 40) or a third mRNA dose (mRNA boost, red, n = 35). Samples were collected approximately 2 weeks following the third dose and run in 2 batches with participants evenly distributed between both batches. (A) Representative gating for CD4+ T cell responses, including phenotype of IL-21+ cells and relation to PD-1+CXCR5+ expression that defines peripheral T follicular helper (pTfh) cells. PD-1, programmed death 1. (B) Frequency of memory CD4+ T cells producing any cytokine (TNF, IFN-γ, IL-2, or IL-21) or each individual cytokine. All values are with unstimulated DMSO-only control levels subtracted. Samples with negative or 0 values were converted to the lowest detected value for visualization purposes. Significance tested using Mann-Whitney U test. (C) Sample paired comparison of CD4+ responses recalled by ancestral or BA.5 S peptides. Significance tested using Wilcoxon matched pairs signed-rank test. *P < 0.05. All data shown as mean ± SEM with each dot representing 1 individual.
Figure 3
Figure 3. CD8+ T cell responses are low following vaccination but maintain cross-reactivity against BA.5.
Peripheral blood mononuclear cells (PBMCs) were stimulated overnight with overlapping peptides (15-mers overlapping by 11) against ancestral or BA.5 spike (S) protein. S protein–specific CD8+ T cell responses were evaluated in participants who received 2 doses of an mRNA COVID-19 vaccine followed by adenoviral vector boost (Ad boost, blue, n = 40) or a third mRNA dose (mRNA boost, red, n = 35). Samples were collected approximately 2 weeks following the third dose and run in 2 batches with participants evenly distributed between both batches. (A) Representative gating for CD8+ T cell responses. (B) Frequency of memory CD8+ T cells producing any cytokine (TNF, IFN-γ, IL-2, or IL-21) or each individual cytokine. All values are with unstimulated DMSO-only control levels subtracted. Samples with negative or 0 values were converted to the lowest detected value for visualization purposes. Significance tested using Mann-Whitney U test. (C) Sample paired comparison of CD8 responses recalled by ancestral or BA.5 S peptides. Significance tested using Wilcoxon matched pairs signed-rank test. Significance tested using Wilcoxon matched pairs signed-rank test. All data shown as mean ± SEM with each dot representing 1 individual.
Figure 4
Figure 4. Increased polyfunctional CD4+ T cells following mRNA boost.
Spike protein–specific T cell responses were evaluated in participants who received 2 doses of an mRNA COVID-19 vaccine followed by adenoviral vector boost (Ad boost, blue, n = 40) or a third mRNA dose (mRNA boost, red, n = 35). Polyfunctionality of the memory CD4+ or CD8 T cell responses. Pie charts show the fraction of total cytokine response comprising any combination of IFN-γ, IL-2, TNF, or IL-21. Pie arcs show the proportion making each cytokine as annotated. (A) Comparison of CD4+ response to ancestral or BA.5 peptides, regardless of boosting regimen. (B) Comparison of CD4+ response against BA.5 peptides, stratified by boosting regimen. (C) Overview of CD4+ response against BA.5 peptides, with percentage of total memory CD4+ T cells shown for individual polyfunctional categories. Significance tested using the Wilcoxon ranked test as calculated in SPICE v6. (D) Comparison of CD8+ response to ancestral or BA.5 peptides, regardless of boosting regimen. (E) Comparison of CD8+ response against BA.5 peptides, segregated by boosting regimen. (F) Overview of CD8+ response against BA.5 peptides with percentage of total memory CD8+ T cells shown for individual polyfunctional categories. Significance tested using the Wilcoxon ranked test as calculated in SPICE v6.
Figure 5
Figure 5. Polyfunctional CD4+ T cells correlate with Ab titers.
Spike-specific T cell responses were evaluated in participants who received 2 doses of an mRNA COVID-19 vaccine followed by adenoviral vector boost (Ad boost, blue, n = 40) or a third mRNA dose (mRNA boost, red, n = 35). Polyfunctionality of the memory CD4+ or CD8+ T cell responses was calculated regardless of boosting regimen. Multivariate correlation of polyfunctional CD4+ or CD8+ categories with anti-S IgG titers and ACE2 inhibition. Correlation tested using nonparametric Spearman test. Values with nonsignificant correlation (P > 0.05) had Spearman coefficient changed to 0.
Figure 6
Figure 6. Homologous mRNA boost induces qualitatively different CD4+ T cells with increased metabolic response, cytokine production, and memory phenotype.
(A) UMAP of total cytokine-producing (i.e., producing IL-2, TNF, IFN-γ, or IL-21) memory CD4+ T cells following overnight stimulation with BA.5 spike (S) peptides segregated by individuals receiving an adenoviral vector (Ad, blue, n = 21) boost compared with an mRNA boost (red, n = 20). (B) Xshift clustering algorithm detected 21 distinct clusters as shown on the UMAP and as a proportion of the entire S-specific T cell compartment. (C) Heatmap of normalized expression of all markers within flow cytometry panel according to Xshift cluster. (D) Frequency of clusters according to boosting regimen. Significance tested using repeated measures 2-way ANOVA with the Geisser-Greenhouse correction. (E) Individual values shown for significant clusters as determined in D. (F) Normalized expression of all markers with significant clusters highlighted. (G) Frequency of clusters according to individuals who mounted an Ab response above the positive cutoff (low n = 14, high n = 27). Significance tested using repeated measures 2-way ANOVA with the Geisser-Greenhouse correction. (H) Individual values shown for statistically significant clusters as determined in G. (I) Normalized expression of all markers with statistically significant clusters highlighted. (J) Frequency of clusters according to individuals who mounted CD8+ response above the average (low n = 28, high n = 13). Significance tested using repeated measures 2-way ANOVA with the Geisser-Greenhouse correction. (K) Individual values shown for statistically significant clusters as determined in J. (L) Normalized expression of all markers with statistically significant clusters highlighted. *P < 0.05, **P < 0.01. Data shown as mean ± SEM (in shaded bars for panels D, G, J) with each dot representing 1 individual.
Figure 7
Figure 7. CD8+ responses are not qualitatively different based on boosting regimen but are associated with differential Ab and CD4+ response.
(A) UMAP of total cytokine-producing (i.e., producing IL-2, TNF, IFN-γ, or IL-21) memory CD8+ T cells following overnight stimulation with BA.5 spike (S) peptides segregated by individuals receiving an adenoviral vector (Ad, blue, n = 21) boost compared with an mRNA boost (red, n = 20). (B) Xshift clustering algorithm detected 12 distinct clusters as shown on the UMAP and as a proportion of the entire S protein–specific compartment. (C) Heatmap of normalized expression of all markers within flow cytometry panel according to Xshift cluster. (D) Frequency of clusters according to individuals who mounted an Ab response above the positive cutoff (low n = 14, high n = 27). Significance tested using repeated measure 2-way ANOVA with the Geisser-Greenhouse correction. (E) Individual values shown for significant clusters as determined in D. (F) Normalized expression of all markers with significant clusters highlighted. (G) Frequency of clusters according to individuals who mounted a CD4+ response above the average (low n = 23, high n = 23). Significance tested using repeated measures 2-way ANOVA with the Geisser-Greenhouse correction. (H) Individual values shown for significant clusters as determined in G. (I) Normalized expression of all markers with significant clusters highlighted. (J) Frequency of clusters according to individuals who mounted a CD8+ response above the average (low n = 28, high n = 13). Significance tested using repeated measures 2-way ANOVA with the Geisser-Greenhouse correction. (K) Individual values shown for significant clusters as determined in J. (L) Normalized expression of all markers with significant clusters highlighted. *P < 0.05, **P < 0.01, ***P < 0.001, and ****P < 0.0001. Data shown as mean ± SEM (in shaded bars for panels D, G, J) with each dot representing 1 individual.

Similar articles

Cited by

References

    1. Haidar G, et al. Prospective evaluation of Coronavirus Disease 2019 (COVID-19) vaccine responses across a broad spectrum of immunocompromising conditions: the COVID-19 vaccination in the immunocompromised study (COVICS) Clin Infect Dis. 2022;ciac103(1):e630–e644. doi: 10.1093/cid/ciac103. - DOI - PMC - PubMed
    1. Bergman P, et al. Safety and efficacy of the mRNA BNT162b2 vaccine against SARS-CoV-2 in five groups of immunocompromised patients and healthy controls in a prospective open-label clinical trial. EBioMedicine. 2021;74:103705. doi: 10.1016/j.ebiom.2021.103705. - DOI - PMC - PubMed
    1. Sun J, et al. Association between immune dysfunction and COVID-19 breakthrough infection after SARS-CoV-2 vaccination in the US. JAMA Intern Med. 2022;182(2):153–162. doi: 10.1001/jamainternmed.2021.7024. - DOI - PMC - PubMed
    1. Kwon JH, et al. mRNA vaccine effectiveness against Coronavirus Disease 2019 hospitalization among solid organ transplant recipients. J Infect Dis. 2022;226(5):797–807. doi: 10.1093/infdis/jiac118. - DOI - PMC - PubMed
    1. Karaba AH, et al. A third dose of SARS-CoV-2 vaccine increases neutralizing antibodies against variants of concern in solid organ transplant recipients. Am J Transplant. 2022;22(4):1253–1260. doi: 10.1111/ajt.16933. - DOI - PMC - PubMed

Publication types

Supplementary concepts