. 2023 Jun 15;133(12):e163105.
doi: 10.1172/JCI163105.

C5aR1 signaling triggers lung immunopathology in COVID-19 through neutrophil extracellular traps

Affiliations

C5aR1 signaling triggers lung immunopathology in COVID-19 through neutrophil extracellular traps

Bruna M Silva et al. J Clin Invest. .

Abstract

Patients with severe COVID-19 develop acute respiratory distress syndrome (ARDS) that may progress to cytokine storm syndrome, organ dysfunction, and death. Considering that complement component 5a (C5a), through its cellular receptor C5aR1, has potent proinflammatory actions and plays immunopathological roles in inflammatory diseases, we investigated whether the C5a/C5aR1 pathway could be involved in COVID-19 pathophysiology. C5a/C5aR1 signaling increased locally in the lung, especially in neutrophils of critically ill patients with COVID-19 compared with patients with influenza infection, as well as in the lung tissue of K18-hACE2 Tg mice (Tg mice) infected with SARS-CoV-2. Genetic and pharmacological inhibition of C5aR1 signaling ameliorated lung immunopathology in Tg-infected mice. Mechanistically, we found that C5aR1 signaling drives neutrophil extracellular traps-dependent (NETs-dependent) immunopathology. These data confirm the immunopathological role of C5a/C5aR1 signaling in COVID-19 and indicate that antagonists of C5aR1 could be useful for COVID-19 treatment.

Keywords: COVID-19; Complement; Inflammation; Innate immunity; Molecular pathology.


Figures

Figure 1
Figure 1. C5a levels and C5AR1 expression in the BAL fluid and cells from patients with COVID- 19.
An ELISA assay was performed to measure the concentrations of (A) C5a, (B) factor Bb, and (C) C3a in the BAL fluid from patients with influenza (n = 16) and patients with COVID- 19 (n = 16). (B) Paired concentrations of (D) C5a and (E) factor Bb in the plasma and BAL fluid from patients with COVID-19 were determined by ELISA. (F) A different cohort from a previously published data set was reanalyzed and the t-SNE analysis of total cells (65,166) from BAL fluid of patients with non-COVID-19 pneumonia (n = 13) and COVID-19 (n = 22) is shown. (G) Dot plots display the highlighted distribution of C5AR1 for each indicated cell population. (H) Violin plots showing the expression levels of C5aR1 in each type of cell from patients with COVID-19 or with non-COVID-19 pneumonia. (I) The dot plot depicts the scaled and centered expression of an average cell in each cluster and therefore contains negative and positive values. The average expression reflects the mean expression of C5AR1 in each cluster compared with all other cells. (J) Number of cells per cell population [neutrophils (Neu), monocytes/macrophages (Mo/Mac), and dendritic cells (cDC)] that express C5AR1 in the groups of patients with COVID-19 and non-COVID-19 pneumonia. (K) Average expression of C5AR1 per cell for each cell population [neutrophils (Neu), monocytes/macrophages (Mo/Mac), and dendritic cells (cDC)] in the groups of patients with COVID-19 and non-COVID-19 pneumonia. Data are shown as the mean ± SEM. P values were determined by 2-tailed unpaired (AD, J, and K) or paired (D and E) Student’s t tests followed by Wilcoxon matched-pairs signed rank tests.
Figure 2
Figure 2. C5aR1 is expressed in macrophages and neutrophils in the lung tissue of patients with COVID-19.
(A) Representative confocal images of the presence of C5aR1 in macrophages (Iba-1) and neutrophils (neutrophil elastase, NE) in the lung tissue from autopsies of patients with COVID-19 (n = 4 cases/4 randomized field). Cells were stained for nuclei (DAPI, blue), Iba-1, or NE (green), and C5aR1 (red). Scale bar: 50 μm. (B) Percentage of cells expressing C5aR1 in the COVID-19 lung. Data are shown as the mean ± SEM. P values were determined by 1-way ANOVA followed by Bonferroni’s posthoc test (B).
Figure 3
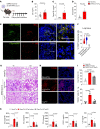
Figure 3. C5aR1 signaling on myeloid cells contributes to the lung pathology in a COVID-19 mouse model.
(A) Tg mice were infected with SARS-CoV-2 (2 × 10⁴ PFU, intranasally). ELISA assay to measure levels of (B) C5a in the lung homogenate of infected animals (n = 14) or mock control (n = 11). (C) factor Bb and (D) C3a levels in the lung homogenate of infected animals (n = 8) or mock control (n = 5). (E) Representative confocal images of the presence of C5aR1 expression in the lung tissue of Tgfl/fl mice (C5ar1-eGFP mice) infected with SARS-CoV-2 (5 dpi). Tissue slices were costained for nuclei (DAPI, blue), Iba-1 (macrophages, red) and NE (neutrophils, red) markers. Scale bar: 50 μm. (F) Percentage of cells expressing C5aR1 in the lung tissue of Tgfl/fl mice infected with SARS-CoV-2 (n = 4 mice/4 randomized field). (G) Representative H&E staining from the lung of SARS-CoV-2-infected Tgfl/fl(n = 6) or TgcKO mice (n = 6). A mock-infected group was used as control (n = 6). Scale bars: 200 μm (4 ×), 100 μm(10 ×). (H) TUNEL staining (red) for detection of apoptotic cells in situ from lung tissue of SARS-CoV-2–infected Tgfl/fl (n = 5) or TgcKO mice (n = 6). Mock-infected Tg mice were used as a control (n = 5/group). (I) Quantification of the lung septal area fraction. (J) Percentage of TUNEL positive cells in lung tissue. Scale bar: 50 μm. (K) ELISA assays were performed to detect CCL2, CCL3, CCL4, CXCL1, and IL-6 levels in the lung tissue of Tgfl/f (n = 8) or Infected TgcKO mice (n = 7). Mock-infected Tg mice were used as a control (n = 5). Data are shown as the mean ± SEM. P values were determined by (BD) Student’s 2-tailed t test and (F, I, J, and K) 1-way ANOVA followed by Bonferroni’s posthoc test.
Figure 4
Figure 4. DF2593A, a selective C5aR1 antagonist, ameliorates COVID-19 in mice model.
(A) Tg mice were infected with SARS-CoV-2 (2 x 10⁴ PFU, intranasally) and treated with DF2593A (3 mg/kg, p.o) 1 hour before SARS-CoV-2 infection and once a day up to the day of sample collection (5 dpi). (B) Body weight, clinical score, and oxygen saturation were measured daily after infection (n = 11/group, pooled from 2 independent experiments). (C) Representative H&E staining from the harvested lung of the COVID-19 mouse model treated (n = 4) or not (n = 6) with DF2593A. A mock-infected group was used as control (n = 5). Scale bars: 200 μm (4 ×); 100 μm (10 ×). (D) TUNEL staining (green) for detection of apoptotic cells in situ from lung tissue of mice (n = 5/group). (E) Quantification of the lung septal area fraction. (F) Percentage of TUNEL-positive cells in lung tissue. Scale bar: 50 μm. (G) ELISA assays were performed to detect CCL2, CCL3, CCL4, CXCL1, and IL-6 levels in lung homogenate (n = 6/group). A mock-infected group was used as the control group. Data are shown as the mean ± SEM. P values were determined by 1-way ANOVA followed by Bonferroni’s posthoc test (EG).
Figure 5
Figure 5. The postinfection treatment with DF2593A reduced lung pathology/disfunction in SARS-CoV-2-infected Tg mice.
(A) Tg mice were infected with SARS-CoV-2 (2 × 10⁴ PFU, intranasally) and treated with DF2593A (3 mg/kg, p.o) 24 hours after SARS-CoV-2 infection and once a day up to the day of sample collection (5 dpi). (B) Body weight, clinical score, and oxygen saturation were measured daily after infection (n = 5/group). (C) Representative H&E staining from the harvested lung of the COVID-19 mouse model treated or not with DF2593A (n = 5/group). A mock-infected group was used as control (n = 5). Scale bars: 200 μm (4 ×); 100 μm (10 ×). (D) Quantification of the lung septal area fraction. Data are shown as the mean ± SEM. P values were determined by 1-way ANOVA followed by Bonferroni’s posthoc test.
Figure 6
Figure 6. C5a/C5aR1 signaling is involved in the pathophysiology of COVID-19 through NET formation.
Tgfl/fl (n = 8) and TgcKO (n = 8) mice were infected with SARS-CoV-2 (2 × 10⁴ PFU, intranasally). (A) Representative confocal images showing the presence of NETs in the lung tissue from Tgfl/fl or Infected TgcKO mice. A mock- infected group was performed as control (n = 5). Staining shows nuclei (DAPI, blue), H3Cit (green), and myeloperoxidase (MPO) (red). (B) At 5 dpi, the levels of NETs were quantified by MPO-DNA PicoGreen assay in the supernatant of the lung homogenate. (C) Tg-infected mice were treated with DF2593A (3mg/kg, p.o, n = 6) or vehicle (n = 5/group). Representative confocal images showing the presence of NETs in the lung tissue of Tg-infected mice treated with DF2593A or vehicle (n = 5/group). A mock-infected group was performed as control (n = 5). (D) At 5 dpi, NETs levels were quantified by MPO-DNA PicoGreen assay in the supernatant of the lung homogenate. Data are shown as the mean ± SeM. P values were determined by 1-way ANOVA followed by Bonferroni’s posthoc test (B and D). Scale bar: 50 μm.
Figure 7
Figure 7. Intratracheal instillation with C5a induced lung immunopathology via C5aR1 signaling and NETs.
(A) C57/BL6 mice were treated twice with vehicle, DNAse (Pulmozyme, 10 mg/kg, s.c.), or C5aR1 antagonist (DF2593A, 3 mg/kg, orally), 24 hours and 1 hour before the intratracheal instillation of rmC5a (400 ng). (B) Lung slices from the control group or mice challenged with rmC5a and treated with vehicle, DNAse, or C5aR1 antagonist (DF2593A) were stained with H&E for evaluation of histological changes. (C) Quantification of the lung septal area fraction (n = 5/group). (D) Lung slices from the control group or from mice challenged with rmC5a and treated with vehicle, DNAse, or C5aR1 antagonist (DF2593A) were costained for nuclei (DAPI, blue), H3Cit (green), and MPO (red) markers. (E) NET quantification by the MPO-DNA PicoGreen assay in the supernatant of the lung homogenate (n = 5–6/group). (F) ELISA assays were performed to detect CCL2, CCL3, CCL4, CXCL1, and IL-6 levels in lung homogenate (n = 5–6/group). Data are shown as the mean ± SEM. P values were determined by 1-way ANOVA followed by Bonferroni’s posthoc test (C, E, and F).
Figure 8
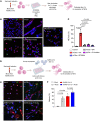
Figure 8. C5a is able to directly promote and enhance SARS-CoV-2-induced NETosis.
(A) Isolated human neutrophils were incubated with PBS, DPI, Cl-amidine, or DF2593A for 1 h and then challenged with rhC5a (3 nM) for 4 h. (B) Cells were stained for nuclei (DAPI, blue), NE (green), and MPO (red). (C) Percentage of NETs quantification in these neutrophils supernatants (n = 3 donors). (D) Neutrophils were isolated from healthy donors and incubated with mock, rhC5a (3 nM), and SARS-CoV-2 (MOI = 1.0) for 4 hours. One group of SARS-CoV-2-infected cells was pretreated with rhC5a (3 nM). (E) Representative images of NETs release. Cells were stained for nuclei (DAPI, blue), NE (green), and MPO (red). Scale bar: 50 μm. (F) Percentage of NETs quantification in these neutrophils supernatants (n = 3 donors). Data are shown as the mean ± SEM. P values were determined by 1-way ANOVA followed by Bonferroni’s posthoc test (C and F).

References

    1. Hu B, et al. Characteristics of SARS-CoV-2 and COVID-19. Nat Rev Microbiol. 2021;19(3):141–154. - PMC - PubMed
    1. Berlin DA, et al. Severe Covid-19. N Engl J Med. 2020;383(25):2451–2460. doi: 10.1056/NEJMcp2009575. - DOI - PubMed
    1. Valle DM Del, et al. An inflammatory cytokine signature predicts COVID-19 severity and survival. Nat Med. 2020;26(10):1636–1643. doi: 10.1038/s41591-020-1051-9. - DOI - PMC - PubMed
    1. Paludan SR, Mogensen TH. Innate immunological pathways in COVID-19 pathogenesis. Sci Immunol. 2022;7(67):eabm5505. doi: 10.1126/sciimmunol.abm5505. - DOI - PubMed
    1. Van de Veerdonk FL, et al. A guide to immunotherapy for COVID-19. Nat Med. 2022;28(1):39–50. doi: 10.1038/s41591-021-01643-9. - DOI - PubMed

Publication types