

Evaluating phenotypes associated with heat tolerance and identifying moderate and severe heat stress thresholds in lactating sows housed in mechanically or naturally ventilated barns during the summer under commercial conditions
- PMID: 37104047
- PMCID: PMC10195204
- DOI: 10.1093/jas/skad129
Evaluating phenotypes associated with heat tolerance and identifying moderate and severe heat stress thresholds in lactating sows housed in mechanically or naturally ventilated barns during the summer under commercial conditions
Abstract
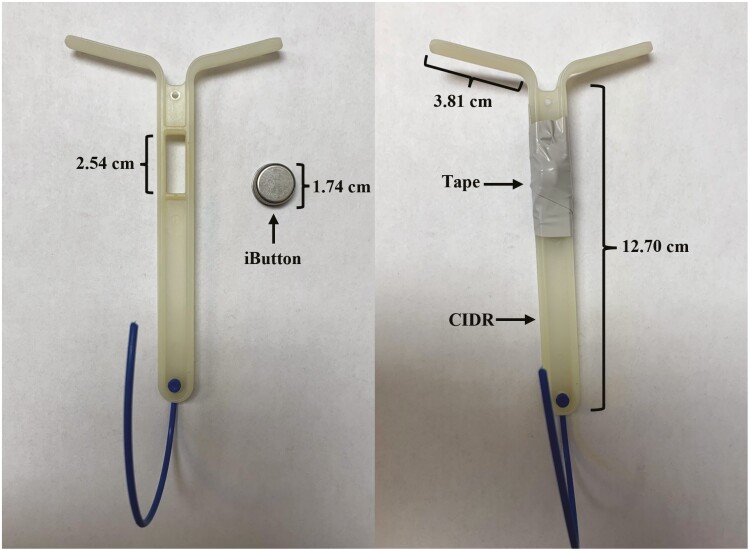
An accurate understanding of heat stress (HS) temperatures and phenotypes that indicate HS tolerance is necessary to improve swine HS resilience. Therefore, the study objectives were 1) to identify phenotypes indicative of HS tolerance, and 2) to determine moderate and severe HS threshold temperatures in lactating sows. Multiparous (4.10 ± 1.48) lactating sows and their litters (11.10 ± 2.33 piglets/litter) were housed in naturally ventilated (n = 1,015) or mechanically ventilated (n = 630) barns at a commercial sow farm in Maple Hill, NC, USA between June 9 and July 24, 2021. In-barn dry bulb temperatures (TDB) and relative humidity were continuously recorded for naturally ventilated (26.38 ± 1.21 °C and 83.38 ± 5.40%, respectively) and mechanically ventilated (26.91 ± 1.80 °C and 77.13 ± 7.06%, respectively) barns using data recorders. Sows were phenotyped between lactation days 11.28 ± 3.08 and 14.25 ± 3.26. Thermoregulatory measures were obtained daily at 0800, 1200, 1600, and 2000 h and included respiration rate, and ear, shoulder, rump, and tail skin temperatures. Vaginal temperatures (TV) were recorded in 10 min intervals using data recorders. Anatomical characteristics were recorded, including ear area and length, visual and caliper-assessed body condition scores, and a visually assessed and subjective hair density score. Data were analyzed using PROC MIXED to evaluate the temporal pattern of thermoregulatory responses, phenotype correlations were based on mixed model analyses, and moderate and severe HS inflection points were established by fitting TV as the dependent variable in a cubic function against TDB. Statistical analyses were conducted separately for sows housed in mechanically or naturally ventilated barns because the sow groups were not housed in each facility type simultaneously. The temporal pattern of thermoregulatory responses was similar for naturally and mechanically ventilated barns and several thermoregulatory and anatomical measures were significantly correlated with one another (P < 0.05), including all anatomical measures as well as skin temperatures, respiration rates, and TV. For sows housed in naturally and mechanically ventilated facilities, moderate HS threshold TDB were 27.36 and 26.69 °C, respectively, and severe HS threshold TDB were 29.45 and 30.60 °C, respectively. In summary, this study provides new information on the variability of HS tolerance phenotypes and environmental conditions that constitute HS in commercially housed lactating sows.
Keywords: climatic resilience; closer-to-biology phenotypes; heat stress; phenomics.
Plain language summary
Climate change and the associated increase in global temperatures have a well-described negative impact on swine production. Therefore, improving swine heat stress resilience is of utmost importance to reduce the deleterious effects of heat stress on swine health, performance, and welfare. Genomic selection for heat stress resilience may be a viable strategy to improve swine productivity in a changing climate. However, identifying environmental conditions that constitute heat stress and deriving novel traits that can be easily collected on farm and provide accurate and precise predictions of heat stress tolerance is a necessary step. The present study demonstrated that housing conditions had a limited influence on heat stress tolerance phenotypes, several anatomical and thermoregulatory measures were correlated, and housing conditions impacted heat stress threshold temperatures. Results from this study may be applied to large-scale phenotyping initiatives to develop or refine genomic selection indexes for heat stress resilience in pigs.
Published by Oxford University Press on behalf of the American Society of Animal Science 2023. This work is written by (a) US Government employee(s) and is in the public domain in the US.
Conflict of interest statement
No conflict of interest, financial, or otherwise are declared by the author(s). Mention of trade names or commercial products in this article is solely for the purpose of providing specific information and does not imply recommendation or endorsement by the U.S. Department of Agriculture. All opinions expressed in this paper are the authors’ and do not necessarily reflect the policies and views of the USDA. The USDA is an equal opportunity lender, provider, and employer.
Figures


Similar articles
-
Phenotypic assessment of F0 generation lactating sows genomically selected for heat stress tolerance.J Anim Sci. 2025 Jan 4;103:skaf205. doi: 10.1093/jas/skaf205. J Anim Sci. 2025. PMID: 40576269
-
Electronically controlled cooling pads can improve litter growth performance and indirect measures of milk production in heat-stressed lactating sows.J Anim Sci. 2022 Feb 1;100(2):skab371. doi: 10.1093/jas/skab371. J Anim Sci. 2022. PMID: 34932814 Free PMC article.
-
Genomic regions, candidate genes, and pleiotropic variants associated with physiological and anatomical indicators of heat stress response in lactating sows.BMC Genomics. 2024 May 13;25(1):467. doi: 10.1186/s12864-024-10365-4. BMC Genomics. 2024. PMID: 38741036 Free PMC article.
-
Effect of heat stress on pig production and its mitigation strategies: a review.Trop Anim Health Prod. 2025 Mar 21;57(3):139. doi: 10.1007/s11250-025-04387-7. Trop Anim Health Prod. 2025. PMID: 40117038 Review.
-
Review: Nutrient requirements of the modern high-producing lactating sow, with an emphasis on amino acid requirements.Animal. 2019 Dec;13(12):2967-2977. doi: 10.1017/S1751731119001253. Epub 2019 Jun 14. Animal. 2019. PMID: 31199216 Review.
Cited by
-
Longitudinal genomic analyses of automatically-recorded vaginal temperature in lactating sows under heat stress conditions based on random regression models.Genet Sel Evol. 2023 Dec 21;55(1):95. doi: 10.1186/s12711-023-00868-1. Genet Sel Evol. 2023. PMID: 38129768 Free PMC article.
-
Genetic parameters for automatically-measured vaginal temperature, respiration efficiency, and other thermotolerance indicators measured on lactating sows under heat stress conditions.Genet Sel Evol. 2023 Sep 20;55(1):65. doi: 10.1186/s12711-023-00842-x. Genet Sel Evol. 2023. PMID: 37730542 Free PMC article.
-
Genetic parameters for novel climatic resilience indicators derived from automatically-recorded vaginal temperature in lactating sows under heat stress conditions.Genet Sel Evol. 2024 Jun 10;56(1):44. doi: 10.1186/s12711-024-00908-4. Genet Sel Evol. 2024. PMID: 38858613 Free PMC article.
-
Investigating the impact of non-additive genetic effects in the estimation of variance components and genomic predictions for heat tolerance and performance traits in crossbred and purebred pig populations.BMC Genom Data. 2023 Dec 13;24(1):76. doi: 10.1186/s12863-023-01174-x. BMC Genom Data. 2023. PMID: 38093199 Free PMC article.
-
Early gestation heat stress influences fetal biomarkers indicative of maternal cortisol transfer in pigs.Sci Rep. 2025 Jul 23;15(1):26730. doi: 10.1038/s41598-025-12698-w. Sci Rep. 2025. PMID: 40702145 Free PMC article.
References
-
- Black, J. L., Mullan B. P., Lorschy M. L., and Giles L. R.. . 1993. Lactation in the sow during heat stress. Livestock Prod. Sci. 35:153–170. doi:10.1016/0301-6226(93)90188-N. - DOI
-
- Blatteis, C. M. 1998. Body temperature. In: Blatteis, C. M., editor. Physiology and pathophysiology of temperature regulation. River Edge, NJ: World Scientific Publishing Co; p. 3–22.
-
- Brito, L. F., Oliveira H. R., McConn B. R., Schinckel A. P., Arrazola A., Marchant-Forde J. N., and Johnson J. S.. . 2020. Large-scale phenotyping of livestock welfare in commercial production systems: a new frontier in animal breeding. Front. Genet. 11:793. doi:10.3389/fgene.2020.00793. - DOI - PMC - PubMed
MeSH terms
LinkOut - more resources
Full Text Sources
