. 2023 May 30;42(5):112435.
doi: 10.1016/j.celrep.2023.112435. Epub 2023 Apr 26.

Organelle interactions compartmentalize hepatic fatty acid trafficking and metabolism

Affiliations

Organelle interactions compartmentalize hepatic fatty acid trafficking and metabolism

Charles P Najt et al. Cell Rep. .

Abstract

Organelle interactions play a significant role in compartmentalizing metabolism and signaling. Lipid droplets (LDs) interact with numerous organelles, including mitochondria, which is largely assumed to facilitate lipid transfer and catabolism. However, quantitative proteomics of hepatic peridroplet mitochondria (PDM) and cytosolic mitochondria (CM) reveals that CM are enriched in proteins comprising various oxidative metabolism pathways, whereas PDM are enriched in proteins involved in lipid anabolism. Isotope tracing and super-resolution imaging confirms that fatty acids (FAs) are selectively trafficked to and oxidized in CM during fasting. In contrast, PDM facilitate FA esterification and LD expansion in nutrient-replete medium. Additionally, mitochondrion-associated membranes (MAM) around PDM and CM differ in their proteomes and ability to support distinct lipid metabolic pathways. We conclude that CM and CM-MAM support lipid catabolic pathways, whereas PDM and PDM-MAM allow hepatocytes to efficiently store excess lipids in LDs to prevent lipotoxicity.

Keywords: CP: Metabolism; MAM; cytosolic mitochondria; fatty acids; lipid anabolism; lipid catabolism; lipid droplets; organelle interactions; peridroplet mitochondria; perilipin 5; single-molecule localization microscopy.


Conflict of interest statement

Declaration of interests The authors declare no competing interests.

Figures
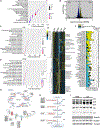
Figure 1.
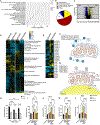
Figure 1.. CM and PDM have unique proteomes
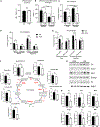
(A) Cellular compartment annotation of the entire proteomics dataset as determined by Gene Ontology (GO) analysis: cellular component. (B) Volcano plot summarizing the changes in the proteomes of CM and PDM isolated from livers of overnight-fasted mice; n = 4. Blue indicates proteins that were enriched in the PDM fractions, and yellow indicates CM-enriched proteins. Significance was determined using non-parametric quantitative analysis in Scaffold; permutation tests between groups with Benjamini-Hochberg correction (p < 0.00968). (C and D) Pathway analysis for the 390 and 676 statistically significant proteins in CM and PDM, respectively. (E) Left: hierarchical clustering of proteins significantly different between PDM and CM across replicate fractions. The threshold for clustered proteins was determined by significance between groups. Right: proteins were further grouped using k-means statistics, breaking the PDM and CM significant genes into 10 protein clusters. The clustered proteins were mapped to specific metabolic pathways using Panther classification overrepresentation testing. (F) GO terms from the pathway analysis of all significant proteins were expressed as a percentage of proteins enriched in PDM (blue), CM (yellow), or unchanged (black). (G) Schematic of the TCA cycle and oxidative phosphorylation (OXPHOS) pathways, highlighting proteins significantly upregulated in CM. (H) Schematic of the FA β-oxidation pathway, with proteins significantly upregulated in CM highlighted. (I) Mitochondrial fractions were analyzed by SDS-PAGE and immunoblotting for the OXPHOS complex proteins Acadvl, Acadm, and Acaa2. Samples normalized to Ponceau S are shown in Figure S1E.
Figure 2.
Figure 2.. CM have enhanced bioenergetic capacity
(A) Quantification of MitoTracker Deep Red fluorescence intensity (F.I.) of isolated CM or PDM to ensure equal mitochondrial content. 12–16 wells were quantified per condition and repeated on three independent isolations. (B) Quantification of TMRE F.I. in control and FCCP-treated mitochondrial fractions; 12–16 wells, repeated on three independent isolations. (C) Quantification of mitochondrial FA oxidation using [14C]oleate in mitochondrial fractions isolated from mice in the fed or fasted metabolic state. n = 3. (D) The FA uptake inhibitor etomoxir was used to ensure the oxidation rates determined from our experimental design were due to mitochondrial FA β-oxidation. Shown is quantification of FA oxidation from PDM and CM fractions treated with DMSO or etomoxir in basal or ADP-stimulated maximal respiration. n = 6 from2 different mitochondrial isolations. (E) Quantification of mitochondrial FA oxidation for CM and PDM isolated from control or PLIN5 KD animals in the fed or fasted metabolic state. n = 4 mitochondrial fractions isolated from independent mice. (F) TCA cycle intermediates were analyzed by MS from PDM and CM treated with [13C]palmitate as the fuel source. Metabolite intermediates enriched in [13C] were quantified and expressed relative to CM. Shown is a schematic of the TCA cycle with the detected metabolites and the fold change between PDM and CM. (G) Mitochondrial fractions were analyzed by SDS-PAGE and immunoblotting to Cs, Aco1, Idh3, Suclg1, Fh, and Mdh2. Samples normalized to Ponceau S are shown in Figure S1F. (H) Quantification of immunoblots depicted in (H) relative to total protein loading. ns, p > 0.05; *p < 0.05; **p < 0.01; ***p < 0.001; ****p < 0.0001.
Figure 3.
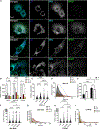
Figure 3.. SMLM quantifies differential FA trafficking to CM and PDM dependent on metabolic state
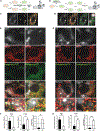
(A and B) Schematic of the experimental design for exogenous (A) or endogenous (B) FA tracing for SMLM experiments. (C) Left: conventional fluorescence image of LDs in mammalian cells stained with the AutoDOT dye. Center: to discriminate CM from PDM, binary masks are created by thresholding the conventional fluorescence image of LDs. The depicted scaled contour of the binary LD signal is used to identify the mitochondrial fluorescence signal in proximity to LDs as PDM (red line, LD boundary; green line, PDM boundary). Right: two-color SMLM image of BODIPY-C12 (green) and Tom20-HaloTag JF646 localizations (red) superimposed on the conventional fluorescence LD signal. (D) Left: BODIPY-C12 and Tom20-HaloTag JF646 localizations in PDM as identified by the scaled LD contour. Center: BODIPY-C12 and Tom20-HaloTag JF646 localizations in CM. Right: super-imposed SMLM image of BODIPY-C12 localizations in PDM (red) and BODIPY-C12 localizations in CM (green). Magnification: BODIPY-C12 in PDM and CM around an LD cluster. Scale bar, 5 μm. (E) Exogenous FA tracing experiments; top to bottom: conventional fluorescence image of LDs stained with AutoDOT dye under fed (left) and fasted (right) conditions. SMLM image of mitochondria labeled with Tom20-HaloTag JF646. Shown are super-resolution images of the FA analog BODIPY-C12 under fed (left) and fasted (right) conditions and super-imposed SMLM images of Tom20-HaloTag JF646 and BODIPY-C12 localizations on top of conventional LD fluorescence images under fed (left) and fasted condition (right). Magnifications depict Tom20 and FA distribution around clustered LD regions. Scale bar, 5 μm. (F) Quantification of the density of exogenous BODIPY-C12 FAs in PDM and CM in fed (left) and fasted (center) cells and the FA density ratio of CM/PDM (right). (G) Endogenous FA tracing experiments as in (C) with the BODIPY-C12 (150 nM) preloaded in LDs overnight with non-fluorescent oleate (250 mM) and switched to fed (left) and fasting medium (right). (H) Quantification of the density of endogenous BODIPY-C12 FA densities in PDM and CM in the fed (left) and fasted state (center) and FA density ratios of CM/PDM (right). ns, p > 0.05; *p < 0.05; **p < 0.01; ***p < 0.001.
Figure 4.
Figure 4.. PDM-LD association promotes lipid synthesis
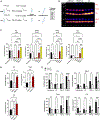
(A) Schematic of the experimental design using [1-14C]oleate or acetate as the substrate to assess FA incorporation into complex lipids from samples isolated from fasted mice. (B) Representative thin-layer chromatography (TLC) of lipids extracted from liver homogenates, LDs, and mitochondrion-LD incubations. (C) [1-14C]oleate incorporation into PL, DAG, TAG, and CE. n = 3 independent isolations. (D) [1-14C]acetate incorporation into PL, TAG, and FA. n = 3. (E) [1-14C]oleate incorporation into LDs co-incubated with CM and PDM isolated from control or PLIN5 KD fasted animals. n = 4. ns, p > 0.05; *p < 0.05; **p < 0.01; ***p < 0.001; ****p < 0.0001.
Figure 5.
Figure 5.. Fasting-to-feeding transitions regulate mitochondrion-LD and mitochondrion-ER-LD contacts
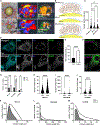
(A) Micrographs of LDs surrounded by PDM and CM from control ASO mice fasted overnight in addition to 3D reconstruction of serial tomograms compiled as a single image. Blue, ER; red, mitochondria; yellow, LDs. ER-MITO-LD (orange), ER-LD (green), and MITO-ER-LD (white) interactions were identified and segmented to render interaction maps in 3D and are shown in the far-right image. (B) Schematic of the different interactions. (C) Quantitative analysis of the ER-MITO-LD, ER-LD, and MITO-ER-LD contacts. Quantification was determined from 2 samples and 4 regions of interest. (D) Representative confocal microscopy images of mitochondria, LDs, and the MAM sensor (SPLICSs) in AML12 cells in fed and fasting medium. (E) Quantification of SPLICS by total mean intensity per cell. n = 6–8 images with 12–16 cells per condition. (F) Colocalization analysis burned onto binary images, identifying the region of interaction between the SPLICS sensor and the mitochondrial signal (green) or the SPLIC sensor and the LDs (purple). (G) DiAna plug-in colocalization was determined from images in (D), quantifying the number of MITO-LD, MAM-MITO, and MAM-LD contacts as determined by the DiAna plug-in. (H) Surface contact length between mitochondria and LDs in the fed and fasted state. (I) Surface contact length between SPLICS and mitochondria in the fed and fasted state as determined by the DiAna plug-in in FIJI. (J) Quantification of surface contact length between SPLICS and LDs in fed and fasted states (K–M) Histogram outlining the change in contact length determined in (H)–(I). Data are expressed as means ± SEM. ns, p > 0.05; *p < 0.05; **p < 0.01; ***p < 0.001; ****p < 0.0001.
Figure 6.
Figure 6.. FAs regulate mitochondrion-LD and mitochondrion-ER-LD contacts regardless of metabolic state
(A) Representative confocal microscopy images of mitochondria and LDs in AML12 cells in fed, fasting, fed plus 250 mM oleate, or fasting plus 250 mM oleate in the medium. (B) DiAna plug-in colocalization determined from images in (A), quantifying the number of MITO-LD, MAM-MITO, and MAM-LD contacts as determined by the DiAna plug-in. (C) Surface contact length between mitochondria and LDs in the fed and fasted state. (D) Histogram outlining the change in contact length determined in (C). (E) Quantification of SPLICS by total mean intensity per cell. n = 6–8 images with 12–16 cells per condition. (F) Surface contact length between SPLICS and mitochondria in the fed and fasted state as determined by the DiAna plug-in in FUJI. (G) Histogram outlining the change in contact length determined in (F). (H) Quantification of surface contact length between SPLICS and LDs in fed and fasted states. (I) Histogram outlining the change in contact length determined in (H). ns, p > 0.05; *p < 0.05; **p < 0.01; ***p < 0.001; ****p < 0.0001.
Figure 7.
Figure 7.. CM and PDM-MAM have unique proteomes that impact mitochondrial function
(A) Cellular compartment annotation of the entire proteomics dataset, both MAM subpopulations, as determined by GO analysis: cellular component. (B) Pie charts summarizing the proteomics dataset in bona fide mitochondria, ER proteins, mitochondrion-associated proteins, wrapped ER mitochondrial (WAM) proteins, Golgi apparatus vesicular transport, and ESCRT/peroxisomes. (C) Volcano plot summarizing the changes in the proteome of CM-MAM and PDM-MAM isolated from livers of overnight-fasted mice (n = 4 MAM fractions isolated from independent mice). Blue indicates proteins that were enriched in the PDM-MAM fractions, while yellow indicates CM-MAM-enriched proteins. Significance was determined using non-parametric quantitative analysis in Scaffold; permutation tests between groups with Benjamini-Hochberg correction (p < 0.006). (D) Left: hierarchical clustering of proteins significantly different between PDM-MAM and CM-MAM across replicate fractions (threshold for clustered proteins was determined by significance between groups). Right: proteins were further grouped using k-means statistics, breaking the PDM-MAM and CM-MAM significant genes into 10 protein clusters. The clustered proteins were mapped to specific metabolic pathways using Panther classification overrepresentation testing. (E) Heatmap of lipid incorporation proteins clustered around the GO term with the highest abundance of proteins increased in the PDM-MAM fraction. (F) Schematic of CM and CM-MAM that depicts pathways with proteins significantly upregulated. (G) Schematic of PDM and PDM-MAM that depicts pathways with proteins significantly upregulated. (H) Quantification of FA oxidation from PDM and CM fractions treated with DMSO or 2-APB or clotrimazole (MAM decoupling compounds). n = 5 from 2 different mitochondrial isolations. (I–L) Quantification of FA incorporation from PDM and CM promoted storage. Fractions were treated with DMSO, 2-APB, or clotrimazole. Data are expressed as means ± SEM. ns, p > 0.05; *p < 0.05; **p < 0.01; ***p < 0.001; ****p < 0.0001.

Similar articles

Cited by

References

    1. Henne M (2019). And three’s a party: lysosomes, lipid droplets, and the ER in lipid trafficking and cell homeostasis. Curr. Opin. Cell Biol. 59, 40–49. 10.1016/j.ceb.2019.02.011. - DOI - PubMed
    1. Kramer DA, Quiroga AD, Lian J, Fahlman RP, and Lehner R (2018). Fasting and refeeding induces changes in the mouse hepatic lipid droplet proteome. J. Proteomics 181, 213–224. 10.1016/j.jprot.2018.04.024. - DOI - PubMed
    1. Sadh K, Rai P, and Mallik R (2017). Feeding-fasting dependent recruitment of membrane microdomain proteins to lipid droplets purified from the liver. PLoS One 12, e0183022. 10.1371/journal.pone.0183022. - DOI - PMC - PubMed
    1. Wang J, Fang N, Xiong J, Du Y, Cao Y, and Ji WK (2021). An ESCRT-dependent step in fatty acid transfer from lipid droplets to mitochondria through VPS13D-TSG101 interactions. Nat. Commun. 12, 1252. 10.1038/s41467-021-21525-5. - DOI - PMC - PubMed
    1. Rambold AS, Cohen S, and Lippincott-Schwartz J (2015). Fatty acid trafficking in starved cells: regulation by lipid droplet lipolysis, autophagy, and mitochondrial fusion dynamics. Dev. Cell 32, 678–692. 10.1016/j.devcel.2015.01.029. - DOI - PMC - PubMed

Publication types