. 2023 Apr;131(4):47016.
doi: 10.1289/EHP10986. Epub 2023 Apr 27.

Assessing the Influence of Climate on the Spatial Pattern of West Nile Virus Incidence in the United States

Affiliations

Assessing the Influence of Climate on the Spatial Pattern of West Nile Virus Incidence in the United States

Morgan E Gorris et al. Environ Health Perspect. 2023 Apr.

Abstract

Background: West Nile virus (WNV) is the leading cause of mosquito-borne disease in humans in the United States. Since the introduction of the disease in 1999, incidence levels have stabilized in many regions, allowing for analysis of climate conditions that shape the spatial structure of disease incidence.

Objectives: Our goal was to identify the seasonal climate variables that influence the spatial extent and magnitude of WNV incidence in humans.

Methods: We developed a predictive model of contemporary mean annual WNV incidence using U.S. county-level case reports from 2005 to 2019 and seasonally averaged climate variables. We used a random forest model that had an out-of-sample model performance of R2=0.61.

Results: Our model accurately captured the V-shaped area of higher WNV incidence that extends from states on the Canadian border south through the middle of the Great Plains. It also captured a region of moderate WNV incidence in the southern Mississippi Valley. The highest levels of WNV incidence were in regions with dry and cold winters and wet and mild summers. The random forest model classified counties with average winter precipitation levels <23.3mm/month as having incidence levels over 11 times greater than those of counties that are wetter. Among the climate predictors, winter precipitation, fall precipitation, and winter temperature were the three most important predictive variables.

Discussion: We consider which aspects of the WNV transmission cycle climate conditions may benefit the most and argued that dry and cold winters are climate conditions optimal for the mosquito species key to amplifying WNV transmission. Our statistical model may be useful in projecting shifts in WNV risk in response to climate change. https://doi.org/10.1289/EHP10986.


Figures
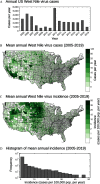
Figure 1a is a bar graph titled Annual United States West Nile virus cases, plotting cases per year, ranging from 0 to 6000 in increments of 1000 (y-axis) across year, ranging from 2005 to 2019 (x-axis). Figure 1b is a map of the United States, depicting the county-level map of the number of mean annual West Nile virus cases averaged from 2005 to 2019. A scale depicts the cases per year ranges from 0 to 1 in increments of 1, 1 to 5 in increments of 4, 5 to 25 in increments of 5, 25 to 50 in increments of 25, 50 to 125 in increments of 75. Figure 1c is a map of the United States, depicting the country-level map of the West Nile virus mean annual incidence averaged from 2005 to 2019. A scale depicts the incidence (cases per 100000 population per year) ranges from 0 to 2 in increments of 1, 2 to 5 in increments of 3, 5 to 15 in increments of 5, 15 to 35 in increments of 10, and 35 to 55 in increments of 20. Figure 1d is a histogram of county-level mean annual West Nile virus incidence, averaged from 2005 to 2019, plotting frequency, on a log-scale axis ranging from 1 to 10 to 100 to 1000 to 10000 (y-axis) across incidence (cases per 100000 population per year), ranging from 0 to 50 in increments of 10 (x-axis).
Figure 1.
Total number of cases and mean spatial pattern of WNV in the United States during the period 2005–2019, including (A) a time series of WNV cases for the contiguous United States derived from data compiled by the U.S. Centers for Disease Control and Prevention for the sum of neuroinvasive and non-neuroinvasive cases; (B) a county-level map of the number of mean annual WNV cases averaged from 2005–2019; (C) a county-level map of mean annual incidence (cases per 100,000 population per year) derived from the case data shown in panel (B) and annual, county-level U.S. Census population estimates; and (D) the frequency distribution of mean annual incidence across the 3,108 counties in the United States. See Excel Table S1, S2, and S3 for corresponding numerical data. Graphs and maps were created in Python (version 3.7.6), using package “Basemap” (version 1.2.0), and “matplotlib” (version 3.1.3). We edited our figures for layout in Adobe Illustrator 2022. Note: WNV, West Nile virus.
Figures 2a to 2d, each has a set of one scatterplot and one histogram titled December, January, February; March, April, May; June, July, August; September, October, November, plotting number of counties, ranging from 0 to 600 in increments of 200 and incidence (cases per 100000 population per year), ranging from 0 to 60 in increments of 10 (y-axis) across precipitation (millimeter per month), ranging from 0 to 250 in increments of 50 (x-axis), respectively.
Figure 2.
Incidence and histograms of the county number of WNV cases as a function of precipitation. Four seasonal intervals are shown: (A) winter (DJF), (B) spring (MAM), (C) summer (JJA), and (D) fall (SON). In each histogram, the number of counties was aggregated in 10-mm/month precipitation bins. Mean annual incidence and mean monthly precipitation variables during the period 2005–2019 were used to create the plots. See Excel Table S3 for corresponding numerical data. Surface air temperature and precipitation data are from the Precipitation elevation Regressions on Independent Slopes Model (PRISM). West Nile virus case data is provided by the U.S. Centers for Disease Control and Prevention. Note: DJF, December, January, February; JJA, June, July, August; MAM, March, April, May; SON, September, October, November; WNV, West Nile virus.
Figures 3a to 3d, each has a set of one scatterplot and one histogram titled December, January, February; March, April, May; June, July, August; September, October, November, plotting number of counties, ranging from 0 to 600 in increments of 200 and incidence (cases per 100000 population per year), ranging from 0 to 60 in increments of 10 (y-axis) across temperature (degree Celsius), ranging from negative 14 to 22 in increments of 4; negative 2 to 26 in increments of 2; 10 to 34 in increments of 2; and 2 to 26 in increments of 2 (x-axis), respectively.
Figure 3.
Incidence and histograms of county number as a function of air temperature. Four seasonal intervals are shown: (A) winter (DJF), (B) spring (MAM), (C) summer (JJA), and (D) fall (SON). In each histogram, the number of counties was aggregated in 2°C temperature bins. Mean annual incidence and mean surface air temperature during the period 2005–2019 were used to create these plots. See Excel Table S3 for corresponding numerical data. Surface air temperature and precipitation data are from the Precipitation elevation Regressions on Independent Slopes Model (PRISM). WNV case data is provided by the U.S. Centers for Disease Control and Prevention. Note: DJF, December, January, February; JJA, June, July, August; MAM, March, April, May; SON, September, October, November; WNV, West Nile virus.
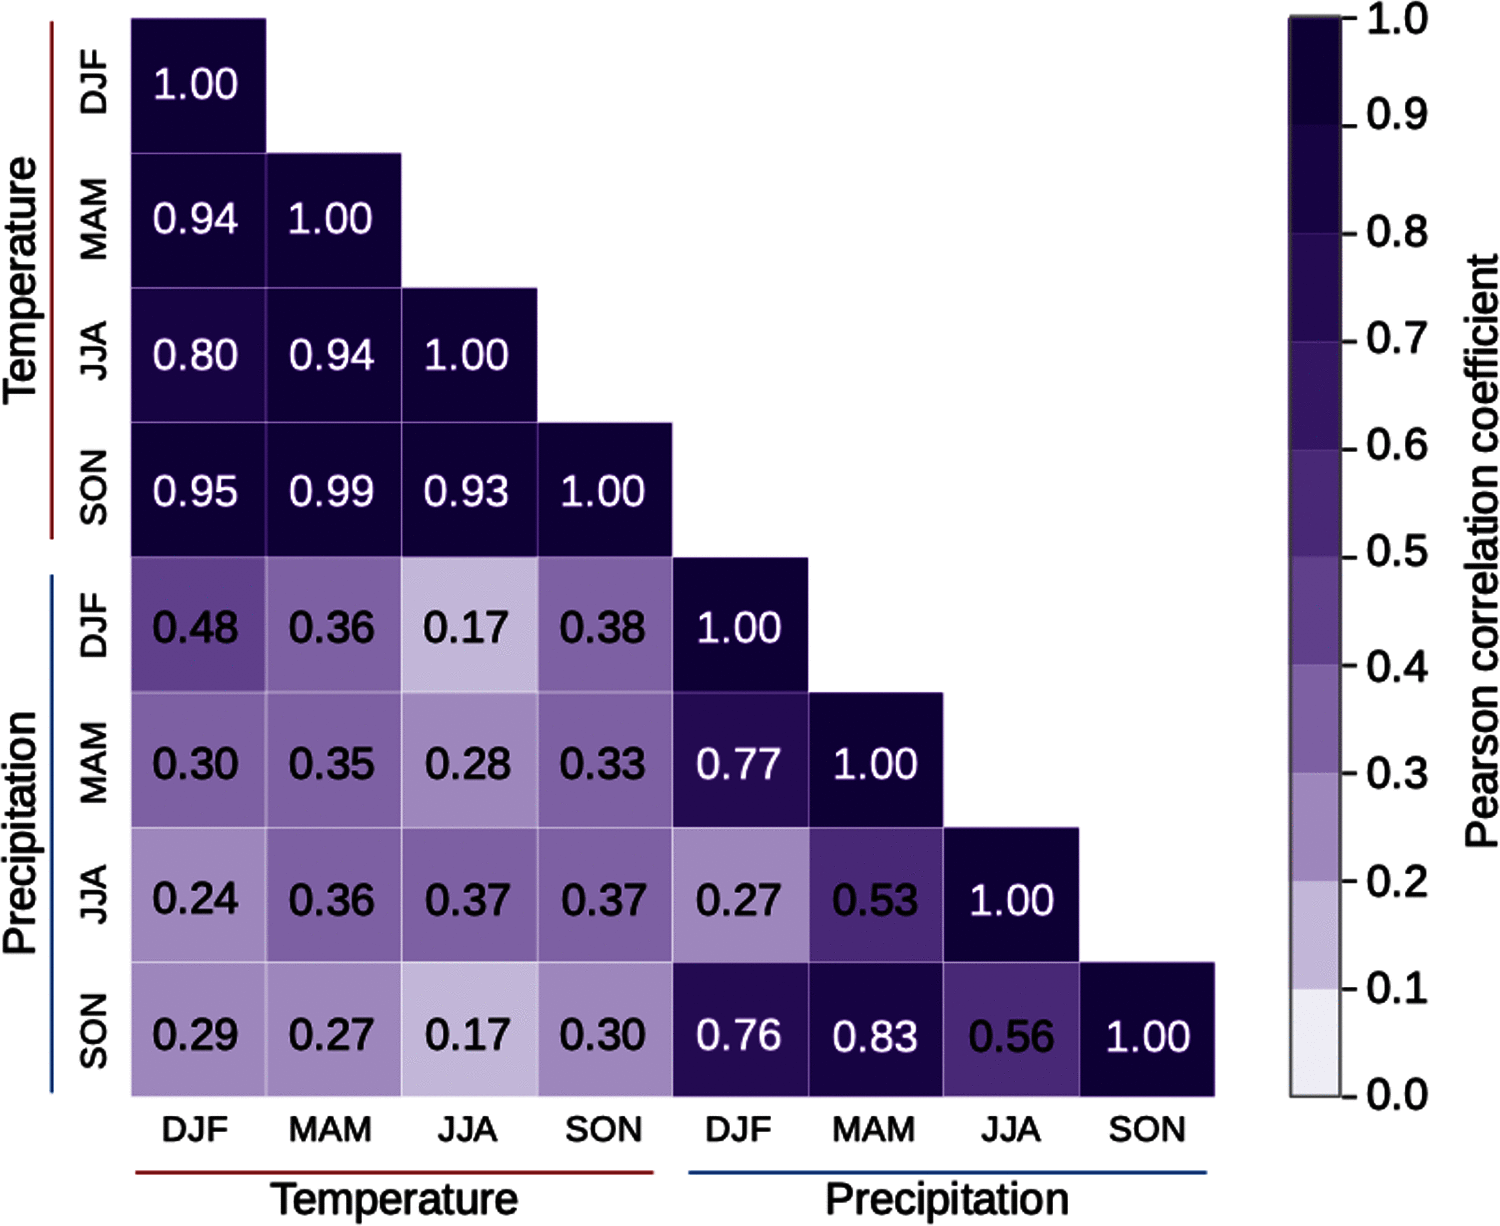
Figure 4 is a spatial correlation matrix displays eight rows, namely, December, January, February; March, April, May; June, July, August; September, October, November under Temperature; December, January, February; March, April, May; June, July, August; September, October, November under Precipitation across eight columns, namely, December, January, February; March, April, May; June, July, August; September, October, November under Temperature; December, January, February; March, April, May; June, July, August; September, October, November under Precipitation. A scale depicts Pearson correlation coefficient range from 0.0 to 1.0 in increments of 0.1.
Figure 4.
A spatial correlation matrix between the eight seasonal climate variables across all counties in the contiguous United States. The matrix displays the Pearson correlation coefficients between each pair of predictor variables. Each predictor variable consisted of a vector with 3,108 elements, with each element representing the mean climate condition for a single county. Surface air temperature and precipitation data are from the Precipitation elevation Regressions on Independent Slopes Model (PRISM). Note: DJF, December, January, February; JJA, June, July, August; MAM, March, April, May; SON, September, October, November.
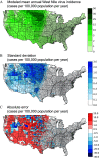
Figure 5a is a map of the United States of America, depicting the modeled mean for the annual West Nile virus incidence predicted by the random forest model in that each county displays the average of the 500 iterations of out-of-sample testing data. A scale ranges from 0 to 2 in increments of 1, 5 to 25 in increments of 5, 25 to 35 in increments of 10. Figure 5b is a map of the United States of America, depicting the standard deviation (cases per 100000 population per year) across those 500 iterations. A scale ranges from 0.0 to 0.5 in increments of 0.1 and 0.5 to 1.0 in increments of 0.5, and 1.0 to 3.0 in increments of 1.0. Figure 5c is a map of the United States of America, depicting the absolute error (cases per 100000 population per year) from observed West Nile virus incidence levels from 2005 to 2019. A scale ranges from negative 40.0 to negative 10.0 in increments of 10, negative 10.0 to negative 5.0 in increments of 5.0, negative 5.0 to negative 1.0 in increments of 4.0, negative 1.0 to 1.0 in increments of 0.5, 1.0 to 5.0 in increments of 4.0, 5.0 to 10.0 in increments of 5.0, and 10.0 to 20.0 in increments of 10.0.
Figure 5.
A map of (A) modeled mean annual WNV incidence predicted by the RF model where each county is the average of the 500 iterations of out-of-sample testing data, (B) the standard deviation across those 500 iterations, and (C) the absolute error from observed WNV incidence levels (2005–2019). All are in units of cases per 100,000 population per year. See Table S3 for corresponding numerical data. Analyses were performed in R (version 3.6.1; R Development Core Team), maps were created in Python (version 3.7.6), using package “Basemap” (version 1.2.0) and “matplotlib” (version 3.1.3). We edited our figures for layout in Adobe Illustrator 2022. Note: RF, random forest; WNV, West Nile virus.
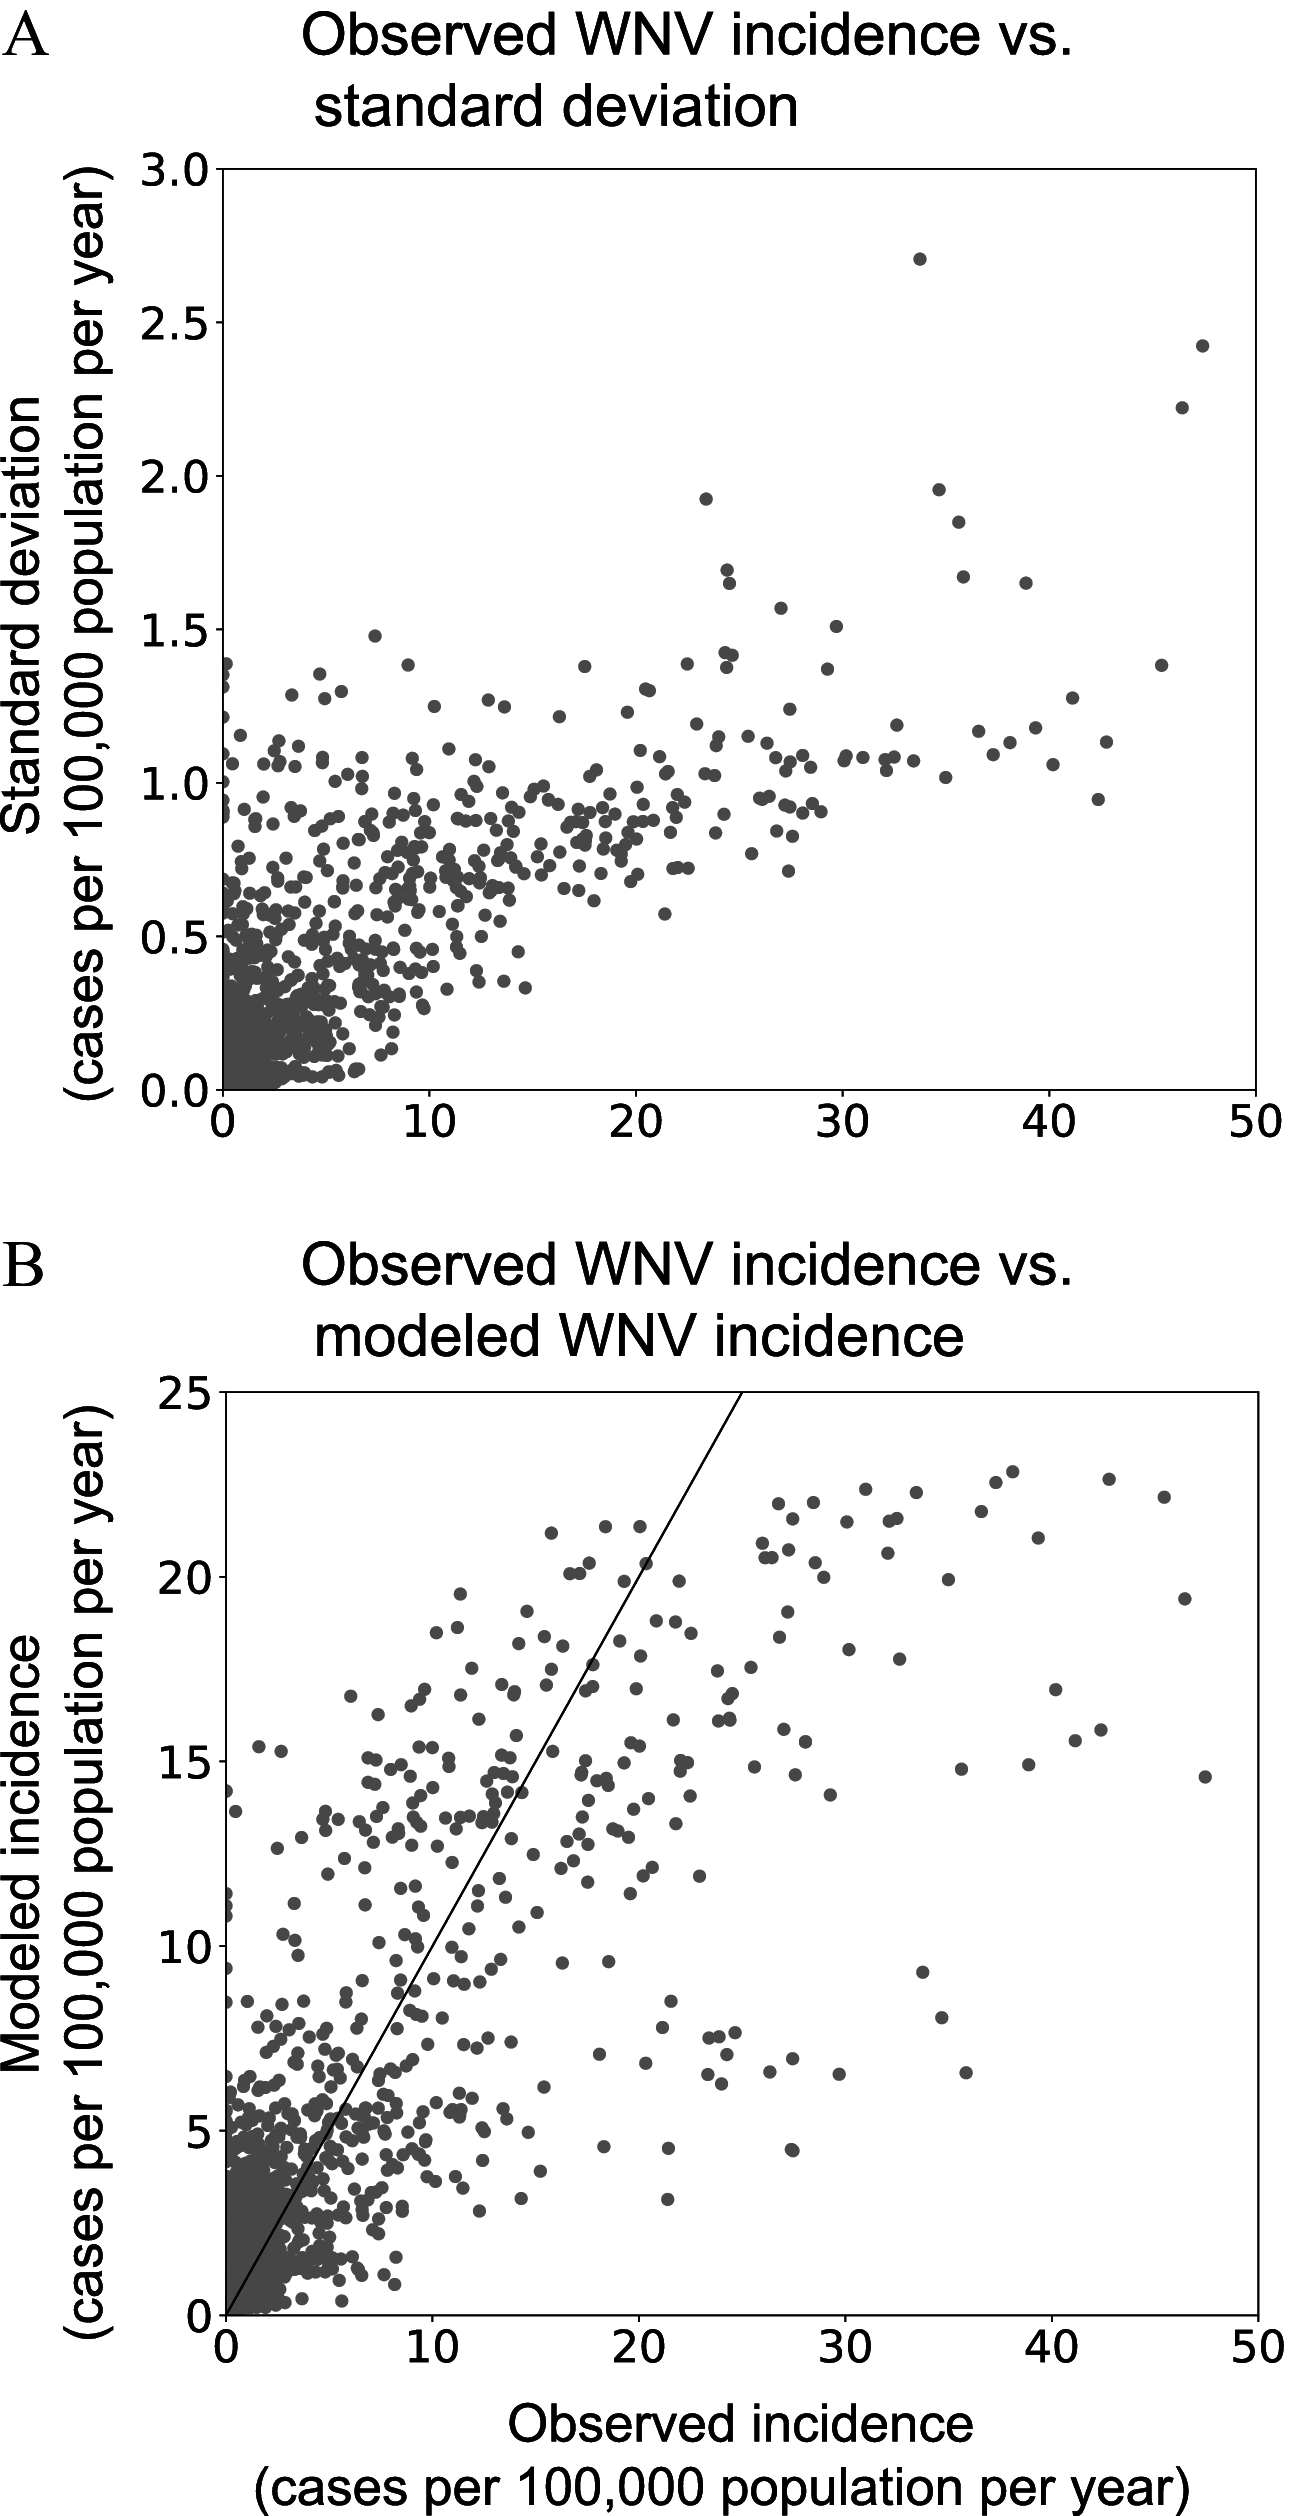
Figures 6a and 6b are scatterplots titled Observed West Nile virus incidence versus the standard deviation and Observed West Nile virus incidence versus modeled West Nile virus incidence, plotting Standard deviation (cases per 100000 population per year), ranging from 0.0 to 3.0 in increments of 0.5 and Modeled incidence (cases per 100000 population per year), ranging from 0 to 25 in increments of 5 (y-axis) across observed incidence (cases per 100000 population per year), ranging from 0 to 50 in increments of 10 (x-axis), respectively.
Figure 6.
RF model performance plots showing county-level values for (A) observed WNV incidence vs. the standard deviation among the 500 model iterations and (B) observed WNV incidence vs. the modeled WNV incidence (2005–2019). Each dot represents one of the 3,108 counties in the contiguous United States. A 1-to-1 line was added as a guide to (B). See Table S3 for corresponding numerical data. Note: RF, random forest; WNV, West Nile virus.
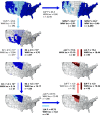
Figure 7 is a set of seven maps of the United States of America, depicting the summary regression tree with county-level conditional climate splits that is created from the mean random forest predictions. On the top-left, the map depicts that 496 counties have mean annual precipitation in December, January, and February of less than 23.3 millimeters per month and have an average West Nile virus incidence of 9.19 cases per 100000 people per year. On the top-left, the map also depicts that 2610 counties have mean annual precipitation in December, January, and February that is greater than or equal to 23.3 millimeters per month and have an average West Nile virus incidence of 0.80 cases per 100000 people per year. On the top-right, the map depicts the secondary outcome for counties that have greater than or equal to 23.3 milimeters per month of precipitation in December, January, and February. On the top-right, the map depicts that 360 counties have mean annual precipitation in September, October, and November of less than 65.7 millimeters per month and have an average West Nile virus incidence of 2.91 cases per 100000 people per year; this is a terminal node. On the top-right, the map depicts that 2250 counties have mean annual precipitation in September, October, and November greater than or equal to 65.7 millimeters per month and have an average West Nile virus incidence of 0.46 cases per 100000 population per year, and this is a terminal node. Below, on the left, the map depicts that 277 counties have mean annual precipitation in Eigenvectors 2 less than 6.9 times 10 and begin superscript negative 4 end superscript, and the average West Nile virus incidence is equal to 12.84 cases per 100000 people per year. On the right, there were 221 counties that have mean annual precipitation in Eigenvectors 2 greater than or equal to 6.9 times 10 begin superscript negative 4 end superscript and an average West Nile virus incidence equal to 4.70 cases per 100000 population per year. Below, on the left, the map depicts that 41 counties have mean annual precipitation in Eigenvectors 2 less than 1.0 times 10 begin superscript negative 6 end superscript and an average West Nile virus incidence equal to 5.14 cases per 100000 population per year. On the right, there were 236 counties that have mean annual precipitation in Eigenvectors 2 greater than or equal to 1.0 times 10 begin superscript negative 6 end superscript and an average West Nile virus incidence equal to 14.17 cases per 100000 population per year. Below, on top, the map depicts that 200 counties have mean annual precipitation in June, July, and August greater than or equal to 49.73 millimeters per month and have an average West Nile virus incidence of 15.35 cases per 100000 people per year. At the bottom, there were 36 counties with mean annual precipitation in June, July, and August less than 49.73 millimeters per month and an average West Nile virus incidence of 7.63 cases per 100000 population per year. At the bottom-right, on the left, the map depicts that 102 counties have a mean annual temperature in December, January, and February that is less than 6.0 and have an average West Nile virus incidence of 17.29 cases per 100000 people per year. On the right, there are 98 counties with mean annual temperatures in December, January, and February that are greater than or equal to negative 6.0 and have an average West Nile virus incidence of 13.34 cases per 100000 people per year. Above, on the left, the map depicts that 22 counties have a mean annual temperature in June, July, and August that is less than 19.6 and have an average West Nile virus incidence of 13.10 cases per 100000 people per year. On the right, there are 80 counties with a mean annual temperature in June, July, and August that is greater than or equal to 19.6 and an average West Nile virus incidence of 18.44 cases per 100000 people per year.
Figure 7.
The summary regression tree showing county-level conditional climate splits, created from the mean RF predictions. Precipitation (P) has units of millimeters/month and air temperature (T) has units of °C. Eigenvectors are denoted by E, where 1, 2, or 3 is the corresponding column number in the eigenvector matrix. The seasons are partitioned into winter (DJF), spring (MAM), summer (JJA), and fall (SON). WNV incidence (WNV Inc) is in units of cases per 100,000 population per year. The number of counties that fall into each division is denoted by n. Terminal nodes are in bold font. Note: Maps were created in Python (version 3.7.6), using package “Basemap” (version 1.2.0) and “matplotlib” (version 3.1.3). We edited our figures for layout in Adobe Illustrator 2022. DJF, December, January, February; JJA, June, July, August; MAM, March, April, May; RF, random forest; SON, September, October, November; WNV, West Nile virus.

Comment in

References

    1. U.S. CDC (U.S. Centers for Disease Control and Prevention). 2022. West Nile Virus. https://www.cdc.gov/westnile/index.html [accessed 15 January 2022].
    1. U.S. CDC. 2018. West Nile Virus, Symptoms, Diagnosis, & Treatment. https://www.cdc.gov/westnile/symptoms/index.html [accessed 15 January 2022].
    1. U.S. CDC. 2021. Final Cumulative Maps & Data for 1999–2021. https://www.cdc.gov/westnile/statsmaps/cumMapsData.html [accessed 15 January 2022].
    1. Hayes EB, Komar N, Nasci RS, Montgomery SP, O’Leary DR, Campbell GL. 2005. Epidemiology and transmission dynamics of West Nile virus disease. Emerg Infect Dis 11(8):1167–1173, PMID: , 10.3201/eid1108.050289a. - DOI - PMC - PubMed
    1. Chuang TW, Wimberly MC. 2012. Remote sensing of climatic anomalies and West Nile virus incidence in the northern Great Plains of the United States. PLoS One 7(10):e46882, PMID: , 10.1371/journal.pone.0046882. - DOI - PMC - PubMed

Publication types