

Modeling the Climatic Suitability of COVID-19 Cases in Brazil
- PMID: 37104323
- PMCID: PMC10142792
- DOI: 10.3390/tropicalmed8040198
Modeling the Climatic Suitability of COVID-19 Cases in Brazil
Abstract
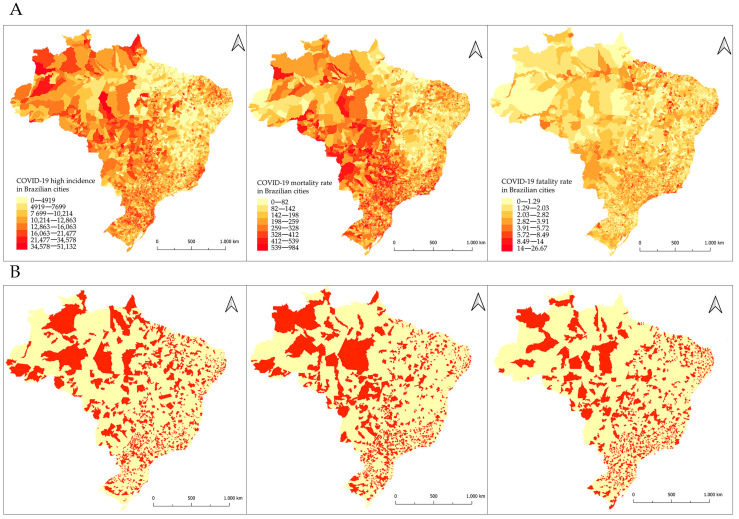
Studies have shown that climate may affect the distribution of coronavirus disease (COVID-19) and its incidence and fatality rates. Here, we applied an ensemble niche modeling approach to project the climatic suitability of COVID-19 cases in Brazil. We estimated the cumulative incidence, mortality rate, and fatality rate of COVID-19 between 2020 and 2021. Seven statistical algorithms (MAXENT, MARS, RF, FDA, CTA, GAM, and GLM) were selected to model the climate suitability for COVID-19 cases from diverse climate data, including temperature, precipitation, and humidity. The annual temperature range and precipitation seasonality showed a relatively high contribution to the models, partially explaining the distribution of COVID-19 cases in Brazil based on the climatic suitability of the territory. We observed a high probability of climatic suitability for high incidence in the North and South regions and a high probability of mortality and fatality rates in the Midwest and Southeast regions. Despite the social, viral, and human aspects regulating COVID-19 cases and death distribution, we suggest that climate may play an important role as a co-factor in the spread of cases. In Brazil, there are regions with a high probability that climatic suitability will contribute to the high incidence and fatality rates of COVID-19 in 2020 and 2021.
Keywords: climate; coronavirus disease-19; humidity; precipitation; temperature.
Conflict of interest statement
The authors declare no conflict of interest.
Figures


References
-
- Johns Hopkins COVID-19 Dashboard by the Center for Systems Science and Engineering (CSSE) at Johns Hopkins University (JHU) [(accessed on 23 September 2021)]. Available online: https://coronavirus.jhu.edu/map.html.
-
- Worlddometer: Report Cases an Deaths by Country or Territory. [(accessed on 2 January 2023)]. Available online: https://www.worldometers.info/coronavirus/
-
- Brasil, Ministério da Saúde Boletim Epidemiológico Especial. Doença pelo Coronavírus COVID-19 em 2020. [(accessed on 3 January 2021)]; Available online: https://www.gov.br/saude/pt-br/centrais-de-conteudo/publicacoes/boletins....
-
- Auler A.C., Cássaro F.A.M., da Silva V.O., Pires L.F. Evidence that high temperatures and intermediate relative humidity might favor the spread of COVID-19 in tropical climate: A case study for the most affected Brazilian cities. Sci. Total Environ. 2020;729:139090. doi: 10.1016/j.scitotenv.2020.139090. - DOI - PMC - PubMed
Grants and funding
LinkOut - more resources
Full Text Sources
Miscellaneous
