. 2023 Apr 28;380(6643):eabn5856.
doi: 10.1126/science.abn5856. Epub 2023 Apr 28.

The contribution of historical processes to contemporary extinction risk in placental mammals

Collaborators, Affiliations

The contribution of historical processes to contemporary extinction risk in placental mammals

Aryn P Wilder et al. Science. .

Abstract

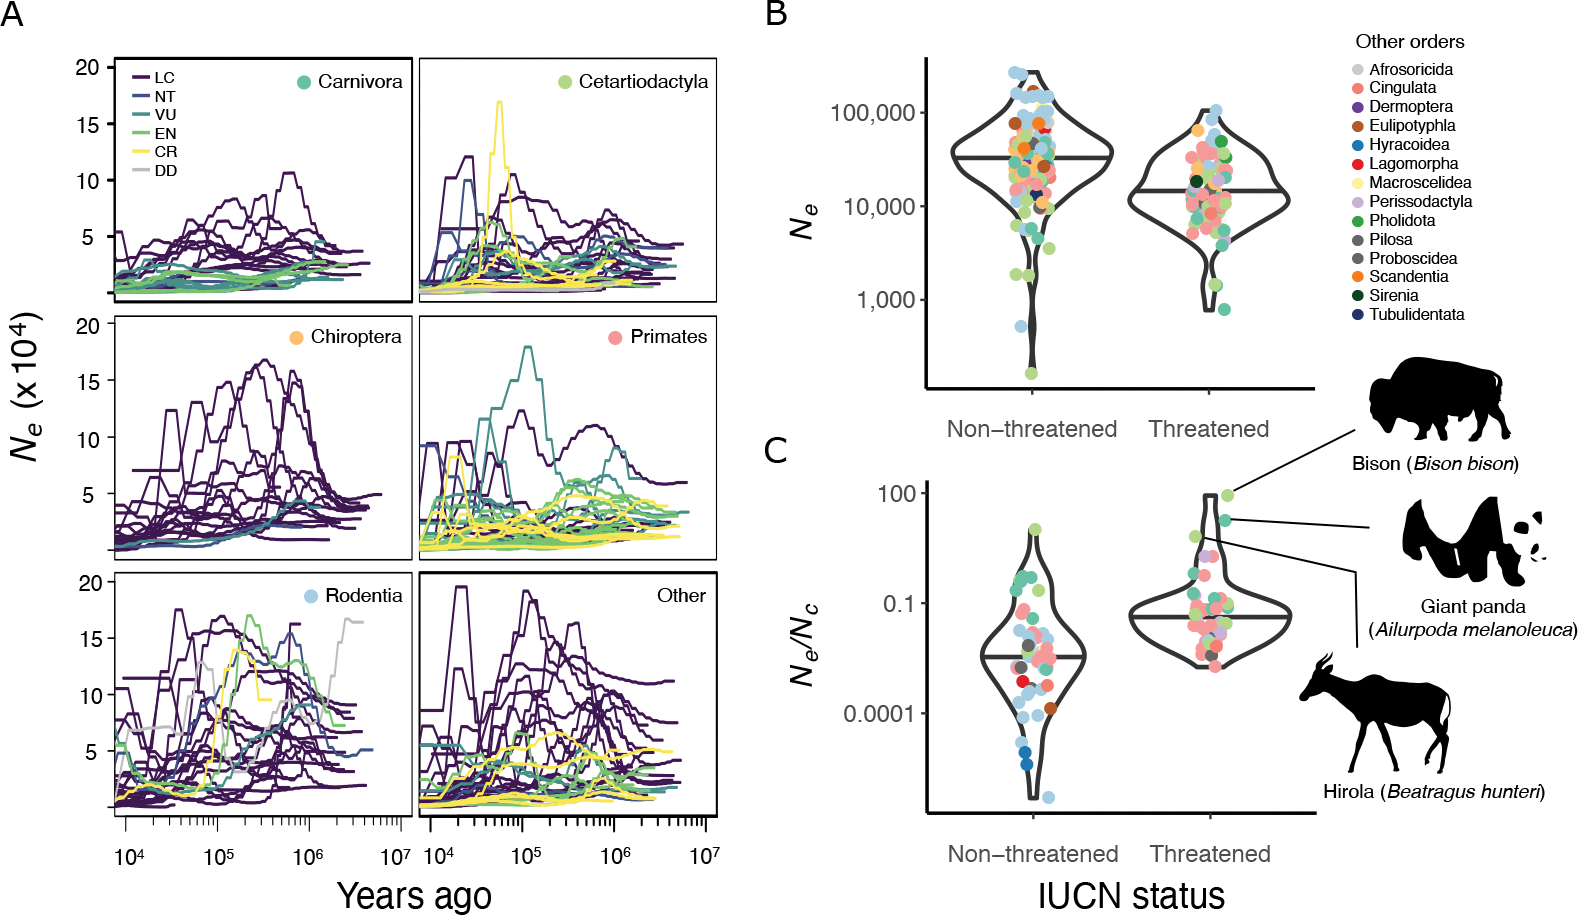
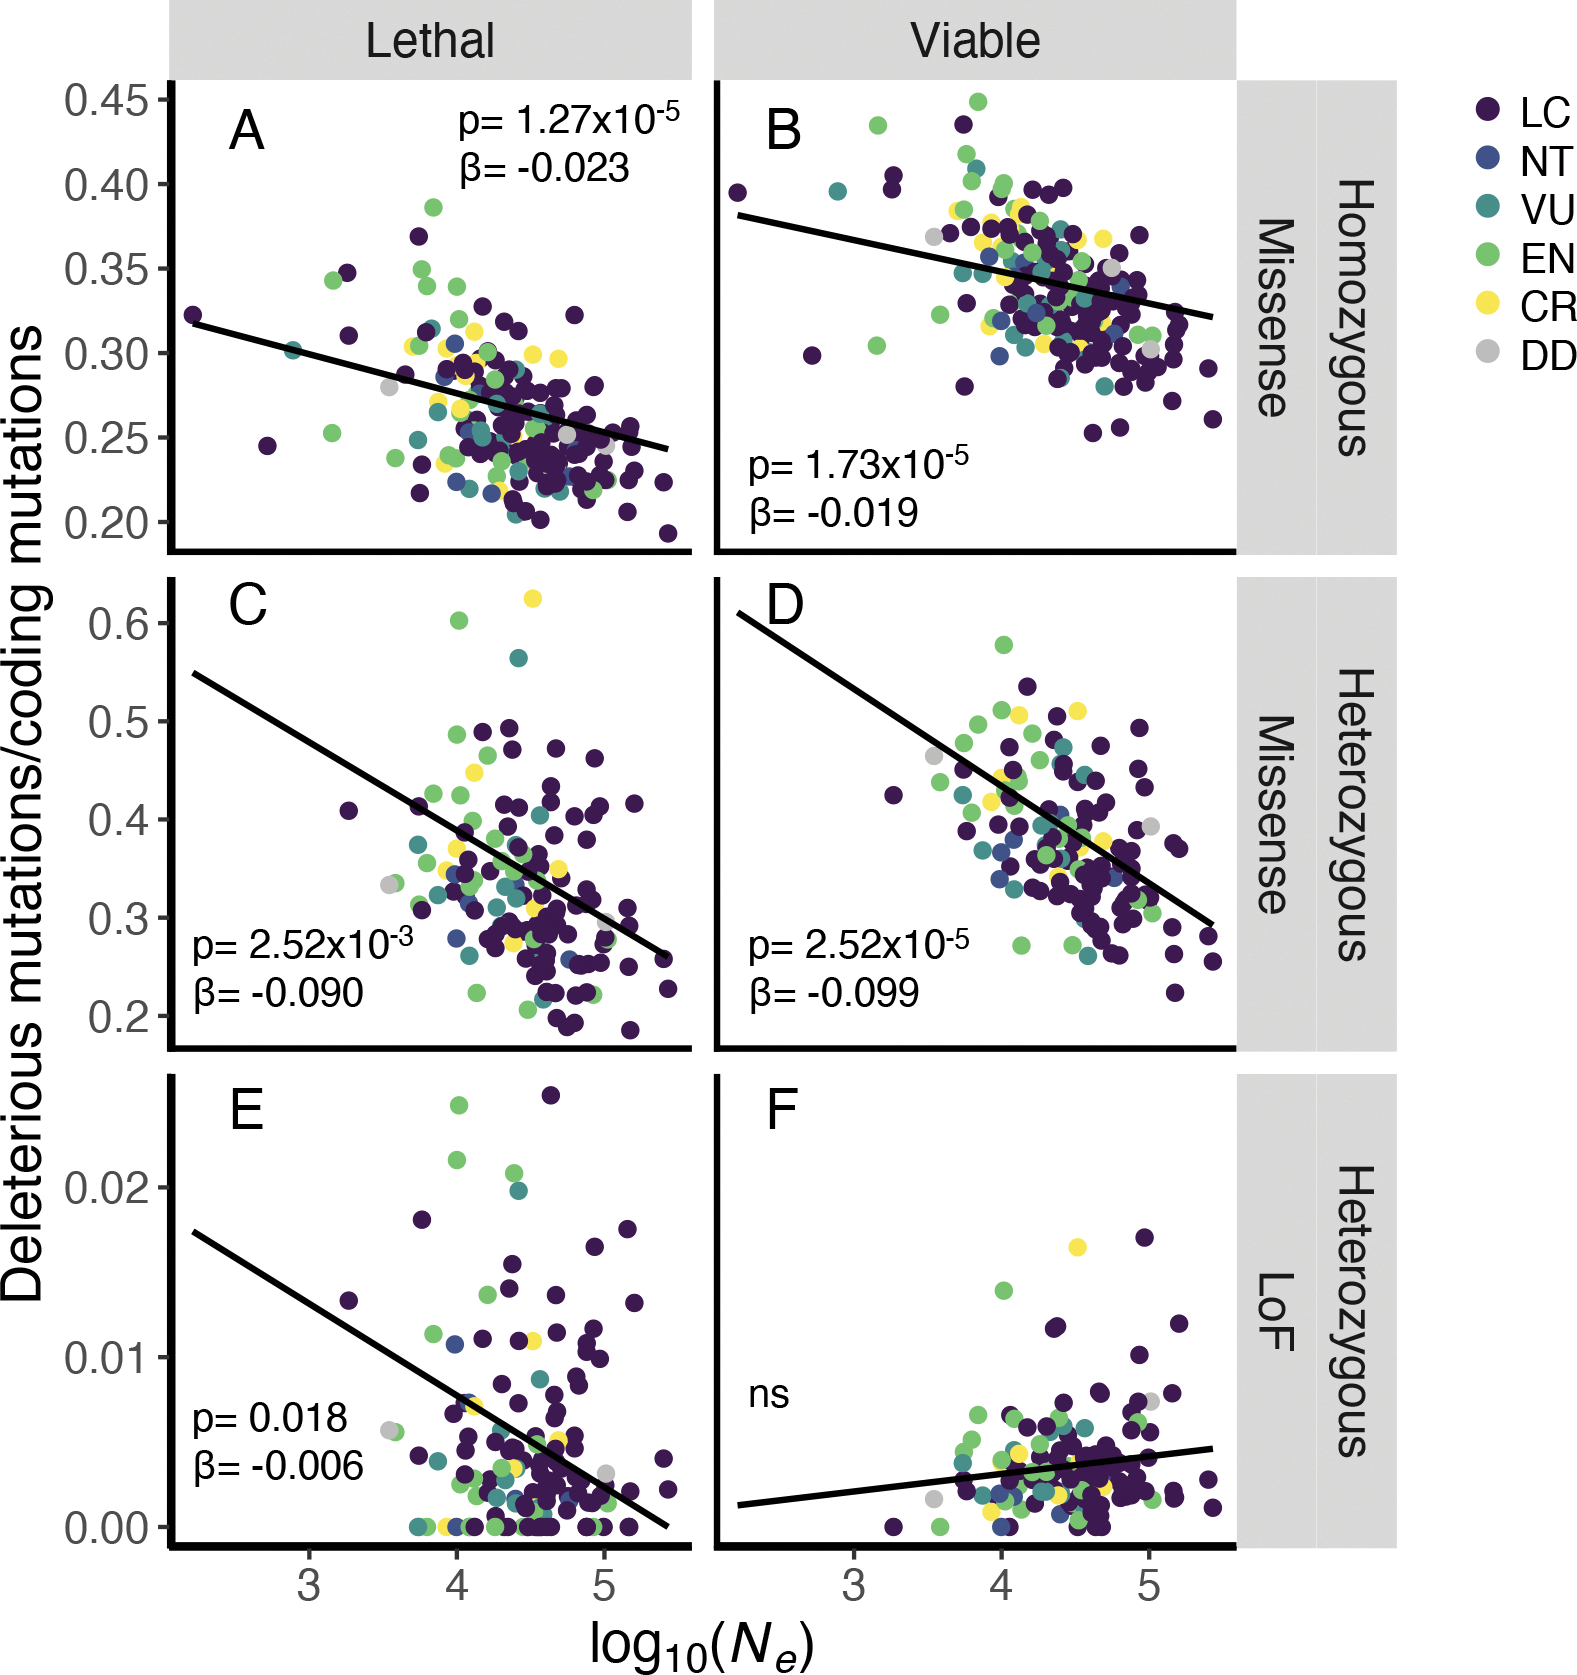
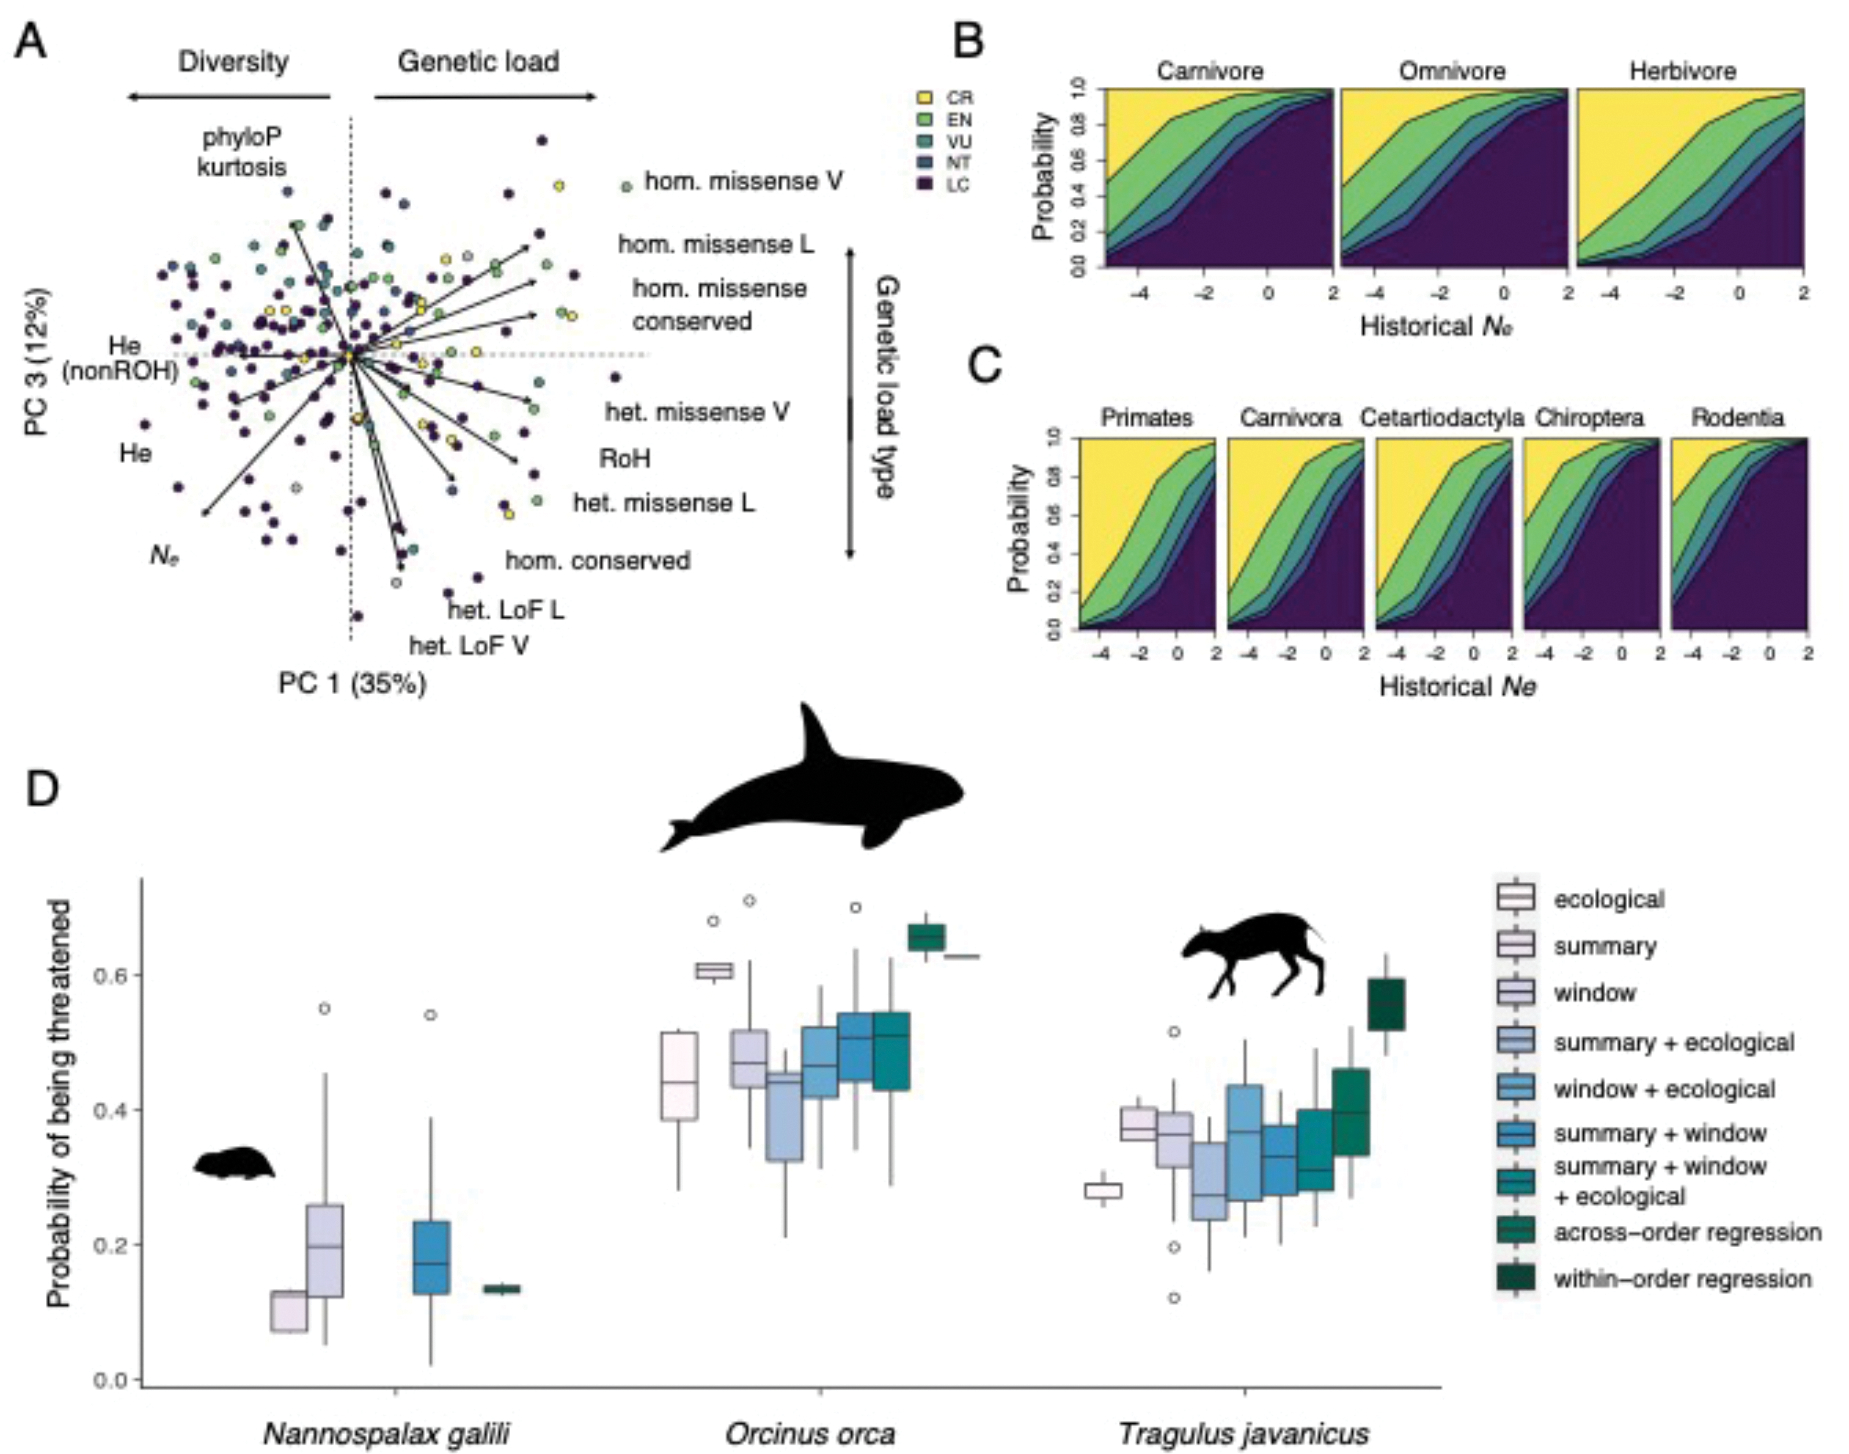
Species persistence can be influenced by the amount, type, and distribution of diversity across the genome, suggesting a potential relationship between historical demography and resilience. In this study, we surveyed genetic variation across single genomes of 240 mammals that compose the Zoonomia alignment to evaluate how historical effective population size (Ne) affects heterozygosity and deleterious genetic load and how these factors may contribute to extinction risk. We find that species with smaller historical Ne carry a proportionally larger burden of deleterious alleles owing to long-term accumulation and fixation of genetic load and have a higher risk of extinction. This suggests that historical demography can inform contemporary resilience. Models that included genomic data were predictive of species' conservation status, suggesting that, in the absence of adequate census or ecological data, genomic information may provide an initial risk assessment.


Conflict of interest statement

Competing interests:

Authors declare that they have no competing interests.

Figures

Fig. 1.
Fig. 1.. Demographic history across mammalian orders and IUCN Red List categories.
(A) Estimates of effective population sizes (Ne) over time displayed by taxonomic order. Lines represent individual species, colored by IUCN status (LC= Least Concern, NT=Near Threatened, VU=Vulnerable, EN=Endangered, CR=Critically Endangered, DD=Data Deficient). Colored dots correspond to the taxonomic order of species depicted in (B) and (C). For visualization, only species with Ne estimates under 200,000 for every time point are shown. (B) Harmonic mean Ne was significantly lower in threatened IUCN categories relative to non-threatened (phylolm, p<3.3e-5). (C) The ratio of historical Ne to contemporary census population size (Ne/Nc) can identify species with smaller Nc than expected from historical Ne (phylolm, p=0.012). Points in (B) and (C) show individual species, colored by taxonomic order.
Fig. 2.
Fig. 2.. Historically small populations have more deleterious genetic load in protein-coding genes.
Proportion of homozygous missense substitutions (A-B), heterozygous missense variants (C-D) and heterozygous loss-of-function variants (E-F) in genes as a function of historical Ne across species. Genes were classified by associated lethal or viable phenotypes in knockout mice. Proportions of heterozygous and homozygous missense mutations were negatively correlated with Ne (all p<0.052), whereas heterozygous loss-of-function alleles were not consistently correlated with Ne. Phylogenetically corrected p-values and coefficients (phylolm) are reported.
Fig. 3.
Fig. 3.. Prediction of conservation status of species using genomic information.
(A) Principal components (PCs) that significantly predict threatened status. PC1 describes heterozygosity, Ne and deleterious variation, and PC3 distinguishes types of deleterious variation. Loadings of genomic variables (arrows; table S3) are labeled as described in table S2 (L=IMPC lethal genes; V=IMPC viable genes). Points indicate species, colored by IUCN status as shown in (B). (B-C) Probability of assignment to IUCN categories by diet and scaled values of historical Ne (B), and by taxonomic order and historical Ne of species (C). Decreased historical Ne is consistently associated with increased risk, but the magnitude varies by diet and taxonomic order. (D) Conservation status predictions for three data deficient species using random forest models with window-based metrics (windows), ecological variables (ecological), and/or genome-wide summary variables (summary), and predictions from regression models within and across taxonomic orders. Nannospalax galili lacked ecological data and adequate within-order data, so only predictions from across-order regression and windows models are shown for this species.

References

    1. Barnosky AD, Matzke N, Tomiya S, Wogan GOU, Swartz B, Quental TB, Marshall C, McGuire JL, Lindsey EL, Maguire KC, Mersey B, Ferrer EA, Has the Earth’s sixth mass extinction already arrived? Nature. 471, 51–57 (2011). - PubMed
    1. Ceballos G, Ehrlich AH, Ehrlich PR, The Annihilation of Nature: Human Extinction of Birds and Mammals (JHU Press, 2015).
    1. Supple MA, Shapiro B, Conservation of biodiversity in the genomics era. Genome Biol. 19, 131 (2018). - PMC - PubMed
    1. Hansson B, Morales HE, van Oosterhout C, Comment on “Individual heterozygosity predicts translocation success in threatened desert tortoises.” Science. 372 (2021), p. eabh1105. - PubMed
    1. Hansson B, Westerberg L, On the correlation between heterozygosity and fitness in natural populations. Molecular Ecology. 11 (2002), pp. 2467–2474. - PubMed