. 2023 Apr 28;380(6643):eabn3107.
doi: 10.1126/science.abn3107. Epub 2023 Apr 28.

Integrating gene annotation with orthology inference at scale

Collaborators, Affiliations

Integrating gene annotation with orthology inference at scale

Bogdan M Kirilenko et al. Science. .

Abstract

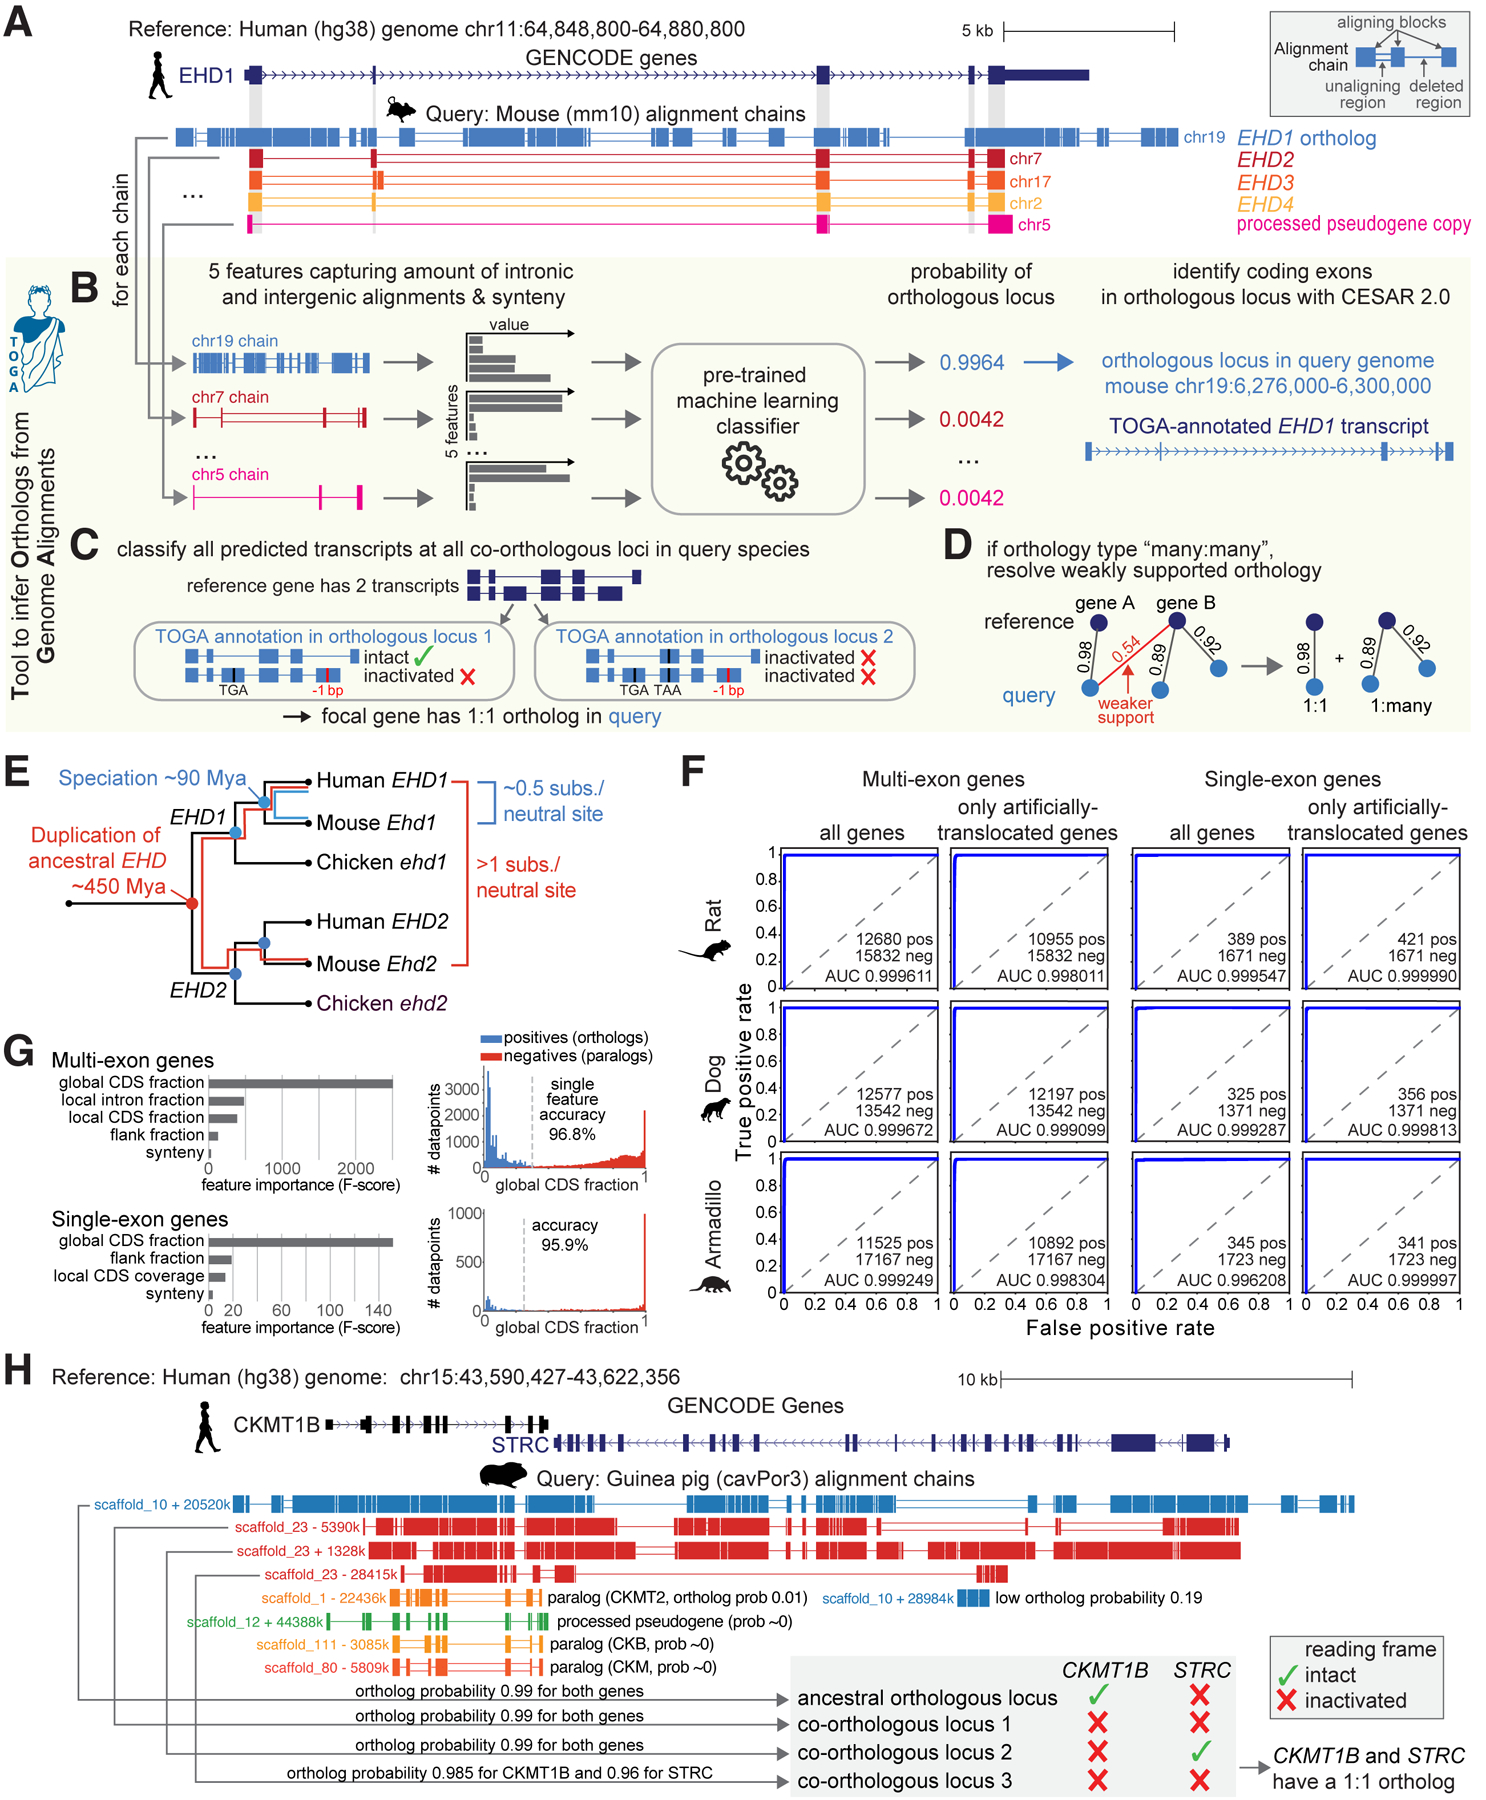
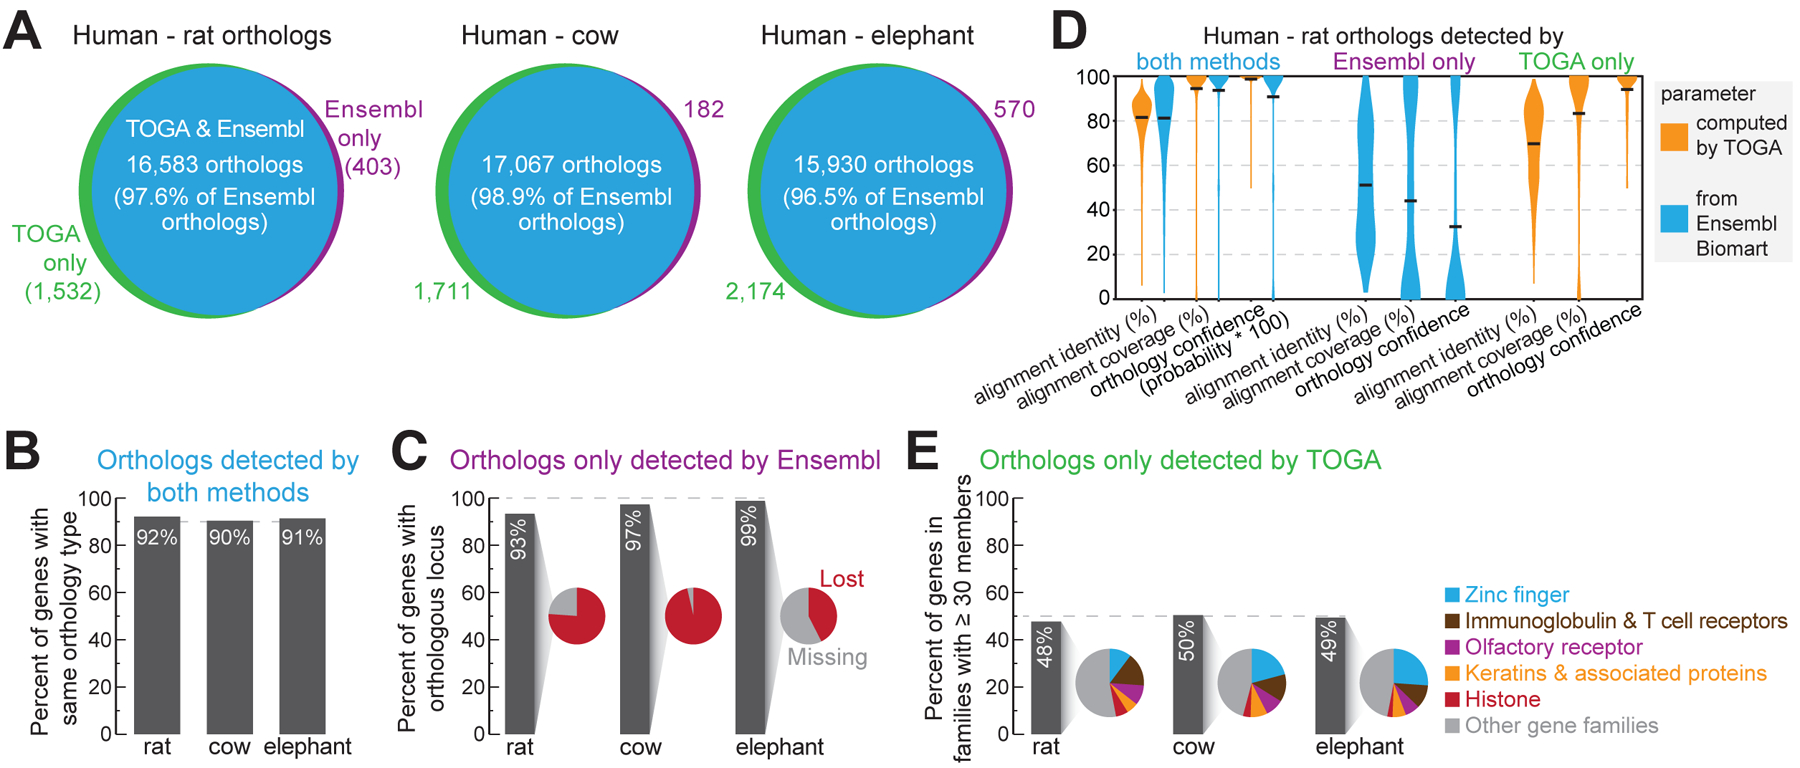
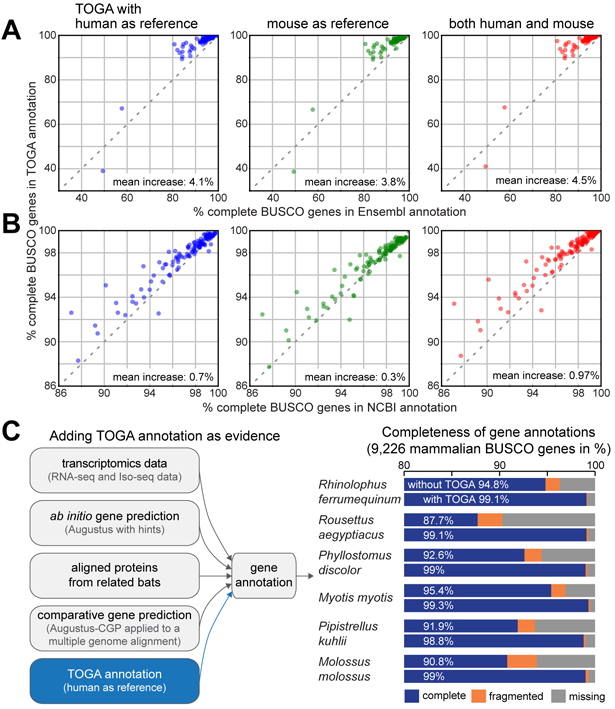
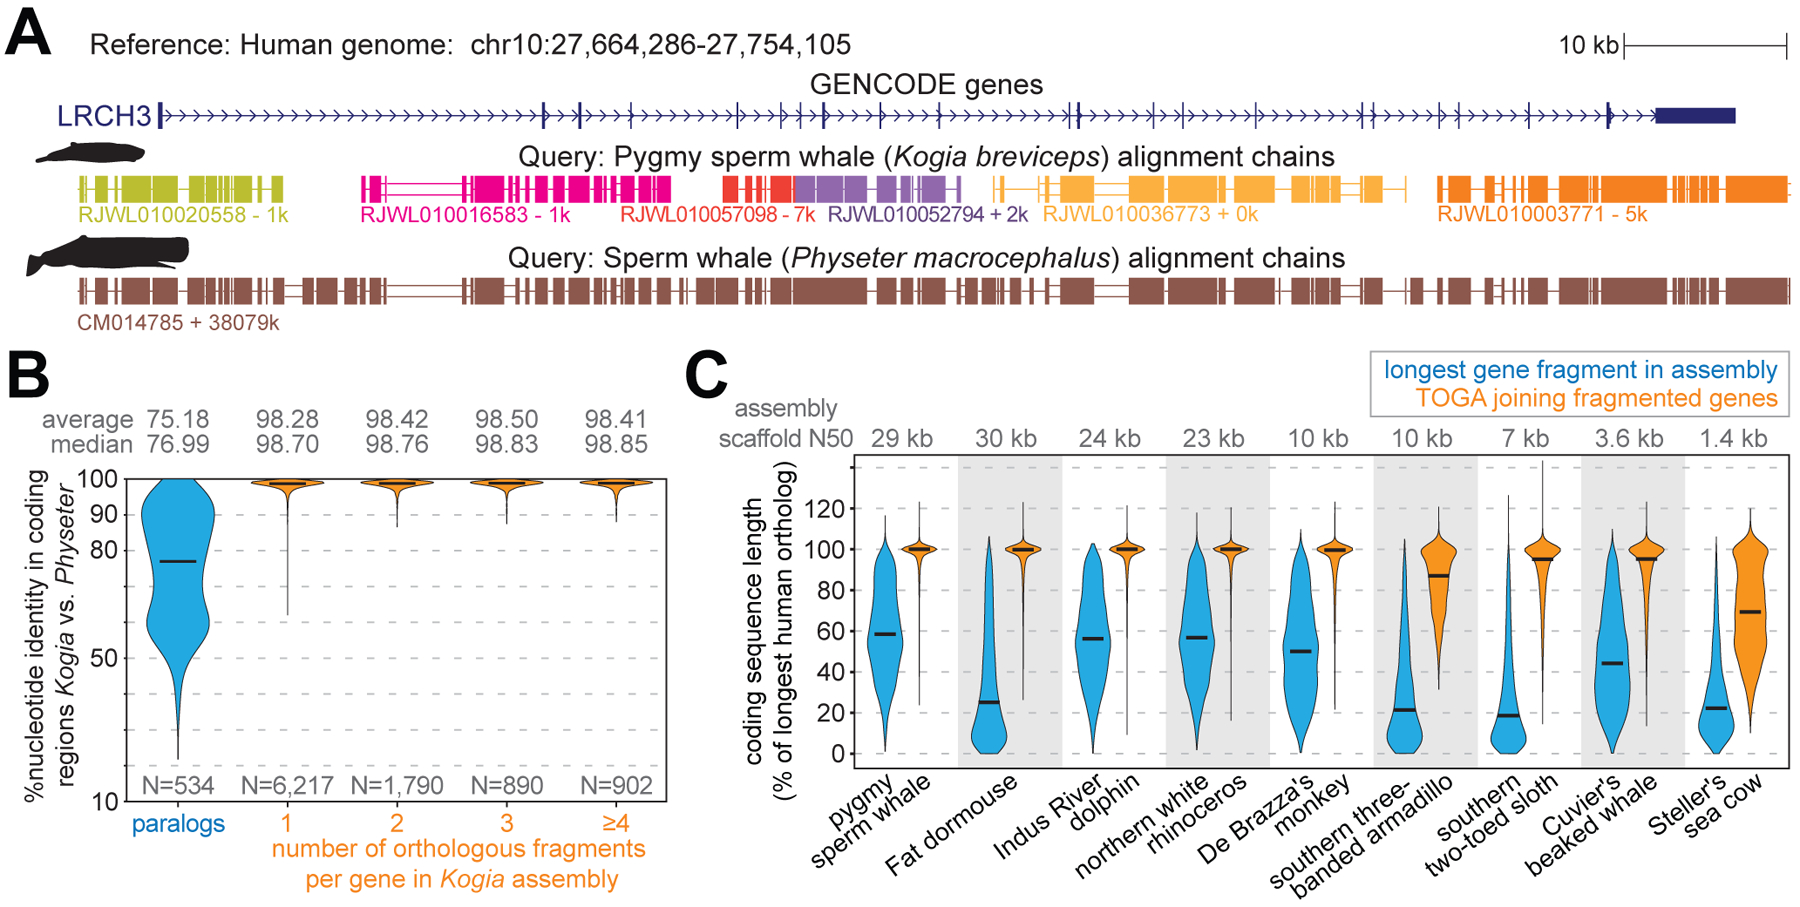
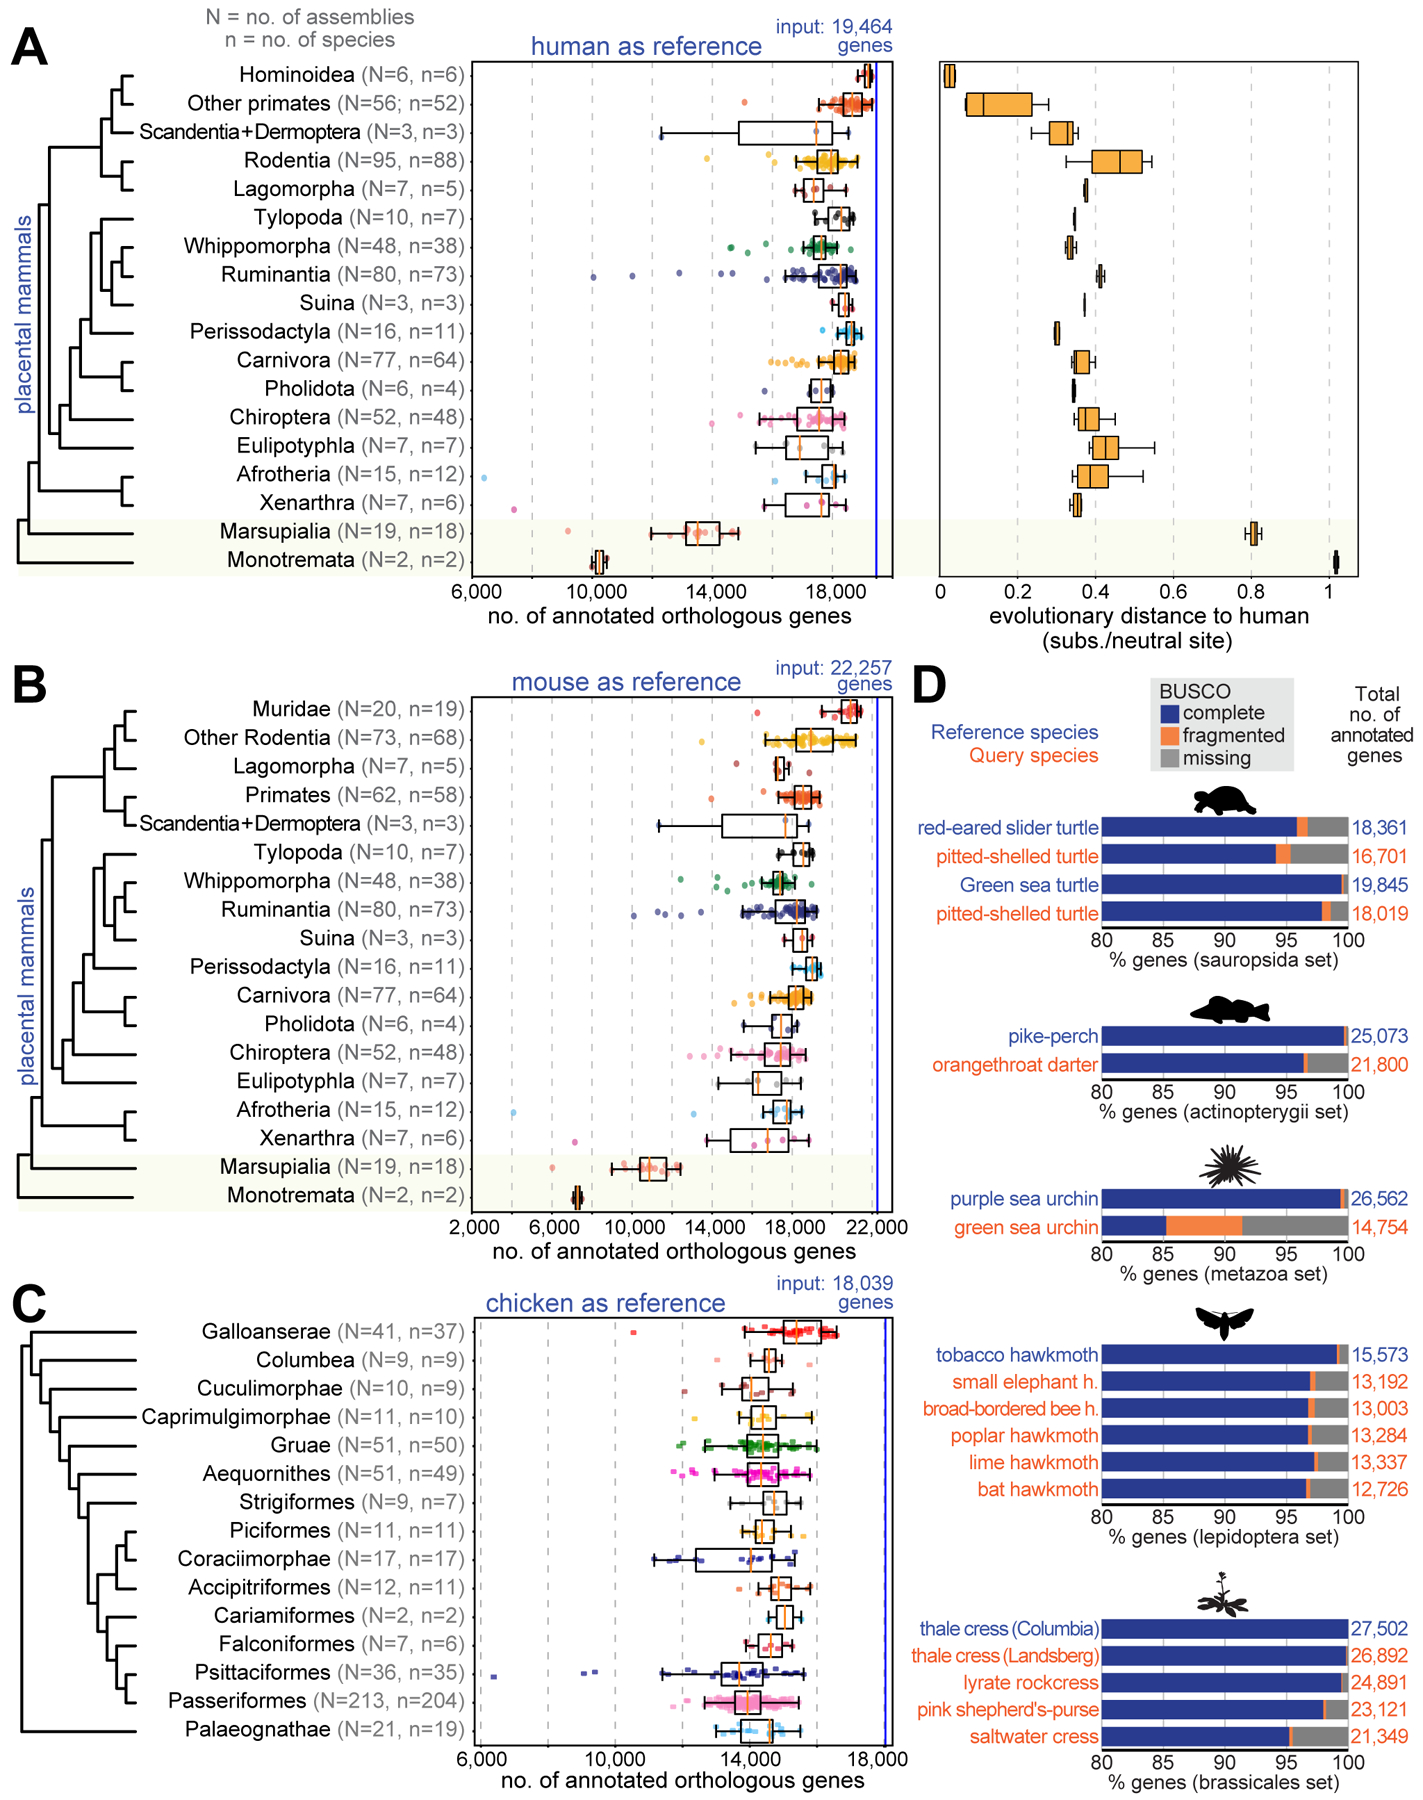
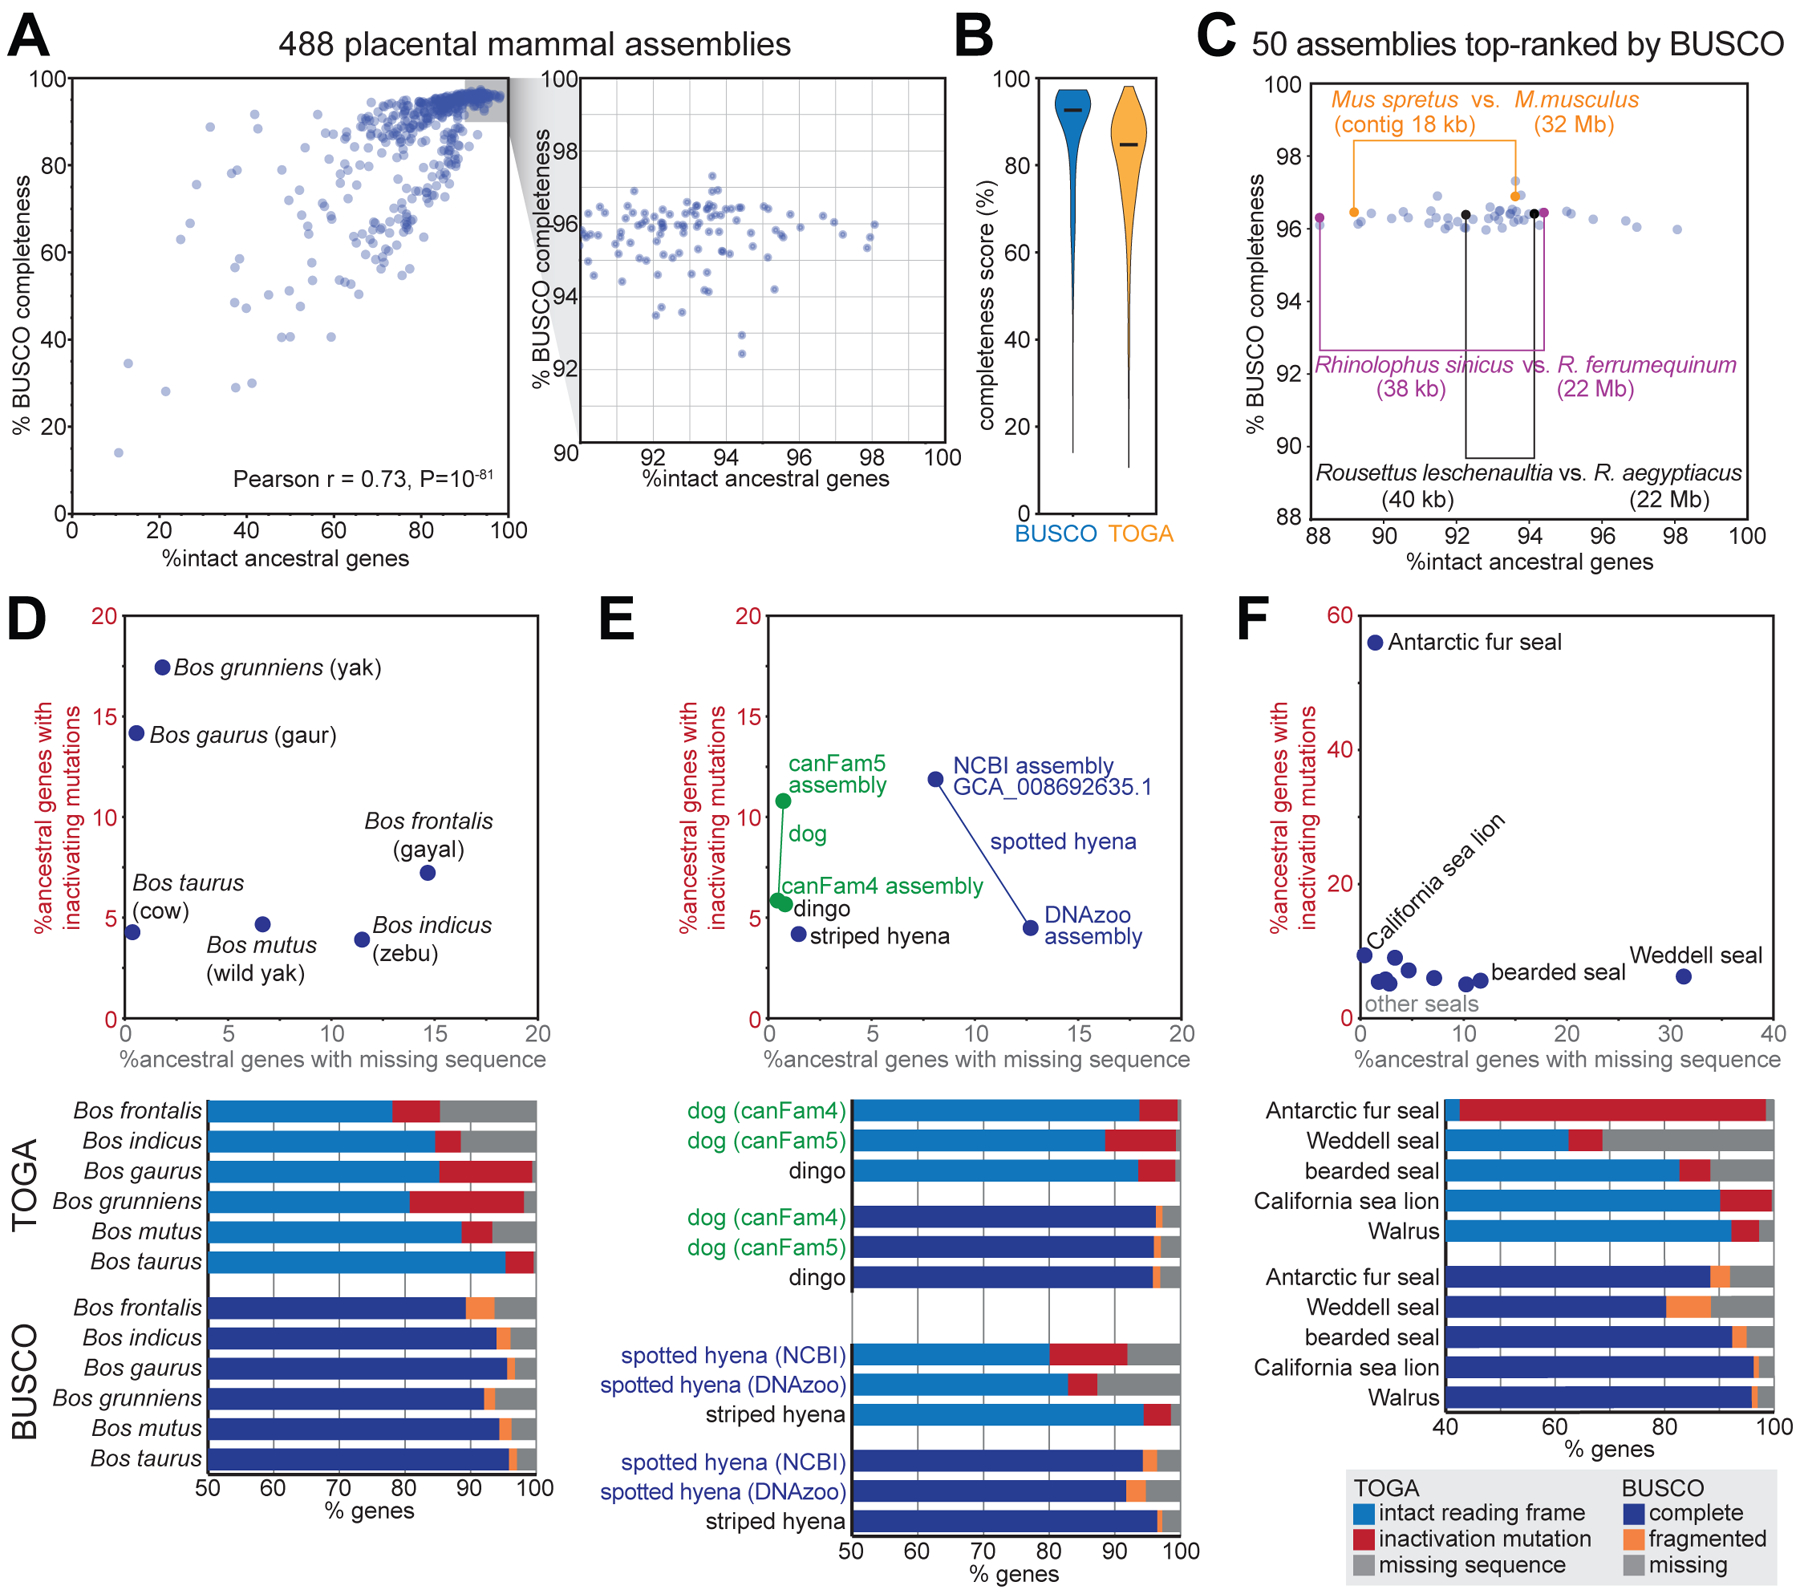
Annotating coding genes and inferring orthologs are two classical challenges in genomics and evolutionary biology that have traditionally been approached separately, limiting scalability. We present TOGA (Tool to infer Orthologs from Genome Alignments), a method that integrates structural gene annotation and orthology inference. TOGA implements a different paradigm to infer orthologous loci, improves ortholog detection and annotation of conserved genes compared with state-of-the-art methods, and handles even highly fragmented assemblies. TOGA scales to hundreds of genomes, which we demonstrate by applying it to 488 placental mammal and 501 bird assemblies, creating the largest comparative gene resources so far. Additionally, TOGA detects gene losses, enables selection screens, and automatically provides a superior measure of mammalian genome quality. TOGA is a powerful and scalable method to annotate and compare genes in the genomic era.


Conflict of interest statement

Competing interests: The authors declare no competing interests.

Figures

Fig. 1:
Fig. 1:. TOGA utilizes intronic and intergenic alignments to detect orthologous gene loci.
(A) UCSC genome browser view of the human EHD1 gene locus shows five alignment chains to mouse. Only the orthologous chr19 locus but not paralogous (chr7/17/2) and processed pseudogene (chr5) loci show intronic and intergenic alignments. (B-D) Illustration of the TOGA pipeline steps that identify orthologous loci, annotate and classify transcripts, and resolve weak orthology connections. (E) Evolutionary distance explains why only the orthologous EHD1 locus shows intronic and intergenic alignments. (F) Orthology detection performance shown as Receiver Operating Characteristics curves for single- and multi-exon genes as well as for genes that lack synteny due to deliberately-introduced translocations. (G) Feature importance for detecting orthologous genes and the distribution of the most important feature (“global CDS fraction”; proportion of coding exon alignments of all aligning chain blocks). (H) Importance of detecting all orthologous loci and determining reading frame intactness. The human STRC and CKMT1B locus is quadruplicated in guinea pig (top four chains). TOGA correctly recognizes all four co-orthologous loci. Despite the quadruplication, TOGA finds that only one copy of each gene encodes an intact reading frame and correctly infers a 1:1 orthology relationship.
Fig. 2:
Fig. 2:. TOGA improves ortholog detection.
(A) Ortholog overlap between Ensembl Compara and TOGA. (B) Percent of commonly-detected orthologs having the same orthology type. (C) Percent of orthologs only detected by Ensembl, for which TOGA detects an orthologous locus but classifies the gene as lost or missing. (D) Human-rat orthologs detected by both or only one method. Violin plots compare identity and coverage of coding region alignments and orthology confidence probabilities. Note that for orthologs only detected by TOGA, these features are not available on Ensembl Biomart, and vice versa. Horizontal black lines represent the mean. (E) Percent of orthologs only detected by TOGA that belong to gene families with ≥30 members. Pie charts show the proportion of the most frequent gene families.
Fig. 3:
Fig. 3:. TOGA improves annotation of conserved genes.
(A,B) Completeness of mammalian BUSCO genes in annotations generated by TOGA (Y-axis), Ensembl (X-axis in A) and the NCBI Eukaryotic Genome Annotation Pipeline (X-axis in B). Each dot represents one species. The set of 70 and 118 species in A and B overlaps but is not identical. (C) Gene evidence used to annotate six bat species. Adding TOGA as evidence increases annotation completeness of mammalian BUSCO genes by 3.9% to 11.4%.
Fig. 4:
Fig. 4:. TOGA accurately joins genes split in fragmented genome assemblies.
(A) The ortholog of human LRCH3 is split into six fragments (evident by six chains) in the highly-fragmented pygmy sperm whale (Kogia breviceps) assembly (27). Different chain colors represent different scaffolds. TOGA correctly detects and joins all six orthologous gene fragments. The highly-contiguous assembly of the closely related sperm whale (Physeter macrocephalus) (29), where LRCH3 is located on a single scaffold, shows a highly-similar alignment block structure. (B) Violin plots show the coding exon identity between Kogia breviceps and Physeter macrocephalus. Horizontal black lines represent the median. Fragmented orthologs joined by TOGA have an identity distribution highly-similar to orthologs already present on a single scaffold. (C) Violin plots compare the coding sequence length before (blue) and after joining split genes (orange). Length is relative to the longest transcript of the human ortholog. Codon insertions can increase the relative length to >100%.
Fig. 5:
Fig. 5:. Large-scale application of TOGA to hundreds of genomes.
(A) Human as reference. Left: Box plots with overlaid data points show the number of annotated orthologs. Non-placental mammals are highlighted with a yellow background. Right: Box plots showing evolutionary distances to human. (B) Mouse as the reference. Muridae are shown as a separate group. (C) TOGA with chicken as the reference, applied to 501 bird assemblies. (D) TOGA for other species using NCBI RefSeq annotations (21) as the reference. BUSCO gene completeness of the reference annotation provides an upper bound for the completeness of TOGA’s query annotation.
Fig. 6:
Fig. 6:. TOGA provides a superior measure of mammalian assembly quality.
(A) Comparison of the percent complete BUSCO genes and TOGA’s percent intact ancestral genes for 488 placental mammal assemblies. Each dot represents one assembly. (B) Violin plots of BUSCO’s and TOGA’s completeness values. Horizontal black lines represent the median. (C) BUSCO’s and TOGA’s completeness values for 50 assemblies that are top-ranked by BUSCO. Three pairs of closely related species are highlighted that have different assembly contiguity (contig N50) values and are distinguishable in terms of gene completeness by TOGA, but not by BUSCO. (D-F) TOGA distinguishes between genes with missing sequences and genes with inactivating mutations. This highlights assemblies with a higher incompleteness or base error rate that is often not detectable by the BUSCO metrics.

References

    1. Gabaldon T, Koonin EV, Functional and evolutionary implications of gene orthology. Nature reviews. Genetics 14, 360–366 (2013). - PMC - PubMed
    1. Kapli P, Yang Z, Telford MJ, Phylogenetic tree building in the genomic age. Nature reviews. Genetics 21, 428–444 (2020). - PubMed
    1. Altenhoff AM, Studer RA, Robinson-Rechavi M, Dessimoz C, Resolving the ortholog conjecture: orthologs tend to be weakly, but significantly, more similar in function than paralogs. PLoS computational biology 8, e1002514 (2012). - PMC - PubMed
    1. Huerta-Cepas J et al., Fast Genome-Wide Functional Annotation through Orthology Assignment by eggNOG-Mapper. Molecular biology and evolution 34, 2115–2122 (2017). - PMC - PubMed
    1. Sharma V et al., A genomics approach reveals insights into the importance of gene losses for mammalian adaptations. Nature communications 9, 1215 (2018). - PMC - PubMed