. 2023 Apr 28;380(6643):eabm7993.
doi: 10.1126/science.abm7993. Epub 2023 Apr 28.

Relating enhancer genetic variation across mammals to complex phenotypes using machine learning

Collaborators, Affiliations

Relating enhancer genetic variation across mammals to complex phenotypes using machine learning

Irene M Kaplow et al. Science. .

Abstract

Protein-coding differences between species often fail to explain phenotypic diversity, suggesting the involvement of genomic elements that regulate gene expression such as enhancers. Identifying associations between enhancers and phenotypes is challenging because enhancer activity can be tissue-dependent and functionally conserved despite low sequence conservation. We developed the Tissue-Aware Conservation Inference Toolkit (TACIT) to associate candidate enhancers with species' phenotypes using predictions from machine learning models trained on specific tissues. Applying TACIT to associate motor cortex and parvalbumin-positive interneuron enhancers with neurological phenotypes revealed dozens of enhancer-phenotype associations, including brain size-associated enhancers that interact with genes implicated in microcephaly or macrocephaly. TACIT provides a foundation for identifying enhancers associated with the evolution of any convergently evolved phenotype in any large group of species with aligned genomes.


Conflict of interest statement

Competing interests: E.K.K. is on the advisory board of Fauna Bio. All other authors declare that they have no competing interests.

Figures

Fig. 1.
Fig. 1.. Overview of TACIT.
We trained a machine learning model using sequences underlying candidate enhancers (indicated in dark red) and non-enhancers (not pictured) to predict enhancer activity in a tissue or cell type of interest. We used the model to predict enhancer activity (darker red arrows indicate higher predicted activity) in that tissue or cell type in hundreds of genomes (13). We associated our predictions with phenotypes using a phylogeny-aware regression and then quantified the significance of the association using an empirical P value. [All silhouettes are from PhyloPic, and the silhouette of Orcinus orca was created by Chris Huh (license: https://creativecommons.org/licenses/by-sa/3.0/) and was not modified (132)]
Fig. 2.
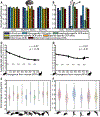
Fig. 2.. MultiSpeciesMotorCortexModel and MultiSpeciesPVModel performance.
(A and B) Area under the receiver operating characteristic curve (AUC), area under the negative predictive value-specificity curve (AUNPV-Spec.), and area under the precision-recall curve (AUPRC). Results are for the full test set, clade-specific OCRs and non-OCRs, and OCRs shared with another tissue/brain region/cell type (positive) versus tissue/brain region/cell type-specific OCRs in that other tissue/brain region/cell type (negative) [described in the “Detailed description of model performance figures” section of the supplementary materials (52)] for MultiSpeciesMotorCortexModel (A) and MultiSpeciesPVModel (B). Orths., orthologs. The ideal performance is 1, and the horizontal white bar indicates the performance that would be expected from a randomly guessing model, which is the fraction of examples in the minority class for AUNPV-Spec. and AUPRC. (The AUC from random guessing is 0.5.) (C and D) The negative relationship between the average house mouse OCR ortholog MultiSpeciesMotorCortexModel (C) and MultiSpeciesPVModel (D) predictions for Glires species and the time [millions of years ago (MYA)] at which each species diverged from house mouse, where each point corresponds to a different species. The dashed line is the average prediction for the negative test set across all species used to train the model. Prediction standard deviations for MultiSpeciesMotorCortexModel and MultiSpeciesPVModel are given in fig. S2, C and D, respectively. (E and F) Violin plots comparing the first principal component for the embeddings from the first fully connected layer of MultiSpeciesMotorCortexModel (E) and MultiSpeciesPVModel (F) for positives and negatives from each species as well as European rabbit and bottlenose dolphin orthologs of house mouse positives.
Fig. 3.
Fig. 3.. Heatmap of MultiSpeciesMotorCortexModel predictions for a subset of 1000 OCRs, clustered by OCR with predictions as features.
Predictions of OCR ortholog open chromatin are shown for 1000 randomly selected motor cortex OCRs with orthologs in at least 75% of species, with each row corresponding to one OCR and each column corresponding to one species. Predictions are shown on a white (closed) to red (open) scale, with missing (species, OCR) pairs shown in light gray. The OCRs (rows) are ordered according to the results of a hierarchical clustering with Ward’s minimum variance method, where the distance between two OCRs was defined as the cosine similarity of activity predictions in species for which both OCRs have usable orthologs (12). Species are ordered by their position in the phylogenetic tree; the approximate positions of species in selected clades are shown along the bottom, and illustrated species are listed in table S26, with the exception of the bat, which is an Egyptian fruit bat. Species colored black are those with data used in model training, and species colored dark gray are those for which we have only predicted open chromatin.
Fig. 4.
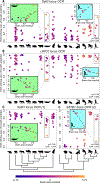
Fig. 4.. Examples of associations between predicted motor cortex OCR ortholog open chromatin and brain size residual.
(A to D) Each point represents an ortholog of the OCR in question in one species; species are grouped along the x axis by clade, as shown by the silhouettes and tree below (C) and (D) (table S26). Points are colored by brain size residual following the scale at the bottom of the figure. The permulations-based Benjamini-Hochberg q-values and the coefficient on the predicted open chromatin returned by phylolm are in the lower right of each panel. The hominoid and cetacean clades are highlighted by gray boxes in each panel, and scatterplots of predicted motor cortex open chromatin versus brain size residual for these clades are in the inset plots in each panel. Note that the lines in the inset plots are not based on the phylogenetic regression we used for TACIT, which we ran across all 222 Boreoeutherian mammals and not in specific clades, are for illustration purposes only. (A) Positive association between predicted motor cortex open chromatin and brain size residual for a motor cortex OCR in the Sall3 locus, chr18:81802310–81802951 (mm10). (B) Positive association between predicted motor cortex open chromatin and brain size residual for a motor cortex OCR in the Lrig1 locus, chr15:40082805–40083380 (mm10). [(C) and (D)] Negative association between predicted motor cortex open chromatin and brain size residual for two motor cortex OCRs in the SATB1 locus, chr17:52351209–52351928 (mm10) and chr2:174466184–174466517 (rheMac8), within Laurasiatheria and Euarchontoglires, respectively. The latter OCR has no orthologs in Lagomorpha, which is omitted from (D). Boreoeutherian mammal-wide panels are shown in fig. S15.
Fig. 5.
Fig. 5.. Examples of associations between predicted PV+ interneuron OCR ortholog open chromatin and brain size residual.
(A and B) Each point represents an ortholog of the OCR in question in one species; species are grouped along the x axis by clade, as shown by the silhouettes and tree below (table S26). Points are colored by brain size residual following the scale at the bottom of the figure. The permulations-based Benjamini-Hochberg q-values the coefficient and the predicted open chromatin returned by phylolm are in the lower right of each panel. Negative association within Euarchontoglires between predicted PV+ interneuron open chromatin and brain size residual of two PV+ interneuron OCRs in the Mocs2 locus, chr13:114757413–114757913 (mm10) (A) and chr13:114793237–114793737 (mm10) (B), respectively. The hominoid clade is highlighted by a gray box in each panel, and scatterplots of predicted PV+ interneuron open chromatin versus brain size residual in Hominoidea are in the inset plots. Note that the lines in the inset plots are for illustration purposes only and are not based on the phylogenetic regression we used for TACIT; we ran the phylogenetic regression across all Euarchontoglires and not in specific clades.
Fig. 6.
Fig. 6.. Associations between predicted PV+ interneuron and motor cortex OCR ortholog open chromatin and solitary living.
(A) Human WBS deletion region. The locations of the PV+ interneuron and motor cortex OCRs [(B) and (C)] near the gene GTF2IRD1 are in yellow and green, respectively. (B) Marginal negative association between predicted PV+ interneuron open chromatin and solitary living of a PV+ interneuron OCR near GTF2IRD1 and GTF2I, chr5:134485808–134486308 (mm10). (C) Negative association between predicted motor cortex open chromatin and solitary living of a motor cortex OCR near GTF2IRD1 and GTF2I, chr3:42408296–42408946 (rheMac8). In (B) and (C), each point represents an ortholog in one species; points are grouped along the x axis by the clade of the species represented, as shown by the silhouettes and tree below (C) (table S26). Points are colored to indicate solitary versus nonsolitary living following the key at the lower right. The permulations-based Benjamini-Hochberg q-value and the coefficient for the predicted open chromatin returned by phyloglm are shown in the lower right of (B) and (C).

References

    1. King MC, Wilson AC, Evolution at two levels in humans and chimpanzees. Science 188, 107–116 (1975). doi: 10.1126/science.1090005; pmid: 1090005 - DOI - PubMed
    1. Pfenning AR et al. , Convergent transcriptional specializations in the brains of humans and song-learning birds. Science 346, 1256846 (2014). doi: 10.1126/science.1256846; pmid: 25504733 - DOI - PMC - PubMed
    1. Fushan AA et al. , Gene expression defines natural changes in mammalian lifespan. Aging Cell 14, 352–365 (2015).doi: 10.1111/acel.12283; pmid: 25677554 - DOI - PMC - PubMed
    1. Wray GA, The evolutionary significance of cis-regulatory mutations. Nat. Rev. Genet 8, 206–216 (2007). doi: 10.1038/nrg2063; pmid: 17304246 - DOI - PubMed
    1. Villar D, Flicek P, Odom DT, Evolution of transcription factor binding in metazoans—mechanisms and functional implications. Nat. Rev. Genet 15, 221–233 (2014). doi: 10.1038/nrg3481; pmid: 24590227 - DOI - PMC - PubMed