. 2023 Jun 22;61(6):2200951.
doi: 10.1183/13993003.00951-2022. Print 2023 Jun.

Nicotine promotes e-cigarette vapour-induced lung inflammation and structural alterations

Affiliations

Nicotine promotes e-cigarette vapour-induced lung inflammation and structural alterations

Elsa T Roxlau et al. Eur Respir J. .

Abstract

Background: Electronic cigarette (e-cigarette) vapour is gaining popularity as an alternative to tobacco smoking and can induce acute lung injury. However, the specific role of nicotine in e-cigarette vapour and its long-term effects on the airways, lung parenchyma and vasculature remain unclear.

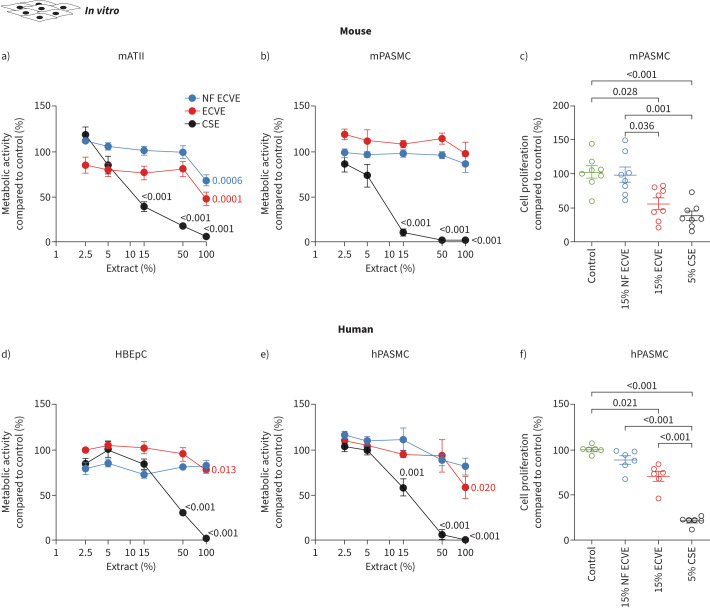
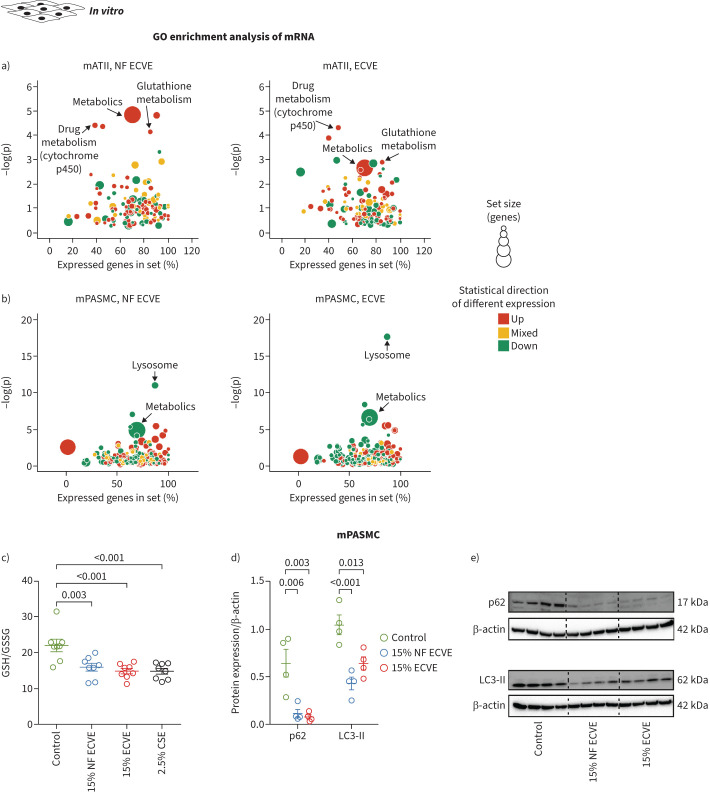
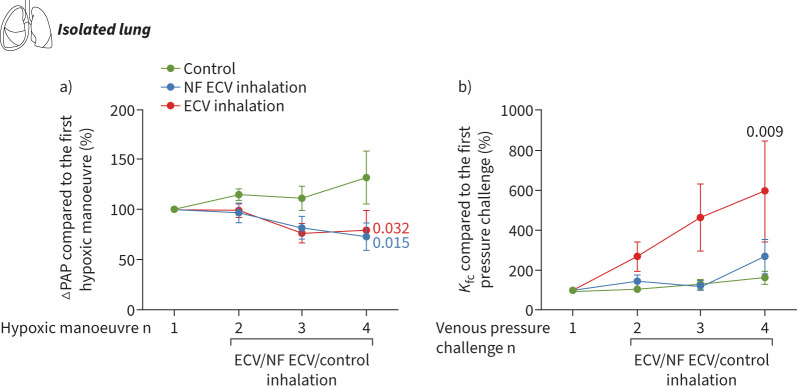
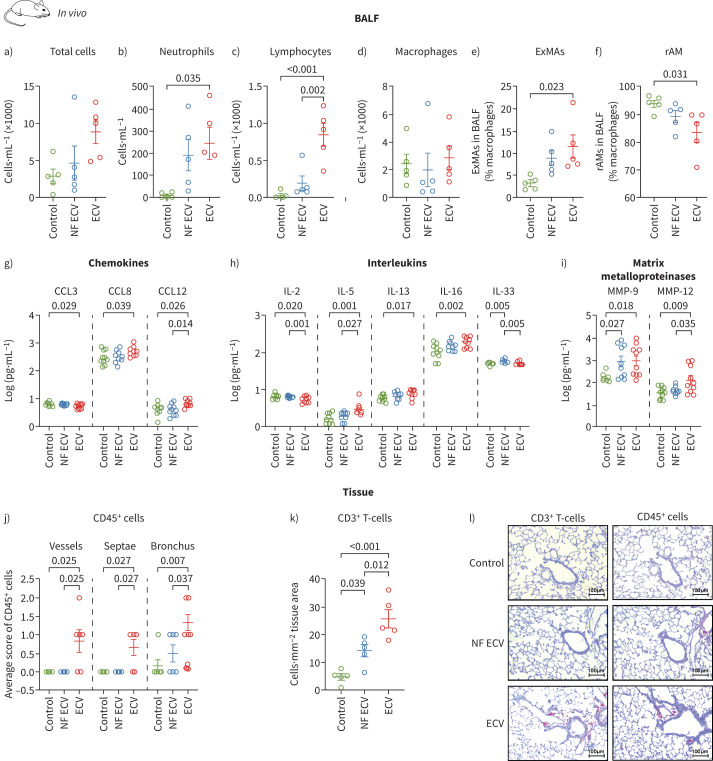
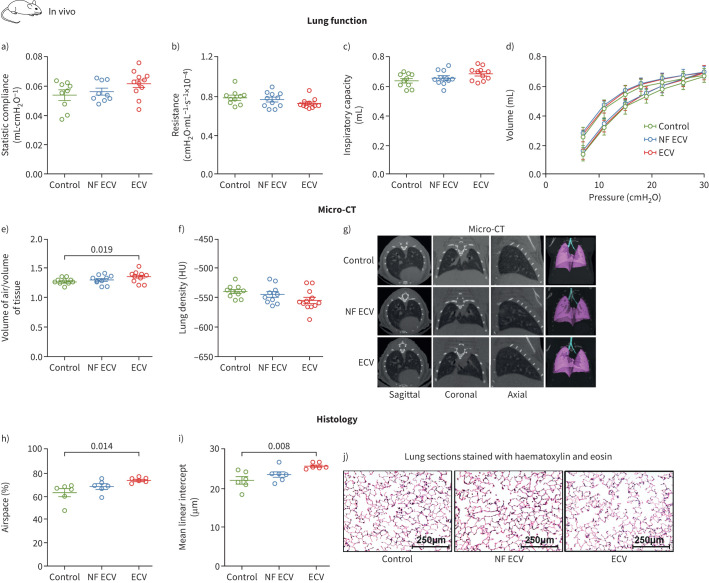
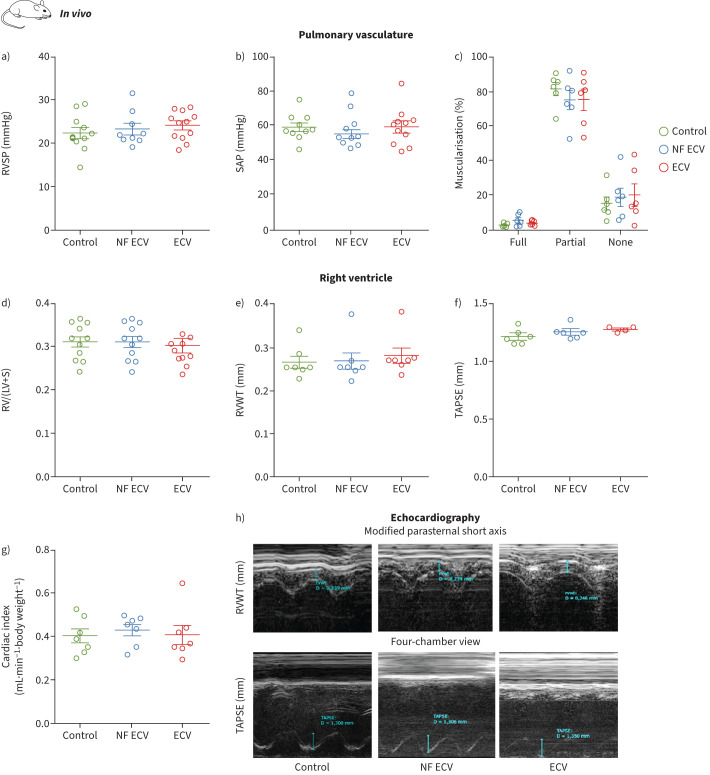
Results: In vitro exposure to nicotine-containing e-cigarette vapour extract (ECVE) or to nicotine-free e-cigarette vapour extract (NF ECVE) induced changes in gene expression of epithelial cells and pulmonary arterial smooth muscle cells (PASMCs), but ECVE in particular caused functional alterations (e.g. a decrease in human and mouse PASMC proliferation by 29.3±5.3% and 44.3±8.4%, respectively). Additionally, acute inhalation of nicotine-containing e-cigarette vapour (ECV) but not nicotine-free e-cigarette vapour (NF ECV) increased pulmonary endothelial permeability in isolated lungs. Long-term in vivo exposure of mice to ECV for 8 months significantly increased the number of inflammatory cells, in particular lymphocytes, compared to control and NF ECV in the bronchoalveolar fluid (BALF) (ECV: 853.4±150.8 cells·mL-1; control: 37.0±21.1 cells·mL-1; NF ECV: 198.6±94.9 cells·mL-1) and in lung tissue (ECV: 25.7±3.3 cells·mm-3; control: 4.8±1.1 cells·mm-3; NF ECV: 14.1±2.2 cells·mm-3). BALF cytokines were predominantly increased by ECV. Moreover, ECV caused significant changes in lung structure and function (e.g. increase in airspace by 17.5±1.4% compared to control), similar to mild tobacco smoke-induced alterations, which also could be detected in the NF ECV group, albeit to a lesser degree. In contrast, the pulmonary vasculature was not significantly affected by ECV or NF ECV.

Conclusions: NF ECV components induce cell type-specific effects and mild pulmonary alterations, while inclusion of nicotine induces significant endothelial damage, inflammation and parenchymal alterations.


Conflict of interest statement

Conflict of interest: All authors have nothing to disclose.

Figures

FIGURE 1
FIGURE 1
Effect of in vitro nicotine-containing e-cigarette vapour extract (ECVE) or nicotine-free e-cigarette vapour extract (NF ECVE) exposure on metabolic activity and proliferation. a, b) Cell metabolic activity of primary mouse alveolar type II (mATII) cells (a, n=6) and primary mouse pulmonary arterial smooth muscle cells (mPASMCs) (b, n=5) after exposure to different concentrations of either NF ECVE, ECVE or conventional cigarette smoke extract (CSE). Data are presented as percentage of control. c) Cell proliferation of mPASMC (n=8) after exposure to either 15% NF ECVE, 15% ECVE, 5% CSE or control. Data are presented as percentage compared to control. d, e) Cell metabolic activity of primary human bronchial epithelial cells (HBEpCs) (d, n=6) and primary human PASMCs (hPASMCs) (e, n=5) after exposure to different concentrations of either NF ECVE, ECVE or CSE. Data are presented as percentage of control. f) Cell proliferation of hPASMCs (n=6) after exposure to either 15% NF ECVE, 15% ECVE, 5% CSE or control. Data are presented as percentage compared to control. Controls were treated with medium without ECVE, NF ECVE or CSE. Number of mATII cells, mPASMCs and hPASMCs represents independent isolations per group, number of HBEpCs represents independent experiments per group. Statistical analysis was performed by one-way ANOVA with Tukey's post hoc test. Significant p-values in comparison to respective controls are presented. Data are presented as mean±sem.
FIGURE 2
FIGURE 2
The effects of nicotine-containing e-cigarette vapour extract (ECVE) or nicotine-free e-cigarette vapour extract (NF ECVE) on gene expression patterns, glutathione levels and protein expression of the autophagy-lysosome system. a, b) Gene ontology (GO) enrichment analysis of differentially expressed mRNA transcripts in primary mouse alveolar type II (mATII) cells (a) and primary mouse pulmonary arterial smooth muscle cells (mPASMCs) (b) exposed to either 15% NF ECVE or 15% ECVE. Bubble plots for enrichment analysis of GO terms are presented. The bubble areas indicate the number of genes in the sets, and the colour indicates if most of GO terms were upregulated (red) or downregulated (green). Yellow indicates that both up- and downregulated genes contribute to the enrichment (n=8). The y-axis (−log(p)) displays the significance level, the x-axis the percentage of expressed genes in the respective set of genes for a specific pathway. c) Ratio of reduced glutathione (GSH) to oxidised glutathione (GSSG) in primary mATII cells exposed to either 15% NF ECVE, 15% ECVE, 2.5% cigarette smoke extract (CSE) or control medium without ECVE, NF ECVE or CSE (n=8 each). d, e) Protein expression of p62 and microtubule-associated proteins 1A/1B light chain 3B (LC3-II), normalised to the expression of β-actin, in primary mPASMCs exposed to either 15% NF ECVE, 15% ECVE or control medium without ECVE or NF ECVE (n=4). Numbers represent independent isolations per group. For statistical analysis of c and d, one-way ANOVA with Tukey's post hoc test was used. Data are presented as mean±sem.
FIGURE 3
FIGURE 3
Nicotine-containing e-cigarette vapour (ECV) inhalation increased endothelial permeability in isolated perfused and ventilated mouse lungs. a) Effect of nicotine-free e-cigarette vapour (NF ECV) or ECV on hypoxic pulmonary vasoconstriction, determined as the maximum increase of pulmonary arterial pressure (ΔPAP) during hypoxic ventilation. b) Effect of NF ECV or ECV on the capillary filtration coefficient (Kfc), which was measured gravimetrically and calculated from the slope of lung weight gain induced by an increase of the pulmonary venous pressure from 2 mmHg to 10 mmHg. Data are provided as percentage change of ΔPAP and Kfc compared to the reference hypoxic manoeuvre or pressure challenge without NF ECV or ECV (n=5–6 isolated mouse lungs per group, control lungs were ventilated without NF ECV or ECV). Statistical analysis was performed by one-way ANOVA with Tukeys post hoc test. Data are presented as mean±sem.
FIGURE 4
FIGURE 4
Effect of long-term in vivo exposure to nicotine-containing e-cigarette vapour (ECV) or nicotine-free e-cigarette vapour (NF ECV) on pulmonary inflammation. a–d) Total number of cells (a), neutrophils (b), lymphocytes (c) and macrophages (d) in bronchoalveolar lavage fluid (BALF) from mice exposed to NF ECV or ECV for 8 months. e, f) Number of macrophages given for exudate macrophages (ExMAs) (e) and resident macrophages (rAMs) (f). Values are given as the percentage of total macrophages. For a–f, n=5 mice per group. g–i) Levels of selected inflammatory mediators in BALF from mice exposed to NF ECV or ECV for 8 months (n=10 mice per group). j) Number of CD45+ cells located around vessels, alveolar septa or bronchi in lung sections of mice exposed to NF ECV or ECV for 8 months according to the following scale: 0: few CD45+ cells; 1: moderate number of CD45+ cells; 2: many CD45+ cells (n=6 lungs per group). k) Number of CD3+ cells per lung section area in mice exposed to NF ECV or ECV for 8 months (n=5 lungs per group). l) Representative images of lung sections from mice exposed to NF ECV or ECV stained for CD3+ and CD45+ cells. Control animals received room air only. Scale bars: 100 μm. Statistical analysis: a–i, k) one-way ANOVA with Tukey's post hoc test; j) categorical analysis was done using pair-wise Wilcoxon tests with continuity correction. Data are presented as mean±sem.
FIGURE 5
FIGURE 5
Effect of long-term in vivo exposure to nicotine-containing e-cigarette vapour (ECV) or nicotine-free e-cigarette vapour (NF ECV) on lung function and structure parameters in mice. a–d) Lung function parameters (n=9–11) of static compliance (a), resistance (b), inspiratory capacity (c) and pressure–volume loops (d) of mice exposed to NF ECV, ECV or room air (control) for 8 months. e–j) Lung structure parameters from in vivo micro-computed tomography (CT) measurements (n=9–12) of air/tissue ratio (e), lung density in Hounsfield units (HU) (f) and representative micro-CT imaging (g), or from histological analysis (n=6) of airspace (as a percentage of total area) (h), mean linear intercept (i) and representative pictures (j). Lung sections were stained with haematoxylin and eosin. Scale bars: 250 μm. Statistical analysis: one-way ANOVA with Tukey's post hoc test. Combined p-value from e, f, g, p=0.03 determined by meta-analysis according to Fisher's method using the BisRNA R package. Data are presented as mean±sem.
FIGURE 6
FIGURE 6
Effect of long-term in vivo exposure to nicotine-containing e-cigarette vapour (ECV) or nicotine-free e-cigarette vapour (NF ECV) on the pulmonary circulation in mice. a, b) Haemodynamic measurements (n=9–12): right ventricular systolic pressure (RVSP) (a) and systolic arterial pressure (SAP) (b). c) Morphological analysis of pulmonary vessels. Data are given for fully, partially or not muscularised vessels as a percentage of total vessel count (n=6). d) Fulton index (ratio of the weight of the right ventricle (RV) to the left ventricle plus septum (LV+S)) (n=10–11). The LV+S weight was not changed between the groups. e–h) Echocardiographic analysis of right ventricular wall thickness (RVWT) (e), tricuspid annular plane systolic excursion (TAPSE) (f) and cardiac index (g) (n=4–7 each) and representative images of echocardiography (h). Data were assessed from mice either exposed to NF ECV, ECV or room air (control) for 8 months. Statistical analysis was performed by one-way ANOVA with Tukey's post hoc test. Data are presented as mean±sem.

Comment in

References

    1. Finks SW, Rumbak MJ, Self TH. Treating hypertension in chronic obstructive pulmonary disease. N Engl J Med 2020; 382: 353–363. doi:10.1056/NEJMra1805377 - DOI - PubMed
    1. Gredic M, Blanco I, Kovacs G, et al. . Pulmonary hypertension in chronic obstructive pulmonary disease. Br J Pharmacol 2021; 178:132–151. doi:10.1111/bph.14979 - DOI - PubMed
    1. Pappas RS. Toxic elements in tobacco and in cigarette smoke: inflammation and sensitization. Metallomics 2011; 3: 1181–1198. doi:10.1039/c1mt00066g - DOI - PMC - PubMed
    1. Huang J, Duan Z, Kwok J, et al. . Vaping versus JUULing: how the extraordinary growth and marketing of JUUL transformed the US retail e-cigarette market. Tob Control 2019; 28: 146–151. doi:10.1136/tobaccocontrol-2018-054382 - DOI - PMC - PubMed
    1. Kaur G, Pinkston R, McLemore B, et al. . Immunological and toxicological risk assessment of e-cigarettes. Eur Respir Rev 2018; 27: 170119. doi:10.1183/16000617.0119-2017 - DOI - PMC - PubMed

Publication types