. 2023 Apr 27;13(1):5996.
doi: 10.1038/s41598-023-30650-8.

Land-use change is associated with multi-century loss of elephant ecosystems in Asia

Affiliations

Land-use change is associated with multi-century loss of elephant ecosystems in Asia

Shermin de Silva et al. Sci Rep. .

Abstract

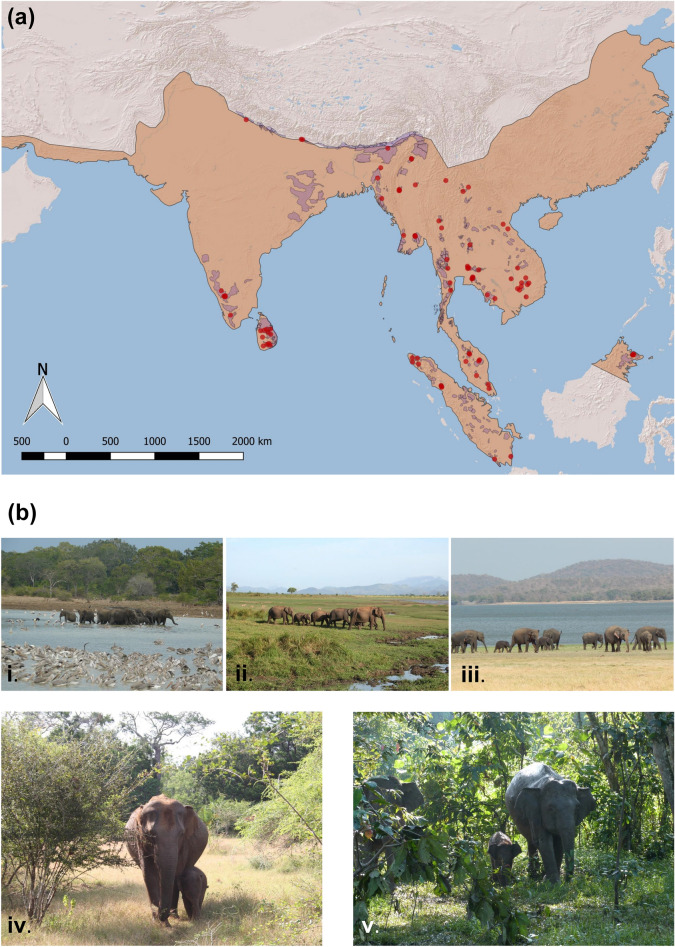
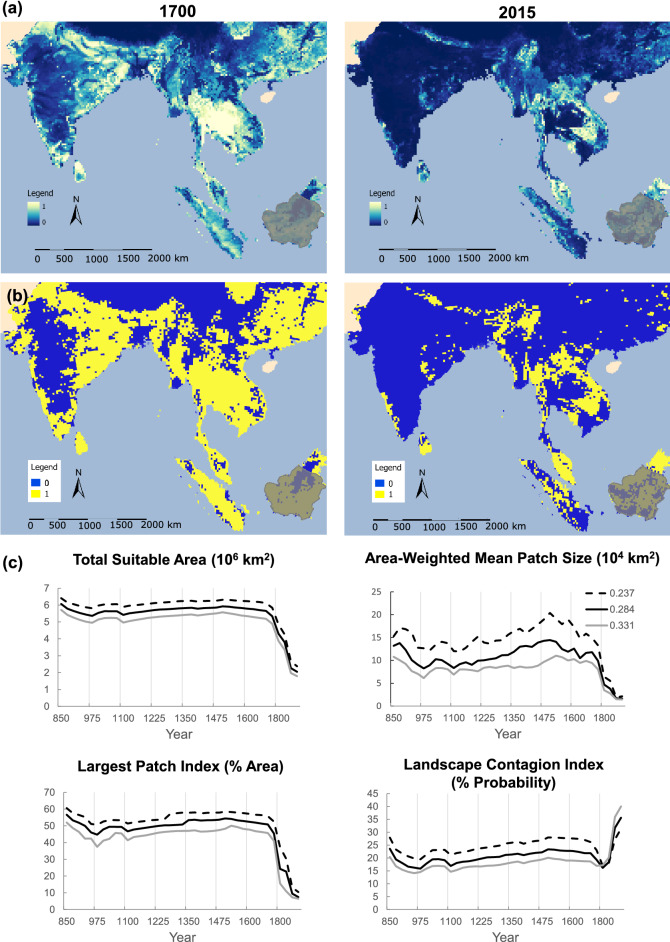
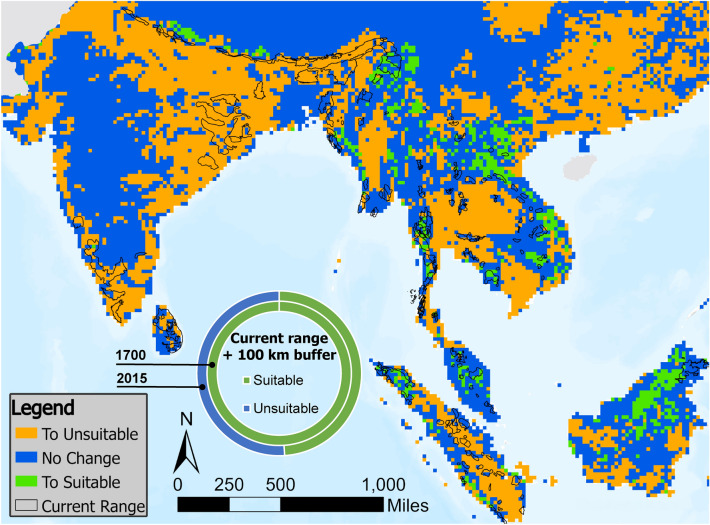
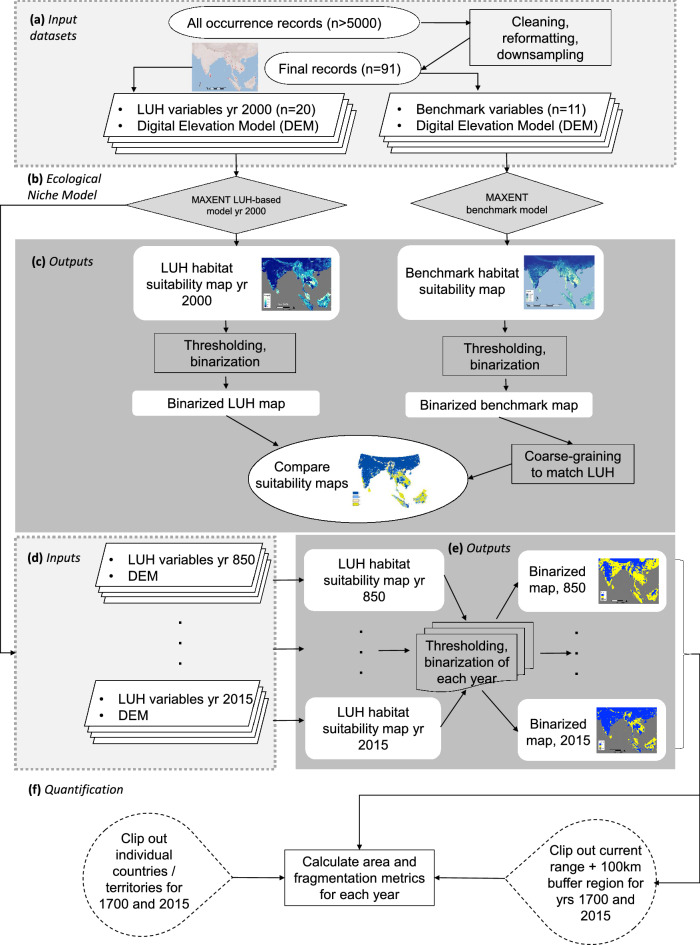
Understanding historic patterns of land use and land cover change across large temporal and spatial scales is critical for developing effective biodiversity conservation management and policy. We quantify the extent and fragmentation of suitable habitat across the continental range of Asian elephants (Elephas maximus) based on present-day occurrence data and land-use variables between 850 and 2015 A.D. We found that following centuries of relative stability, over 64% (3.36 million km2) of suitable elephant habitat across Asia was lost since the year 1700, coincident with colonial-era land-use practices in South Asia and subsequent agricultural intensification in Southeast Asia. Average patch size dropped 83% from approximately 99,000-16,000 km2 and the area occupied by the largest patch decreased 83% from ~ 4 million km2 (45% of area) to 54,000 km2 (~ 7.5% of area). Whereas 100% of the area within 100 km of the current elephant range could have been considered suitable habitat in the year 1700, over half was unsuitable by 2015, driving potential conflict with people. These losses reflect long-term decline of non-forested ecosystems, exceeding estimates of deforestation within this century. Societies must consider ecological histories in addition to proximate threats to develop more just and sustainable land-use and conservation strategies.


Conflict of interest statement

The authors declare no competing interests.

Figures

Figure 1
Figure 1
Locations of elephant occurrence. (a) Brown shaded region shows presumed historic post-glacial range (Olivier), smaller purple polygons show current range (classified as “active confirmed” in Hedges et al.), points show sampled occurrences. Map created by S. de Silva in Quantum GIS (QGIS, https://www.qgis.org) v.2.18.25. (b) Examples of Asian elephant ecosystems. Upper panel: anthropogenic water sources of varying ages and scale at which elephants gather in Sri Lanka. (i) A small reservoir originally built and maintained at village-level with inhabitants resettled in the 1980s after the creation of Udawalawe National Park, now maintained by wildlife managers. (ii) A large dammed reservoir completed in the 1970s and maintained by the national government, the impetus for creation of Udawalawe National Park. (iii) The large Minneriya reservoir built by King Mahasen in the third century and restored in the 1800s following British occupation. Small reservoirs provide year-round water whereas large reservoirs also yield floodplain vegetation for forage. Lower panel: Asian elephants occur in dry seasonally deciduous forests (iv) as well as lush a-seasonal rainforests. Photos: S. de Silva.
Figure 2
Figure 2
Loss of suitable habitat from 850 to 2015. Masked areas (Hainan Island and part of Pakistan) have been excluded from analyses, and for visual clarity all of China is not shown. Shaded area (Borneo) is outside the currently known historic range. (a) Habitat suitability predicted on the basis of elevation and the Land-use Harmonization (LUH) variables from the year 2000. (b) Binarized map where 1 (yellow) indicates “suitable” areas with values above 0.284 (threshold of ‘maximum training sensitivity plus specificity’) and 0 (blue) indicates “unsuitable” areas. (c) Changes in the extent and spatial configuration of suitable habitat, where each curve corresponds to the given threshold value. Total Suitable Area is the sum of all suitable habitat across the range. Area-Weighted Mean Patch Size is the weighted average of patch sizes. The Largest Patch Index is the percentage of total area occupied by the largest patch. The Landscape Contagion Index can be thought of as a measure of homogeneity, with higher probabilities representing fewer, more clumped patches. See Table S4 for complete list of fragmentation measures.
Figure 3
Figure 3
Loss and gain in suitable habitat across the range between 1700 and 2015. Masked areas (Pakistan, Hainan Island) have been excluded from analysis. Overall, 64.2% of the total area converted from suitable to unsuitable in this period, with 38.6% occurring within the current range (Table 3). Habitat gains largely occurred outside the current range. Donut chart shows that 100% of area within 100 km of the extant range was classified as suitable in the year 1700, but dropped to 48.94% by 2015 (see Figure S3 for timecourse).
Figure 4
Figure 4
Flow chart of study. (a) Input variables used in training and initial evaluation include the SRTM digital elevation model (DEM) and 20 LUH2 variables for a total of 21 variables; input variables for benchmark variables include DEM and 11 other datasets (see Table S1). (b) Ecological niche model constructed. (c) Comparison of model results for the whole range and by country/territory to evaluate degree of agreement (see supplementary text for results). (d) Model runs for each selected year. (e) Binary maps created for each year. (f) Quantification of extent and fragmentation of habitat for the entire region across each time point, by country/territory for the years 1700 and 2015, and for areas within 100 km of the extant range for 1700 and 2015.

References

    1. Jantz SM, et al. Future habitat loss and extinctions driven by land-use change in biodiversity hotspots under four scenarios of climate-change mitigation. Conserv. Biol. 2015;29:1122–1131. doi: 10.1111/cobi.12549. - DOI - PubMed
    1. Watson JEM, et al. Catastrophic declines in wilderness areas undermine global environment targets. Curr. Biol. 2016;26:2929–2934. doi: 10.1016/j.cub.2016.08.049. - DOI - PubMed
    1. Crooks KR, et al. Quantification of habitat fragmentation reveals extinction risk in terrestrial mammals. Proc. Natl. Acad. Sci. 2017;114:7635–7640. doi: 10.1073/pnas.1705769114. - DOI - PMC - PubMed
    1. IPBES. Global assessment report on biodiversity and ecosystem services of the Intergovernmental Science-Policy Platform on Biodiversity and Ecosystem Services. (IPBES Secretariat, 2019).
    1. Lambin EF, Geist HJ, Lepers E. Dynamics of land-use and land-cover change in tropical regions. Annu. Rev. Environ. Resour. 2003;28:205–241. doi: 10.1146/annurev.energy.28.050302.105459. - DOI

Publication types