. 2023 Apr 27;14(1):2126.
doi: 10.1038/s41467-023-37568-9.

Expression-based subtypes define pathologic response to neoadjuvant immune-checkpoint inhibitors in muscle-invasive bladder cancer

Affiliations

Expression-based subtypes define pathologic response to neoadjuvant immune-checkpoint inhibitors in muscle-invasive bladder cancer

A Gordon Robertson et al. Nat Commun. .

Abstract

Checkpoint immunotherapy (CPI) has increased survival for some patients with advanced-stage bladder cancer (BCa). However, most patients do not respond. Here, we characterized the tumor and immune microenvironment in pre- and post-treatment tumors from the PURE01 neoadjuvant pembrolizumab immunotherapy trial, using a consolidative approach that combined transcriptional and genetic profiling with digital spatial profiling. We identify five distinctive genetic and transcriptomic programs and validate these in an independent neoadjuvant CPI trial to identify the features of response or resistance to CPI. By modeling the regulatory network, we identify the histone demethylase KDM5B as a repressor of tumor immune signaling pathways in one resistant subtype (S1, Luminal-excluded) and demonstrate that inhibition of KDM5B enhances immunogenicity in FGFR3-mutated BCa cells. Our study identifies signatures associated with response to CPI that can be used to molecularly stratify patients and suggests therapeutic alternatives for subtypes with poor response to neoadjuvant immunotherapy.


Conflict of interest statement

J.J.M. participated in advisory boards for AstraZeneca, Astellas/Seagen, BMS, Janssen, Prokarium, Pfizer, Merck, and UroGen. A.N. is a consultant for Merck, Astra Zeneca, Janssen, Incyte, Roche, Rainier Therapeutics, Clovis Oncology, Bayer, Astellas/Seattle Genetics, Ferring, and Immunomedics. Travel expenses/Honoraria: Roche, Merck, Astra Zeneca, and Janssen. L.M.: Speaker compensation: Merck; Travel expenses and accommodation: Janssen; Research funding: AstraZeneca. AdR is a member of the scientific advisory board of Qlucore and cofounder of Minos Biosciences. A.G.R., K.M., L.C., K.M., L.A., Y.Y., M.C., CG., V.N., V.T., B.C., F.M., and T.P. have no disclosures.

Figures
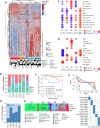
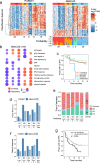
Fig. 1
Fig. 1. Overall characteristics of the PURE01 pre-treatment cohort.
a Heatmap showing five unsupervised consensus clusters, and 1005 differentially expressed genes satisfying p(adj) <10−4 and |log2(FC)| > 2. Covariate tracks show response (CR complete response, PR partial response, and NR non-response), PD-L1 (+/−) status from a Dako 22C3 combined positive score (CPS) assay (+ corresponds to ≥10%), and gender. P-values are from two-sided Fisher exact tests, and are uncorrected for multiple hypothesis testing. b Fraction of PURE01 samples in consensus subtypes that had a complete response (CR), partial response (PR), and non-response (NR). The stacked bar at the right shows the overall responses for the cohort. c Kaplan–Meier plot of recurrence for the five PURE-01 MIBC expression subtypes, censored at 24 months, with a log-rank p-value. d PD-L1 +/− status, shown as fractions of samples in each subtype. e Predicted Lund, TCGA, consensusMIBC, and MD Anderson subtypes for PURE-01 n = 82 expression subtypes. P-values for the covariate tracks are from Fisher exact tests and were Bonferroni-corrected for multiple hypothesis testing (x4). f, g Dot representation of GSEA AUCs for selected f MSigDB Hallmark gene sets, and g Mariathasan et al. 2018 gene sets for the five subtypes. Enriched (vs. repressed) gene sets are shown as red (vs. blue) discs, with disc areas proportional to the areas-under-the-curve (AUCs) of the CERNO test results. h For the PURE01 subtypes, CMap v1.0 connectivity score-rank distributions, with a binary heatmap showing chemical perturbagens with the most negative scores. The dotted box highlights perturbagens that have large negative connectivity scores.
Fig. 2
Fig. 2. Identifying and characterizing predicted PURE01 subtypes in the ABACUS cohort.
a The GLMnet classifier. Left: Heatmap of the 100 features used by the classifier, shown for the PURE01 pre-treatment cohort (n = 82) and its consensus subtypes. Right: Heatmap of the 100 classifier features in the ABACUS pre-treatment cohort (n = 84), with semi-supervised clustering within each of the predicted subtypes. The covariate track above the heatmap shows the predicted PURE01 subtype calls, while the covariate track below the heatmap shows the prediction probabilities for each subtype in each ABACUS sample. b GSEA results for selected MSigDB Hallmark gene sets for the five classifier-predicted subtypes in the ABACUS cohort. Enriched (vs. repressed) gene sets are shown as red (vs. blue) discs; disc areas are proportional to the areas-under-the-curve (AUCs) of the CERNO test results. c Kaplan–Meier plot for DFS for predicted subtypes in the ABACUS n = 84 pre-treatment cohort. d PD-L1(+) status in each PURE01 subtype and each classifier-predicted subtype in ABACUS. e Response (CR, PR, NR) for the classifier-predicted PURE01 subtypes in the ABACUS pre-treatment cohort. f Overall response (OR = CR + PR) for PURE01 subtypes and predicted subtypes in the ABACUS pre-treatment cohort. g Kaplan–Meier plot for DFS, in the atezolizumab arm of the IMvigor010 n = 670 MIBC cohort, for predicted subtypes S1 + S4 vs. predicted subtypes S2 + S3 + S5. The p-value is from a log-rank test, and is not corrected for multiple comparisons.
Fig. 3
Fig. 3. Somatic mutations and copy number alterations in CPI-MIBC PURE-01 expression subtypes.
a Dotplot (left, i): Hallmark gene-set analysis for PURE01 tumors with mutations in 13 selected genes (relative to WT). Barplot (right, ii): fraction of samples in a subtype with somatic mutations in KRAS, FGFR3, KMT2C, or ATR. Exact padj, given for each gene, were calculated as follows. P-values were calculated using two-sided Pearson’s chi-square tests, and were Bonferroni-corrected for multiple comparisons. b Relative mutation frequency of five selected genes, stratified by response (CR or PR; non-response is NR). P-values were calculated using two-sided Pearson’s chi-square tests, and were Bonferroni-corrected for multiple hypothesis testing. c Oncoprints for somatic mutations and somatic copy number alterations in the five n = 82 PURE-01 expression subtypes. The top-to-bottom gene order is set by decreasing alteration frequency in the Luminal-Excluded (S1) subtype. For each subtype, horizontal bars to the right indicate the number of samples with an alteration in that gene, and the types of alterations. Barplots at the top of each subtype’s oncoprint show the total number of genetic alterations in the oncoprint genes, colored by the alteration type.
Fig. 4
Fig. 4. Pre-treatment subtypes have distinct immune infiltration patterns.
a Heatmaps showing ESTIMATE Immune and Stromal scores, and immune cell scores from MCP-counter for the five pre-treatment expression subtypes. See also Supplemental Fig. 4 and the ‘Comparing ESTIMATE, MCP-counter and DSP’ section in Results. b Nanostring GeoMx digital spatial profiling (DSP). Above left: schematic of the DSP workflow. Above right: protein panels used, with the number of proteins or phosphoproteins in each panel. Below left: a response-by-subtype barplot (as in Fig. 1b) showing sample numbers/IDs for the eight samples for which we generated DSP data (three CR-NR pairs for S1, S2, and S4, and one additional CR for both S5 and S3). Below right: a representative digital micrograph image of a stained slide, on which white circles show Regions-of-Interest (ROIs), and a red arrow indicates ROI 2. (‘Representative’ implies manual selection, with no biological or technical replicates.) Enlarged, this ROI is shown to the right, with green PanCk+ stain indicating the tumor cells and red-purple CD3 + stain indicating the tumor microenvironment (TME). The two micrographs further to the right are ROI 2’s color-filtered Areas-of-interest (AOIs) for TME and Tumor, from which the DSP protein signals were generated. c Principal component analysis (PCA) for TME AOI proteins for PURE01 subtypes LumE (S1), LumR (S2), and MycU (S4), comparing complete responders (CR, left) and non-responders (NR, right). Above: PCA similarity plots. Outlined areas indicate sets of AOIs that correspond to a subtype, and X- and Y-axis labels indicate the percentage of total variation explained by the first two principal components. Below: In loading plots, arrow lengths and directions indicate the relative contribution of an important protein to principal components PC1 and PC2. d Heatmaps of DSP protein abundance for TME AOIs (columns) for a complete responder and a non-responder from PURE01 subtypes S1, S2, and S4, for 13 immune regulatory proteins and immune markers.
Fig. 5
Fig. 5. Comparison of pre- and post-treatment PURE01 samples.
a Sankey-like diagram showing: (above) five unsupervised clusters for pre-treatment samples (n = 82) and (below) seven clusters for pre+post samples (n = 113). Each bezier curve shows the positions of one sample in two consensus clustering solutions. Below, bezier curves are drawn only for the n = 27 matched pre-post sample pairs. The n = 113 clusters are colored to indicate subtypes that correspond between the n = 82 and n = 113 clustering results. The gray-black covariate track indicates pre- and post-treatment samples in the n = 113 clustering solution. A two-sided Fisher exact test that compared pre/post-treatment status to seven consensus subtypes returned p = 8.7 × 10−13, uncorrected for multiple comparisons. b Representative H&E-stained micrographs for post-treatment subtypes S6 and S7. (‘Representative’ implies manual selection, with no biological or technical replicates.) Scale bars are 0.1 mm. c Fraction of samples in S6 (n = 11) and S7 (n = 10) that were lymph node N0 vs. N1 at radical cystectomy. d Distributions of tumor areas in subtypes S6 and S7. Results were generated from RNA-Seq data for the n = 113 PURE01 pre- and-post-treatment cohort, with no biological or technical replicates. Dots represent individual samples. The p-value is from a two-sided Student’s t-test. e, f GSEA results for S6 and S7 using e MSigDB Hallmark gene sets and f Mariathasan gene sets. See the legend for Fig. 1f, g. g Changes in ESTIMATE ImmuneScore, StromalScore, and tumor purity, in pre and post-samples, with lines colored as in (a), for the n = 27 matched sample pairs. Results were generated from RNA-Seq data for the n = 27 PURE01 pre/post-treatment matched sample pairs, with no biological or technical replicates. Dots show matched-pair pre-or-post-treatment samples; lines show pre-to-post changes for an individual sample. h, i Connectivity score-rank distributions for CMap v1.0 perturbagens identified for subtypes h S6 and i S7. For each subtype, insets show details of the chemical perturbagens with the largest positive and negative connectivity scores and highlight a subset of these perturbagens.
Fig. 6
Fig. 6. KDM5B and FGFR3 are potential therapeutic targets to activate an immune response in S1 CPI-MIBCs.
a KDM5B regulon target genes (red = positive targets, blue = negative targets), with immune-related genes marked by black discs. b Validating the negative association between KDM5B regulon activity and ESTIMATE ImmuneScore. (i) The relationship of KDM5B regulon activity to ESTIMATE ImmuneScore in the PURE01 pre-treatment cohort, with samples (dots) colored by KDM5B regulon activity status. (ii) Rank-sorted profile of KDM5B regulon activity across the PURE01 pre-treatment cohort, showing activated (n = 23, 28%), undefined (n = 23, 28%), and repressed (n = 36, 43%) cohort subsets. (iii) Relationship of KDM5B regulon activity to ESTIMATE ImmuneScore in the TCGA-BLCA cohort (n = 404). (iv) Rank-sorted profile of KDM5B regulon activity across the TCGA-BLCA cohort, showing activated (n = 111, 27%), undefined (n = 146, 36%), and repressed (n = 147, 36%) cohort subsets. c Left: Unsupervised clustering of single-cell RNA sequencing data from three human MIBC tumors identified 19 clusters consisting of cells from the tumor, immune, and stromal compartments. Right: (i) Unsupervised reclustering of scRNA-Seq data for epithelial cells identified nine sub-clusters. (ii) Distribution of a luminal signature score in the epithelial cell sub-clusters. (iii) KDM5B expression in the epithelial cell sub-clusters. (iv, v) AUCell scores reflect the activity of KDM5B(+) and KDM5B(−) regulons in a given cell. d Volcano plots for differentially expressed genes from bulk RNA-Seq data for RT4 cells treated with the KDM5Bi C70 or an FGFRi. e Dot representation of GSEA AUCs for enriched vs. repressed Hallmark gene sets in RT4 cells treated with C70 and FGFRi See the legend of Fig. 1f, g. f Heatmaps of the ATAC-seq signal profiles in RT4 cells treated with the KDM5i C70 or with DMSO as a control, centered on transcriptional start sites. g ATAC-seq and RNA-Seq peak profiles at the interferon-inducible IFI27 and HLA-DQA1 gene loci in RT4 cells treated either with DMSO as a control or the KDM5 inhibitor C70. Pale blue rectangles highlight regions around transcriptional start sites.
Fig. 7
Fig. 7. Summary characteristics of PURE-01 consensus expression subtypes.
Top to bottom: cluster number; subtype name; immune class (desert, infiltrated or excluded); GSEA signed areas under the curve (AUCs) for gene sets from Mariathasan et al. 2018, positive vs. negative AUCs indicate enriched vs. repressed sets and AUC = 0 indicates either that no result was returned from a CERNO test with qval <0.05, or padj > 0.1; GSEA summary, largely from MSigDB Hallmark gene sets; PD-L1 status (CPS > 10% for PD-L1+); response to pembrolizumab treatment (CR, PR, NR); number of samples and percent of the n = 82 cohort; and finally the percent of samples in a subtype that had recurrences within 24 mo.

Comment in

  • Uro-Science.
    Atala A. Atala A. J Urol. 2024 Jan;211(1):194-195. doi: 10.1097/JU.0000000000003710. Epub 2023 Oct 20. J Urol. 2024. PMID: 37861082 No abstract available.

References

    1. Siegel RL, Miller KD, Jemal A. Cancer statistics, 2020. Ca. Cancer J. Clin. 2020;70:7–30. doi: 10.3322/caac.21590. - DOI - PubMed
    1. Rosenberg JE, et al. Atezolizumab in patients with locally advanced and metastatic urothelial carcinoma who have progressed following treatment with platinum-based chemotherapy: a single-arm, multicentre, phase 2 trial. Lancet. 2016;387:1909–1920. doi: 10.1016/S0140-6736(16)00561-4. - DOI - PMC - PubMed
    1. Bidnur, S., Savdie, R. & Black, P. C. Inhibiting immune checkpoints for the treatment of bladder cancer. Bladder Cancer2, 15–25 (2016). - PMC - PubMed
    1. Witjes JA, et al. European Association of Urology guidelines on muscle-invasive and metastatic bladder cancer: summary of the 2020 guidelines. Eur. Urol. 2021;79:82–104. doi: 10.1016/j.eururo.2020.03.055. - DOI - PubMed
    1. Flaig TW, et al. Bladder cancer, version 3.2020, NCCN clinical practice guidelines in oncology. J. Natl Compr. Cancer Netw. JNCCN. 2020;18:329–354. doi: 10.6004/jnccn.2020.0011. - DOI - PubMed

Publication types

MeSH terms

Substances