. 2023 Apr 27;14(1):2422.
doi: 10.1038/s41467-023-38201-5.

Resurgence of Omicron BA.2 in SARS-CoV-2 infection-naive Hong Kong

Affiliations

Resurgence of Omicron BA.2 in SARS-CoV-2 infection-naive Hong Kong

Ruopeng Xie et al. Nat Commun. .

Abstract

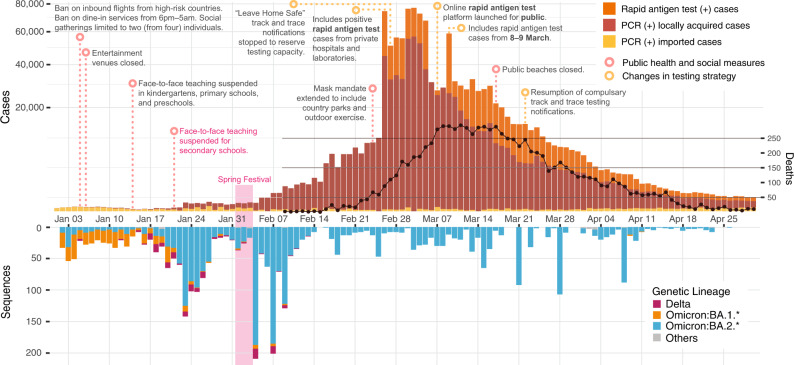
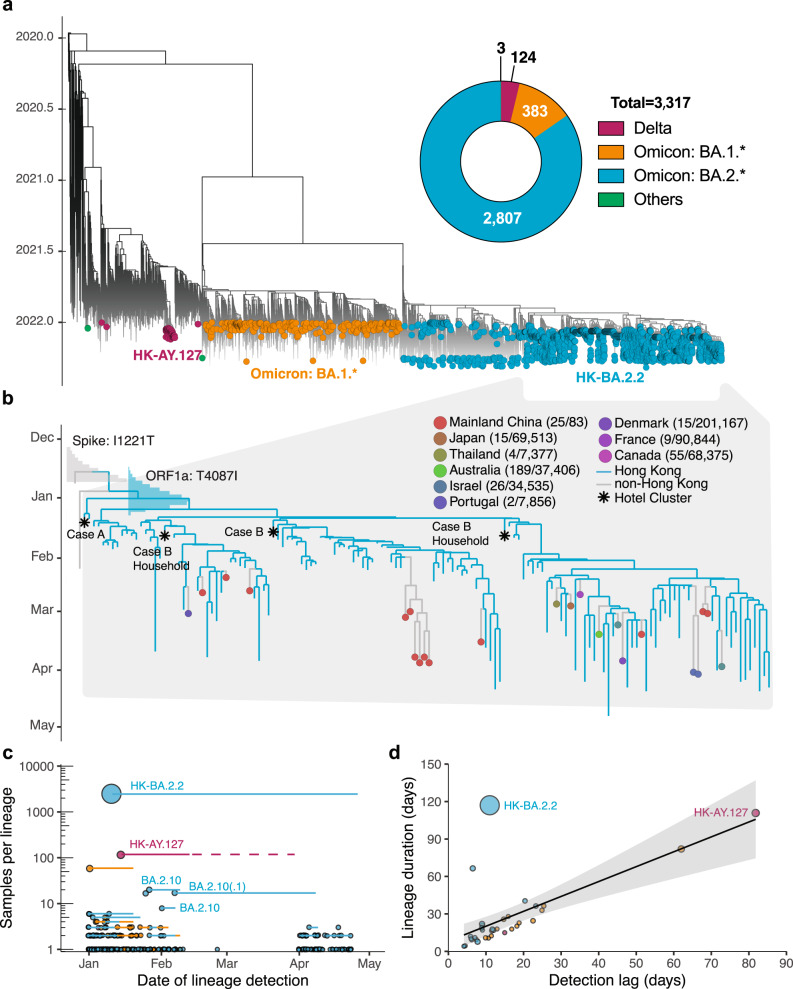
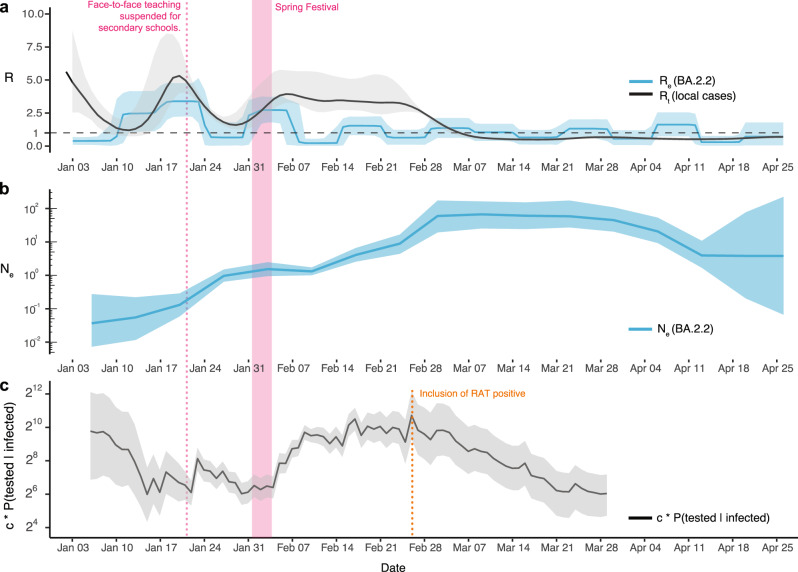
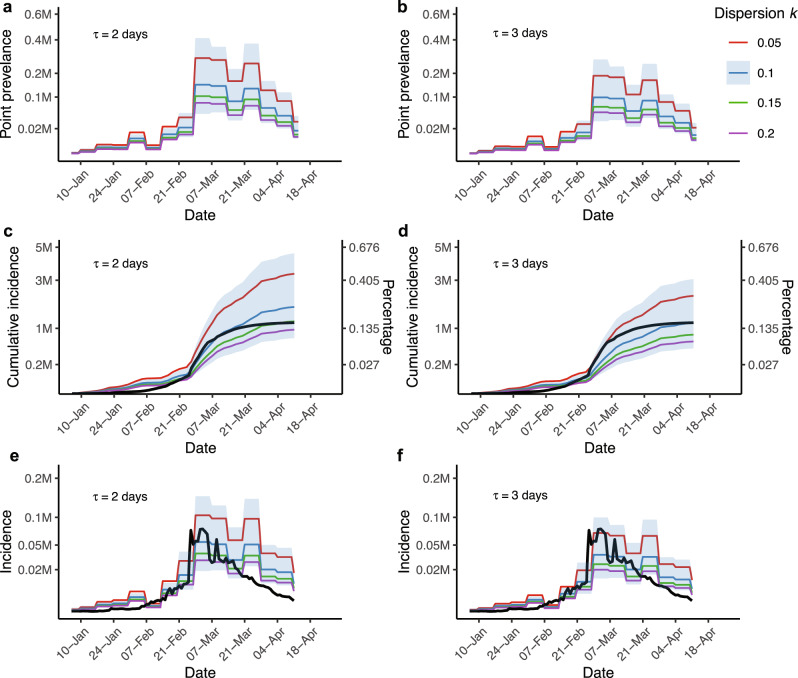
Hong Kong experienced a surge of Omicron BA.2 infections in early 2022, resulting in one of the highest per-capita death rates of COVID-19. The outbreak occurred in a dense population with low immunity towards natural SARS-CoV-2 infection, high vaccine hesitancy in vulnerable populations, comprehensive disease surveillance and the capacity for stringent public health and social measures (PHSMs). By analyzing genome sequences and epidemiological data, we reconstructed the epidemic trajectory of BA.2 wave and found that the initial BA.2 community transmission emerged from cross-infection within hotel quarantine. The rapid implementation of PHSMs suppressed early epidemic growth but the effective reproduction number (Re) increased again during the Spring festival in early February and remained around 1 until early April. Independent estimates of point prevalence and incidence using phylodynamics also showed extensive superspreading at this time, which likely contributed to the rapid expansion of the epidemic. Discordant inferences based on genomic and epidemiological data underscore the need for research to improve near real-time epidemic growth estimates by combining multiple disparate data sources to better inform outbreak response policy.


Conflict of interest statement

The authors declare no competing interests.

Figures

Fig. 1
Fig. 1. Epidemiological summary of SARS-CoV-2 from January to April 2022 in Hong Kong.
Reported cases and deaths (above) and sequenced genomes (below) over time. Rapid antigen test-positive cases reported on 9 March include cases from both 8 and 9 March.
Fig. 2
Fig. 2. Phylogenetic analysis and transmission lineages of the fifth wave outbreak from January to April 2022 in Hong Kong.
a Time-scaled ML tree of 3317 viruses sampled from Hong Kong (colored circles) on a background of 5220 subsampled global viruses collected throughout the pandemic (no tips). b Time-resolved maximum clade credibility (MCC) tree of BA.2.2 lineage (n = 121 in Hong Kong and n = 26 global sequences after subsampling; see Methods). The posterior distribution of the time to the most recent common ancestor (tMRCA) is shown in bar charts. The numbers in the brackets indicate BA.2.2 sequences for each country over the total number of sequences in GISAID (accessed 1 May 2022) from January to April 2022. c Summary of SARS-CoV-2 transmission lineages in Hong Kong. Dots represent monophyletic clades colored by lineage and proportional to sequence numbers. Horizontal lines represent the time between the first and last sample dates. After 13 February 2022, there is no AY.127 sequences available in GISAID, but an existing study found the latest AY.127 sequence (incomplete genome) in late March, as indicated by the light red dashed line. d Correlation between the detection lag (from tMRCA to first sample date) and duration (tMRCA to last sample date). The shaded area represents the fitted values’ 95% confidence intervals.
Fig. 3
Fig. 3. Descriptive dynamics of BA.2.2 lineage in Hong Kong.
a The effective reproduction number (Re) based on BA.2.2 sequences and the instantaneous effective reproduction number (Rt) based on the daily reported number of local cases, b the effective population size (Ne), and c relative detection rate in Hong Kong from January 2022 to April 2022. The shaded area denotes the 95% confidence interval.
Fig. 4
Fig. 4. Estimations of point prevalence and cumulative incidence from 6 January to 13 April.
Colored lines represent different levels of dispersion parameter k. Point prevalence, cumulative incidence, and incidence are shown at generation time τ = 2 days in a, c, and e, and at τ = 3 days in b, d, and f. The black lines in cf are locally reported cases. Incidence and point prevalence were averaged weekly. The blue shaded area denotes the 95% confidence interval when k = 0.1. The scale for the incidence and percentage is the same in c, d.

References

    1. Liu, Y. & Rocklov, J. The effective reproductive number of the Omicron variant of SARS-CoV-2 is several times relative to Delta. J. Travel Med.29, taac037 (2022). - PMC - PubMed
    1. Jelley L, et al. Genomic epidemiology of Delta SARS-CoV-2 during transition from elimination to suppression in Aotearoa New Zealand. Nat. Commun. 2022;13:4035. doi: 10.1038/s41467-022-31784-5. - DOI - PMC - PubMed
    1. D24H@HKSTP & HKU. WHO collaborating centre on infectious disease epidemiology and modelling. Nature Index (2022).
    1. Mefsin YM, et al. Epidemiology of Infections with SARS-CoV-2 Omicron BA.2 Variant, Hong Kong, January-March 2022. Emerg. Infect. Dis. 2022;28:1856–1858. doi: 10.3201/eid2809.220613. - DOI - PMC - PubMed
    1. Smith DJ, et al. COVID-19 mortality and vaccine coverage - Hong Kong Special Administrative Region, China, January 6, 2022-March 21, 2022. MMWR Morb. Mortal. Wkly Rep. 2022;71:545–548. doi: 10.15585/mmwr.mm7115e1. - DOI - PMC - PubMed

Publication types