

Cross-modal autoencoder framework learns holistic representations of cardiovascular state
- PMID: 37105979
- PMCID: PMC10140057
- DOI: 10.1038/s41467-023-38125-0
Cross-modal autoencoder framework learns holistic representations of cardiovascular state
Abstract
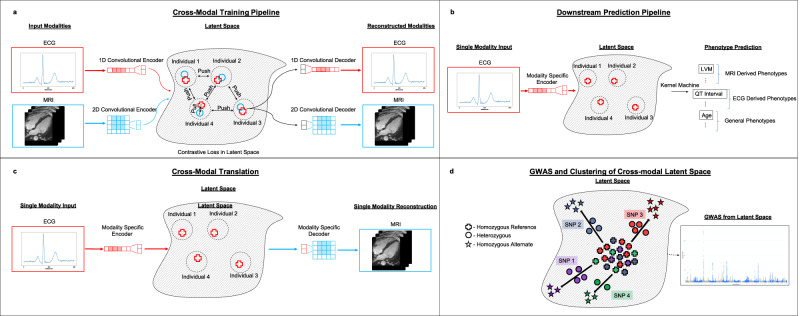
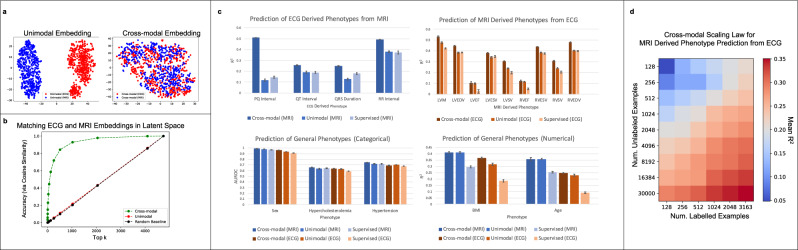
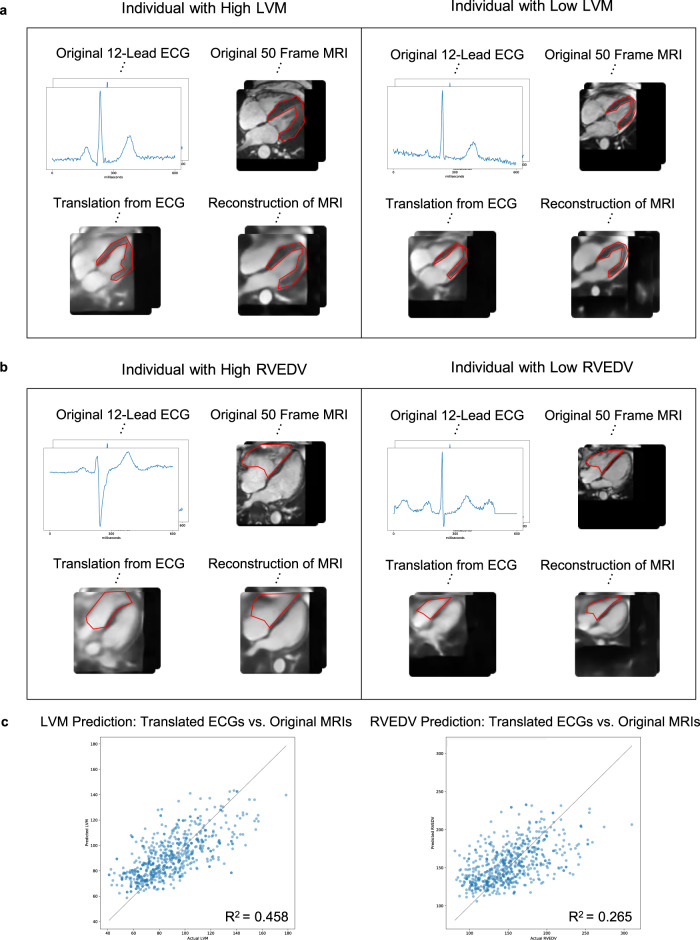
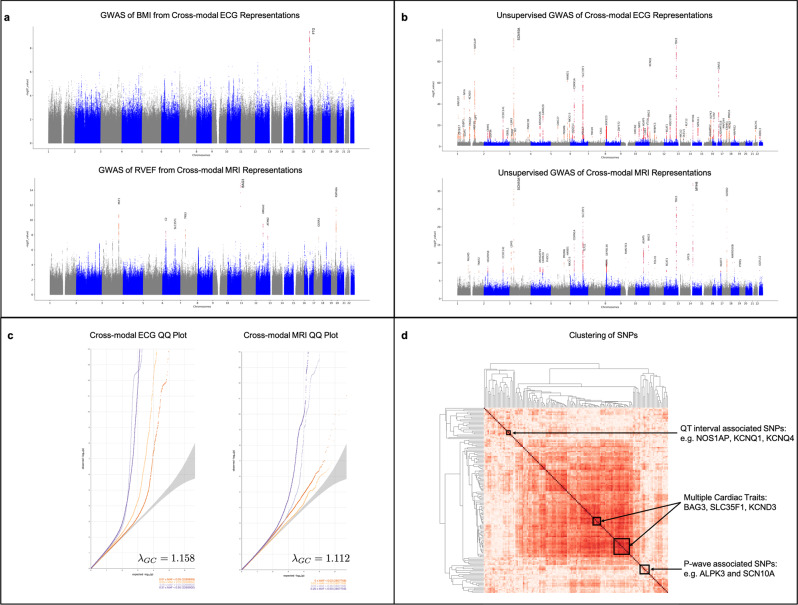
A fundamental challenge in diagnostics is integrating multiple modalities to develop a joint characterization of physiological state. Using the heart as a model system, we develop a cross-modal autoencoder framework for integrating distinct data modalities and constructing a holistic representation of cardiovascular state. In particular, we use our framework to construct such cross-modal representations from cardiac magnetic resonance images (MRIs), containing structural information, and electrocardiograms (ECGs), containing myoelectric information. We leverage the learned cross-modal representation to (1) improve phenotype prediction from a single, accessible phenotype such as ECGs; (2) enable imputation of hard-to-acquire cardiac MRIs from easy-to-acquire ECGs; and (3) develop a framework for performing genome-wide association studies in an unsupervised manner. Our results systematically integrate distinct diagnostic modalities into a common representation that better characterizes physiologic state.
© 2023. The Author(s).
Conflict of interest statement
S.A.L. receives sponsored research support from Bristol Myers Squibb, Pfizer, Boehringer Ingelheim, Fitbit/Google, Medtronic, Premier, and IBM, and has consulted for Bristol Myers Squibb, Pfizer, Blackstone Life Sciences, and Invitae. A.A.P. is a Venture Partner at GV. He has received funding from IBM, Bayer, Pfizer, Microsoft, Verily, and Intel. C.U. serves on the Scientific Advisory Board of Immunai and Relation Therapeutics and has received sponsored research support from Janssen Pharmaceuticals. The remaining authors declare no competing interests.
Figures
Similar articles
-
Genetic Architectures of Medical Images Revealed by Registration of Multiple Modalities.Bioinform Biol Insights. 2024 Sep 28;18:11779322241282489. doi: 10.1177/11779322241282489. eCollection 2024. Bioinform Biol Insights. 2024. PMID: 39372505 Free PMC article.
-
A modality-collaborative convolution and transformer hybrid network for unpaired multi-modal medical image segmentation with limited annotations.Med Phys. 2023 Sep;50(9):5460-5478. doi: 10.1002/mp.16338. Epub 2023 Mar 15. Med Phys. 2023. PMID: 36864700
-
Learning Cross-Modality Representations From Multi-Modal Images.IEEE Trans Med Imaging. 2019 Feb;38(2):638-648. doi: 10.1109/TMI.2018.2868977. Epub 2018 Sep 6. IEEE Trans Med Imaging. 2019. PMID: 30188817
-
A multi-modal fusion framework based on multi-task correlation learning for cancer prognosis prediction.Artif Intell Med. 2022 Apr;126:102260. doi: 10.1016/j.artmed.2022.102260. Epub 2022 Feb 24. Artif Intell Med. 2022. PMID: 35346442
-
Computational medical imaging and hemodynamics framework for functional analysis and assessment of cardiovascular structures.Biomed Eng Online. 2017 Mar 21;16(1):35. doi: 10.1186/s12938-017-0326-y. Biomed Eng Online. 2017. PMID: 28327144 Free PMC article. Review.
Cited by
-
Deep learning-derived cardiovascular age shares a genetic basis with other cardiac phenotypes.Sci Rep. 2022 Dec 31;12(1):22625. doi: 10.1038/s41598-022-27254-z. Sci Rep. 2022. PMID: 36587059 Free PMC article.
-
Multimodal explainable artificial intelligence identifies patients with non-ischaemic cardiomyopathy at risk of lethal ventricular arrhythmias.Sci Rep. 2024 Jun 27;14(1):14889. doi: 10.1038/s41598-024-65357-x. Sci Rep. 2024. PMID: 38937555 Free PMC article.
-
Applying multimodal AI to physiological waveforms improves genetic prediction of cardiovascular traits.Am J Hum Genet. 2025 Jul 3;112(7):1562-1579. doi: 10.1016/j.ajhg.2025.05.015. Epub 2025 Jun 20. Am J Hum Genet. 2025. PMID: 40543505 Free PMC article.
-
Autoencoder-based phenotyping of ophthalmic images highlights genetic loci influencing retinal morphology and provides informative biomarkers.Bioinformatics. 2024 Dec 26;41(1):btae732. doi: 10.1093/bioinformatics/btae732. Bioinformatics. 2024. PMID: 39657956 Free PMC article.
-
The Use of Artificial Intelligence to Predict the Development of Atrial Fibrillation.Curr Cardiol Rep. 2023 May;25(5):381-389. doi: 10.1007/s11886-023-01859-w. Epub 2023 Mar 31. Curr Cardiol Rep. 2023. PMID: 37000332 Free PMC article. Review.
References
-
- Li Y, Yang M, Zhang Z. A survey of multi-view representation learning. IEEE Trans. Knowl. Data Eng. 2018;31:1863–1883.
-
- Hotelling, H. Relations between two sets of variates. In Breakthroughs in Statistics (eds Kotz, S. & Johnson, N. L.) 162–190 (Springer, 1992).
-
- Andrew, G., Arora, R., Bilmes, J. & Livescu, K. Deep canonical correlation analysis. In International Conference on Machine Learning (eds Dasgupta, S. & McAllester, D.) (Proceedings of Machine Learning Research, 2013).
Publication types
MeSH terms
Grants and funding
LinkOut - more resources
Full Text Sources
