. 2023 Jun;24(6):1036-1048.
doi: 10.1038/s41590-023-01501-5. Epub 2023 Apr 27.

Dynamic chromatin accessibility licenses STAT5- and STAT6-dependent innate-like function of TH9 cells to promote allergic inflammation

Affiliations

Dynamic chromatin accessibility licenses STAT5- and STAT6-dependent innate-like function of TH9 cells to promote allergic inflammation

Aran Son et al. Nat Immunol. 2023 Jun.

Erratum in

Abstract

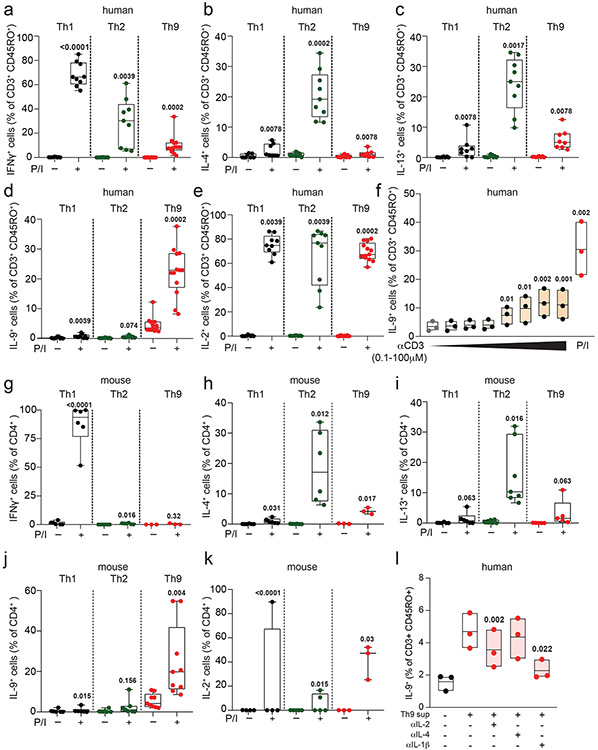
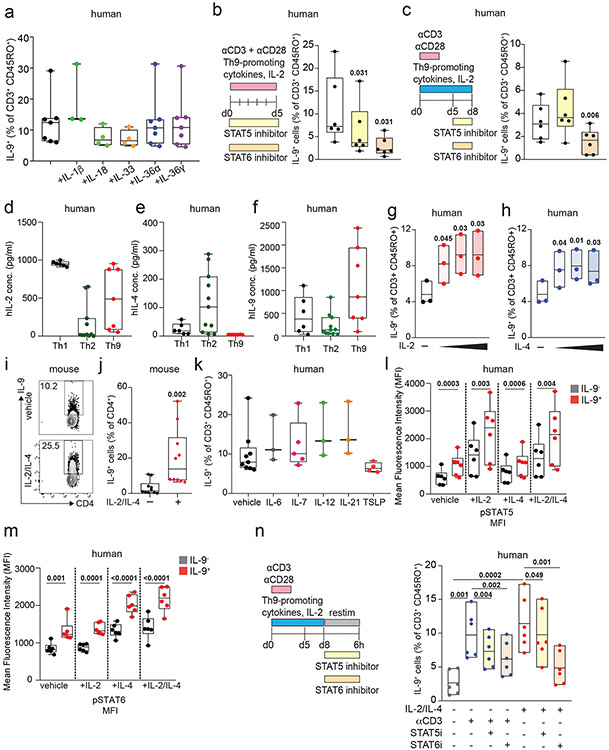
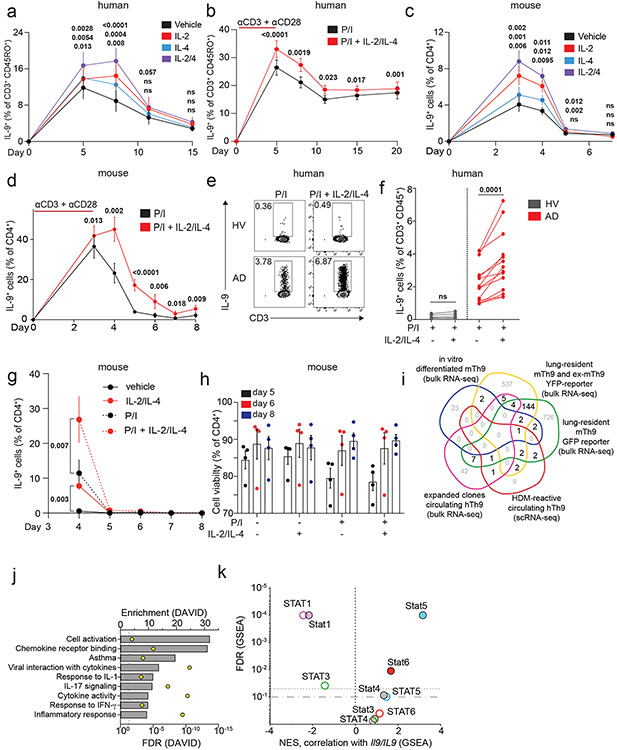
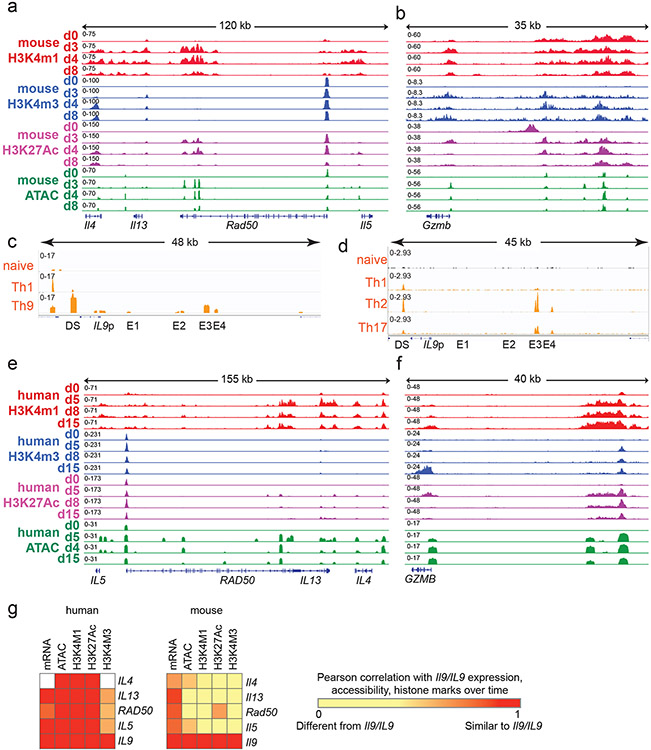
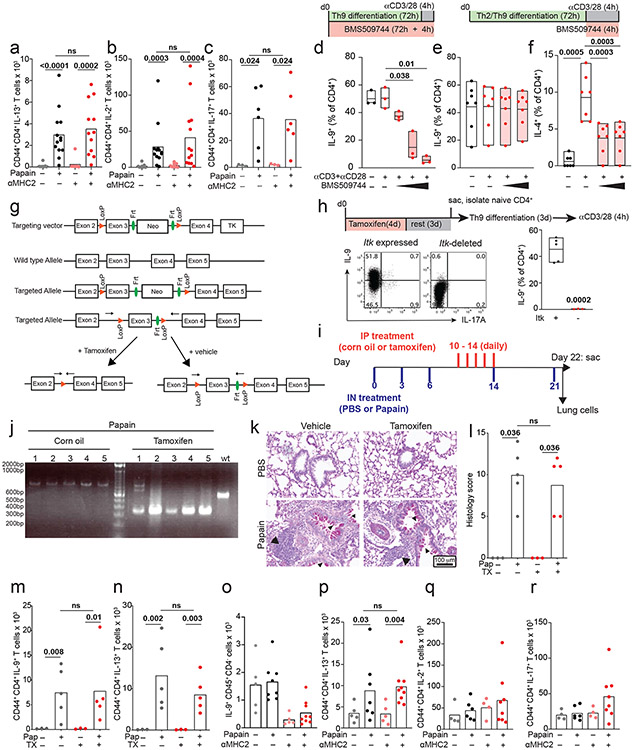
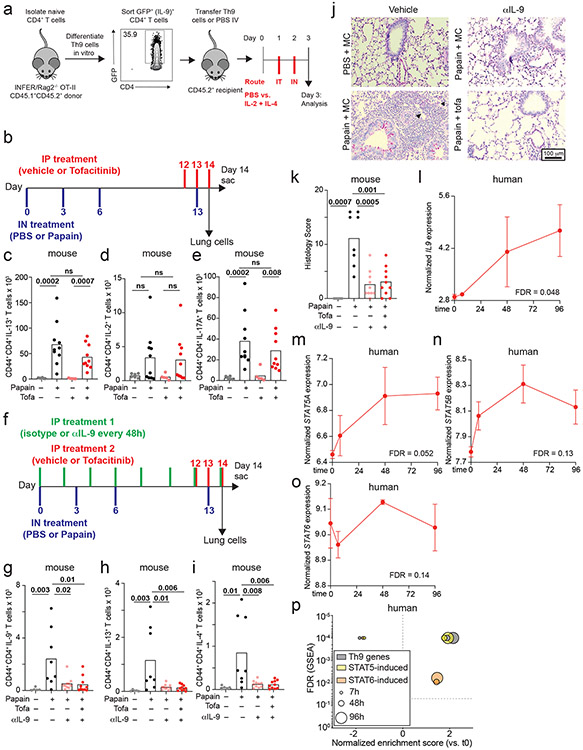
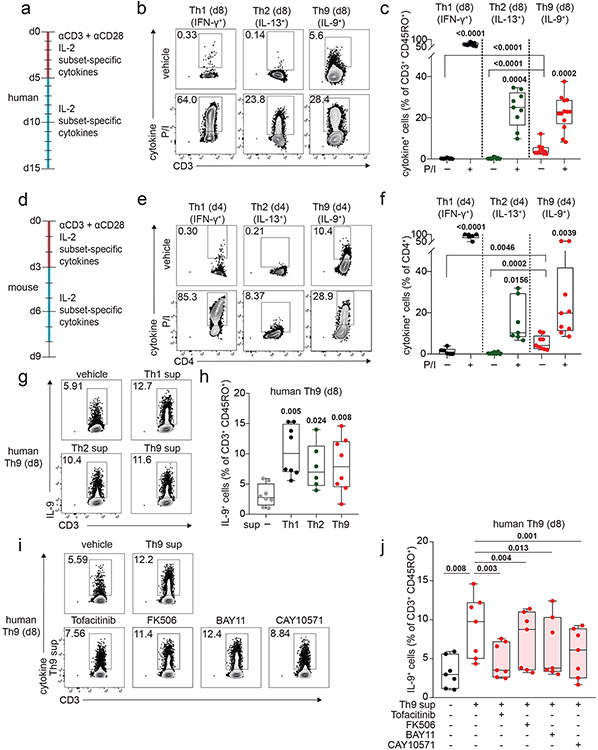
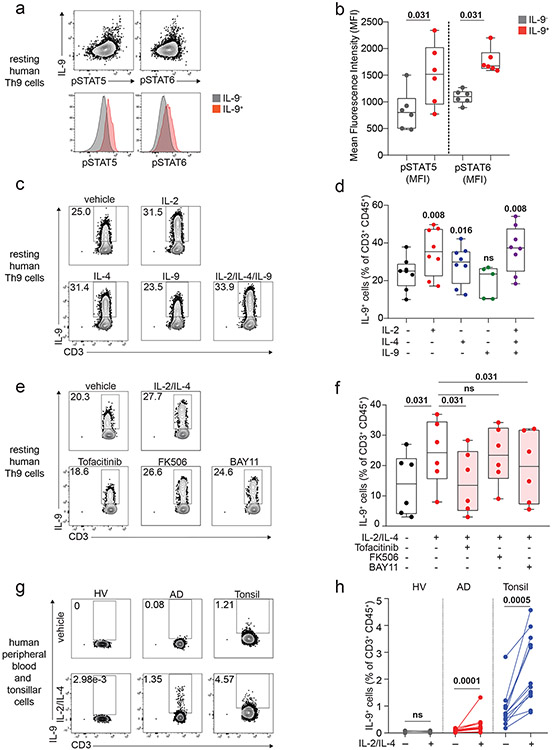
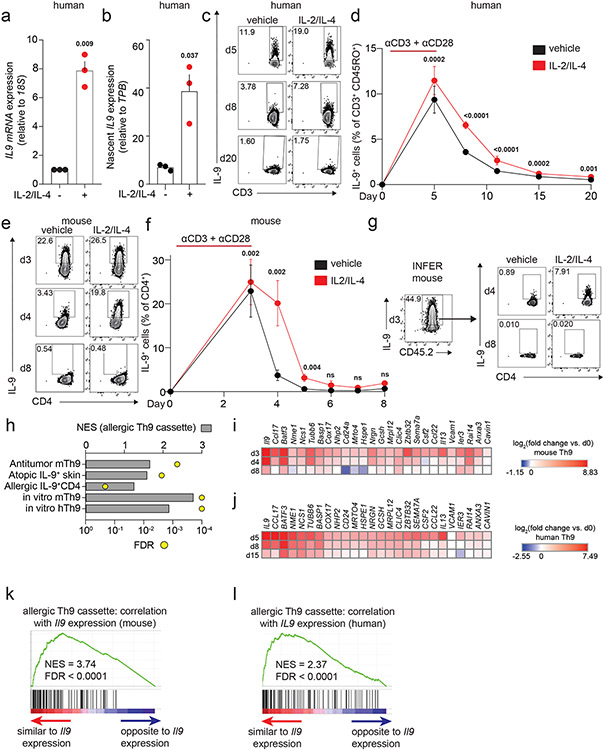
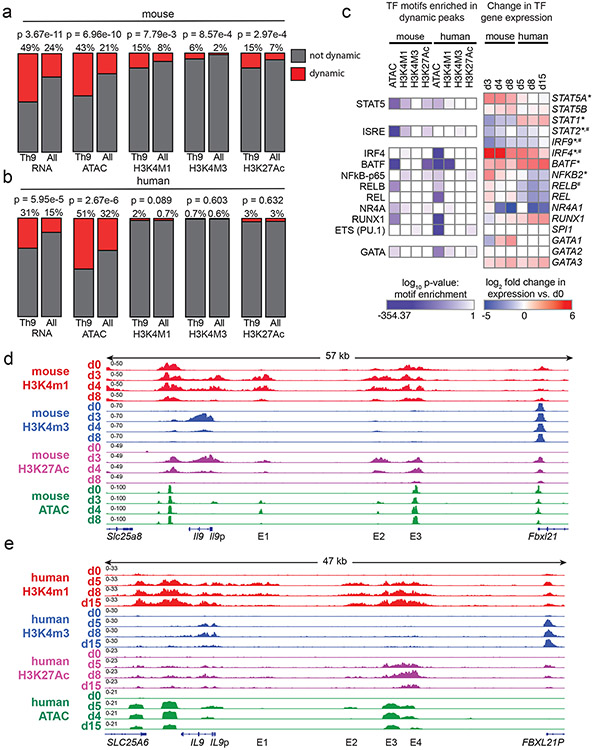
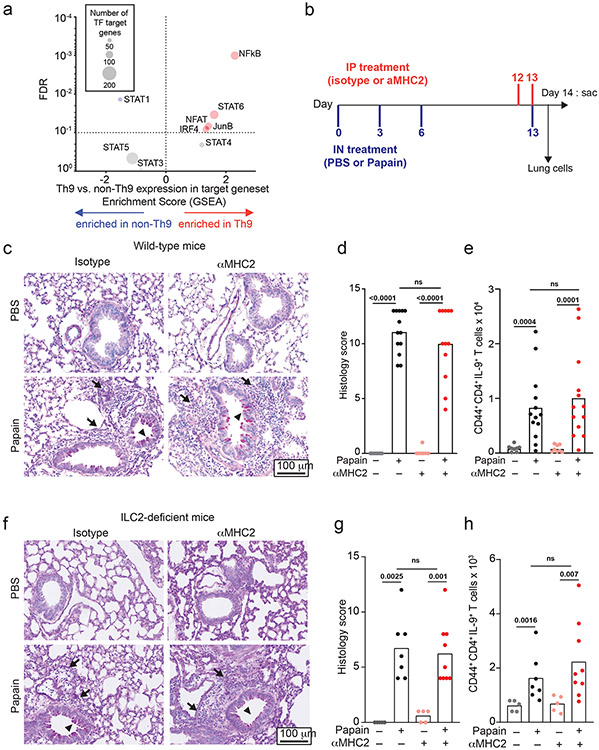
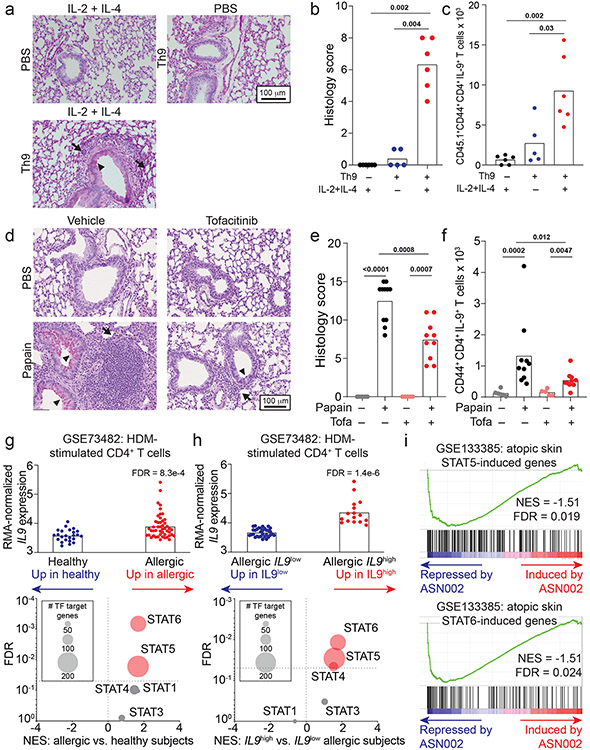
Allergic diseases are a major global health issue. Interleukin (IL)-9-producing helper T (TH9) cells promote allergic inflammation, yet TH9 cell effector functions are incompletely understood because their lineage instability makes them challenging to study. Here we found that resting TH9 cells produced IL-9 independently of T cell receptor (TCR) restimulation, due to STAT5- and STAT6-dependent bystander activation. This mechanism was seen in circulating cells from allergic patients and was restricted to recently activated cells. STAT5-dependent Il9/IL9 regulatory elements underwent remodeling over time, inactivating the locus. A broader 'allergic TH9' transcriptomic and epigenomic program was also unstable. In vivo, TH9 cells induced airway inflammation via TCR-independent, STAT-dependent mechanisms. In allergic patients, TH9 cell expansion was associated with responsiveness to JAK inhibitors. These findings suggest that TH9 cell instability is a negative checkpoint on bystander activation that breaks down in allergy and that JAK inhibitors should be considered for allergic patients with TH9 cell expansion.


Figures

Extended Data Figure 1.
Extended Data Figure 1.. Corresponds to Figure 1.
a-e. Naïve CD4+ T cells from healthy volunteers were activated for 5 days with αCD3, αCD28, IL-2, and subset-promoting cytokines and antibodies. After 5 days, αCD3/αCD28 were withdrawn, and cells were cultured with IL-2 and subset-promoting cytokines and antibodies. Pooled results show production of IFN-γ (a), n=9 (Th1, Th2) or 10 (Th9); IL-4 (b), n=8 (Th1), 9 (Th2), or 4 (Th9); IL-13 (c) n=8 (Th1), 9 (Th2), or 4 (Th9); IL-9 (d) n=9 (Th1, Th2), or 10 (Th9); and IL-2 (e) n=9 (Th1, Th2), or 10 (Th9), with or without PMA and Ionomycin (P/I). f. Bar graphs show % IL-9 positive cells differentiated to d8 Th9 as above and restimulated with vehicle vs. plate bound αCD3 at escalating doses (n=3) g-k. Naïve CD4+ T cells from WT C57BL/6 mice were activated for 3 days with αCD3, αCD28, IL-2, and subset-promoting cytokines and antibodies. After 3 days, αCD3/αCD28 were withdrawn, and cells were cultured with IL-2 and subset-promoting cytokines and antibodies. Pooled results show production of IFN-γ (f), n=6 (Th1, Th2) or 3 (Th9); IL-4 (g), n=6 (Th1, Th2) or 5 (Th9); IL-13 (h), n=6 (Th1), 7 (Th2), or 5 (Th9); IL-9 (i), n=6 (Th1), 7 (Th2), or 10 (Th9); and IL-2 (j), n=4 (Th1), 5 (Th2), or 3 (Th9), with or without P/I. l. Bar graphs show % IL-9+ cells of resting (d8) human Th9 cells restimulated with Th9 supernatants and vehicle (n=3), αIL-2 (20 μg/mL), αIL-4 (20 μg/mL), or αIL-1β (20 μg/mL). For all line/bar graphs, error bars show ± S.E.M. Box plots show all data points (min to max, lines at median). For all experiments: paired or unpaired t-test, normally distributed data, Wilcoxon (paired) or Mann-Whitney (unpaired), non-normally distributed data. All statistical tests are 2-sided, all replicates are biologically independent samples.
Extended Data Figure 2.
Extended Data Figure 2.. Corresponds to Figure 2.
a. Plot shows % IL-9+ of d8 human Th9 cells restimulated with vehicle (n=7), IL-1β (n=3), IL-18 (n=4), IL-33 (n=4), IL-36α (n=7), or IL-36γ (n=7). b-c. Timelines show experimental design; graphs shows % IL-9+ (n=6) for human non-restimulated T cells differentiated as in Fig 1a, with STAT5 inhibitor or STAT6 inhibitor from d0-5 (b) or d5-8 (c). d-f. Box plot shows concentration (pg/mL, ELISA) of IL-2 (d), IL-4 (e), and IL-9 (f) in supernatants of human in vitro differentiated Th1- or Th9 (d5), or Th2 (d14) cells, after 48h restimulation.. g,h. d8 human Th9 cells were restimulated with escalating doses of IL-2 (b) (2, 20, or 200 ng/mL) or IL-4 (c) (6, 60, or 500 ng/mL) (n=3). i,j. Representative flow plots (i) and box plot (j) show % IL-9+ cells in resting (d4) murine Th9 cells restimulated with IL-2 + IL-4 (n=10) k. Box plot shows pooled results d8 human Th9 cells restimulated with vehicle (n=9), IL-6 (n=3), IL-7 (n=5), IL-12 (n=3), IL-21 (n=3), or TSLP (n=4). l, m. Box plots show pooled (n=6) mean fluorescence intensity (MFI) of pSTAT5 (l) and pSTAT6 (m) in d8 human IL-9+ and IL-9 Th9 cells restimulated with IL-2, IL-4, or IL-2 + IL-4. n. Box plots show pooled (n=3) % IL-9+ d8 human Th9 cells stimulated with IL-2 and IL-4 in the presence of STAT5 or STAT6 inhibitor. For all experiments: paired or unpaired t-test, normally distributed data; Wilcoxon (paired) or Mann-Whitney (unpaired), non-normally distributed data. Box plots show all data points (min to max, lines at median). All statistical tests are 2-sided, all replicates are biologically independent samples.
Extended Data Figure 3.
Extended Data Figure 3.. Corresponds to Figure 3.
a b. Line graph shows % IL-9+ cells of human Th9 differentiated as in Fig 1a. Cells were restimulated with vehicle, IL-2, IL-4, or IL-2 + IL-4 (a, n=6); b. on d5 (n=14), d8/d11 (n=17), d15 (n=16), and d20 (n=11), cells were restimulated with PMA + ionomycin (P/I) or P/I + IL-2 + IL-4. c,d. Line graph shows % IL-9+ cells of murine Th9 differentiated as in Fig 1d. Cells were restimulated with vehicle, IL-2, IL-4, or IL-2 + IL-4 (c, n=4). d. On d3 (n=12), d4 (n=11), d5 (n=9), d6 (n=3), d7 (n=3), and d8 (n=6), cells were restimulated P/I or P/I + IL-2 + IL-4. e, f. Representative flow plots (e) and graphs (f) show % IL-9+ of circulating Th9 cells stimulated with P/I or P/I + IL-2 + IL-4, from healthy volunteer (HV, n=5) or atopic patients (AD, n=14). g. Line graphs shows pooled results (n=5) for % IL-9+ cells from IL-9 reporter (INFER) mice, sorted on d3 and maintained as in Fig 1d. Cells were restimulated with vehicle, IL-2 + IL-4, P/I or P/I + IL-2 + IL-4, p-value is for d4. h. Bar graphs show viability (n=4) for Th9 cells. i. Venn diagram shows generation of “allergic Th9” cassette using: HDM-reactive circulating Th9 cells from allergic patients, Th9 clones from healthy subjects, pulmonary Th9 cells from IL-9 reporter mice, and in vitro differentiated Th9 cells. Genes differentially expressed in >1 dataset were selected. j. Bar graph shows pathway enrichment scores and false discovery rates (FDR, DAVID) for the “allergic Th9” cassette. k. Scatterplot shows enrichment score (GSEA) and FDR for correlation (Pearson) of STAT1, STAT3, STAT4, STAT5, and STAT6 target genes with murine Il9 expression and human IL9 expression. For all experiments: paired or unpaired t-test, normally distributed data; Wilcoxon (paired) or Mann-Whitney (unpaired), non-normally distributed data. Bar/line graphs show mean ± SEM; box plots show all data points (min to max, lines at median). All statistical tests are 2-sided, all replicates are biologically independent samples.
Extended Data Figure 4.
Extended Data Figure 4.. Corresponds to Figure 4.
a, b. Genome tracks show poised enhancer (H3K4m1), active promoter (H3K4m3), active enhancer (H3K27Ac) marks, and accessibility (ATAC) of the murine Th2 (a, Il4-Il13-Rad50-Il5) and Gzmb loci at different time points during Th9 differentiation and resting. c, d. ATAC-seq tracks show the human extended IL9 locus including the promoter (Il9p), downstream enhancer (DS) and upstream enhancers 1-4 (E1-E4), in naïve T cells, Th1 cells (d5), and Th9 cells (d5) (c), and in ex vivo naïve, Th1, Th2, and Th17 cells from ENCODE (d). e, f. Genome tracks show poised enhancer (H3K4m1), active promoter (H3K4m3), active enhancer (H3K27Ac) marks, and accessibility (ATAC) of the human Th2 (e, IL4-IL13-RAD50-IL5) and GZMB loci at different time points during Th9 differentiation and resting. g. Heatmap shows Pearson correlation of Il9/IL9 expression, ATAC-seq tag density, H3K4me1 tag density, H3K4me3 tag density, and H3K27Ac tag density with those of Il4/IL4, Il13/IL13, Rad50/RAD50, and Il5/IL5.
Extended Data Figure 5.
Extended Data Figure 5.. Corresponds to Figure 5.
a-c. Pooled counts of pulmonary CD45+TCRβ+CD4+CD44+IL-13+ cells (a, n=8, PBS; n=13, papain), CD45+TCRβ+CD4+CD44+IL-17A+ cells (b, n=3, PBS; n=6, papain), and CD45+TCRβ+CD4+CD44+IL-2+ cells (c, n=8, PBS; n=13, papain) from mice treated with isotype vs. αMHC2 between papain sensitization and challenge. d. Th9 cells were differentiated in the presence of vehicle vs. BMS509744 (Itk inhibitor; 0.5 μM, 1 μM, 1.5 μM) and restimulated with αCD3 + αCD28 (n=3) e-f. Bar graphs (n=7) show %IL-9+ (e) of Th9 and %IL-4+ (f) of Th2 cells restimulated with αCD3 + αCD28 and vehicle vs. BMS509744 (0.5 μM, 1 μM), g. Design of inducible Itk-deleted mouse. Itkflox/flox were crossed ERT-Cre mice to generate ItkERT mice. h. Representative flow plot and bar graph show %IL-9+ cells of Th9 cells from TAM-treated (Itk-deleted, n = 3) vs. TAM-untreated (n=5) mice. i. Timeline shows model of papain-induced airway inflammation with Itk deletion. Mice were treated with vehicle vs. tamoxifen between sensitization and challenge. j. Gel shows that injection of tamoxifen results in deletion of WT Itk gene in mice from (i). k-n. Representative periodic acid-Schiff (PAS) stained images (k), pooled histology scores (l, n=3, PBS; n=5, Papain), pulmonary CD45+TCRβ+CD4+CD44+IL-9+ (Th9) (m, n=5, PBS; n=10, Papain), and pulmonary CD45+TCRβ+CD4+CD44+IL-13+ (Th2) cell counts (n, n=3, PBS; n=5, Papain), from Itkf/f treated with vehicle vs. tamoxifen as in (i). o-r. Pooled counts of pulmonary CD45+CD4 IL-9+ cells (o, n=5, PBS; n=8, Papain), CD45+TCRβ+CD4+CD44+IL-13+ cells (Th2) (p, n=5, PBS; n=8, Papain), CD45+TCRβ+CD4+CD44+IL-17A+ cells (Th17) (q, n=4, PBS; n=7, Papain), and CD45+TCRβ+CD4+CD44+IL-2+ cells (r n=4, PBS; n=7, Papain) ILC2-deficient mice treated with isotype vs. αMHC2 between papain sensitization and challenge. For all experiments: paired or unpaired t-test, normally distributed data; Wilcoxon (paired) or Mann-Whitney (unpaired), non-normally distributed data. Bar graphs show mean ± SEM; box plots show all data points (min to max, lines at median). All statistical tests are 2-sided, all replicates are biologically independent samples from ≥ 2 independent experiments.
Extended Data Figure 6.
Extended Data Figure 6.. Corresponds to Figure 6.
a. Timeline shows Th9 adoptive transfer-induced airway inflammation. Ovalbumin (OVA)-specific OT-ii Th9 cells were differentiated in vitro, sorted for IL-9+ cells, and adoptively transferred. Recipient mice were treated with IL-2 and IL-4 intratracheally and intranasally. b. Timeline shows papain-induced airway inflammation with tofacitinib; mice were treated with vehicle vs. tofacitinib between sensitization and challenge. c-e. Pooled counts of pulmonary CD45+TCRβ+CD4+CD44+IL-13+ (c), CD45+TCRβ+CD4+CD44+IL-17A+ (d), and CD45+TCRβ+CD4+CD44+IL-2+ cells (e) mice treated with vehicle vs. tofacitinib between sensitization and challenge. n=6 (PBS/PBS), 5 (PBS/tofa), 10 (Papain/MC and Papain/tofa) f. Timeline shows papain-induced airway inflammation with tofacitinib and αIL-9. Mice were treated as in (b) but also received isotype or αIL-9 every other day. g-k. Pooled counts of pulmonary CD45+TCRβ+CD4+CD44+IL-9+ (g), CD45+TCRβ+CD4+CD44+IL-13+ (h), and live CD45+TCRβ+CD4+CD44+IL-4+ cells (i), representative periodic acid-Schiff (PAS) stained images (j) and pooled histology scores (k) of mice treated as in Fig S6f; n=5 (PBS/isotype/MC), 8 (Papain/isotype/MC), and 10 (Papain/αIL-9/MC and Papain/αIL-9/tofa). For all in vivo experiments: Bar graphs show mean ± SEM; 2-sided Mann-Whitney (unpaired). All replicates are biologically independent samples from ≥ 2 independent experiments. l-o. Line graphs show expression (mean ± SEM) over 96 hours of IL9 (l), STAT5A (m), STAT5B (n), and STAT6 (o), in skin of nickel-allergic patients exposed to nickel over 96 hours (n=7) p. Graph shows normalized enrichment scores and false discovery rate (GSEA) for expression of “allergic Th9” cassette, STAT5-induced genes, and STAT6-induced genes in 7h-nickel-exposed, 48h-nickel-exposed, and 96h-nickel-exposed skin relative to pre-exposed/unexposed skin.
Extended Data Figure 7.
Extended Data Figure 7.. Reporting of gating strategy and validation for murine cell studies.
a-f. Representative flow cytometric plots show gating strategies for naïve T cell sorting (a), Th9 sorting for transfer experiments (b), for in vitro differentiated Th9, Th1, and Th2 cells shown in Figures 1-3 and S1-S3 (c), for in vivo memory T helper subsets in Figures 5-6 and S5-S6 (d-e), and for adoptively transferred CD45.1+ Th9 cells analyzed in murine lung two days after transfer (f). g. Timeline shows protocol for validation of MHC2 blocking antibody in vivo. Mice were sensitized to ovalbumin (OVA) intraperitoneally on d0 and d7, then challenged on d13 and d14. MHC blocking antibody was administered with each dose of OVA. Bar graphs show results of MHC2 validation experiment. Blockade of MHC2 reduced histology scores, BAL Eosinophil counts, and lung-infiltrating IL-4+ and IL-13+ (Th2) cell counts. Mean ± SEM, 2-sided Mann Whitney, all data points represent biological replicates.
Extended Data Figure 8.
Extended Data Figure 8.. Reporting of gating strategy for human cell studies.
Representative flow cytometric plots show gating strategies for naïve T cell sorting (a), gating for in vitro differentiated Th9, Th1, and Th2 cells shown in Figures 1-3 and S1-S3 (b), and for ex vivo circulating memory Th9 cells in stimulated PBMC samples (c).
Figure 1.
Figure 1.. Resting Th9 cells uniquely produce IL-9 independent of T cell receptor (TCR) restimulation, downstream of paracrine STAT-dependent cytokines.
a. Timeline shows differentiation protocol for human T helper cells. Naïve CD4+ T cells from healthy volunteers were activated for 5 days with αCD3, αCD28, IL-2, and subset-promoting cytokines and antibodies. After 5 days, αCD3/αCD28 were withdrawn, and cells were cultured with IL-2 and subset-promoting cytokines and antibodies. b, c. Representative flow plot (b) and summary data (c) for % of cytokine production in human resting (d8, rested for 3 days) Th1 (IFN-γ+, n = 9), Th2 (IL-13+, n = 9), and Th9 (IL-9+, n = 13) with or without PMA and Ionomycin (P/I). d. Timeline shows differentiation protocol for murine T helper cells. Naïve CD4+ T cells from WT C57BL/6 mice were activated for 3 days with αCD3, αCD28, IL-2, and subset-promoting cytokines and antibodies. After 3 days, αCD3/αCD28 were withdrawn, and cells were cultured with IL-2 and subset-promoting cytokines and antibodies. e, f. Representative flow plot (e) and summary data (f) for % of cytokine production in resting (d4) murine Th1 (IFN-γ+, n = 3), Th2 (IL-13+, n = 4), and Th9 (IL-9+, n = 9) cells restimulated with vehicle control vs. P/I. g, h. Representative flow plots (g) and summary data (h) show % IL-9+ cells of resting (d8) human Th9 cells restimulated with supernatants from Th1 (n = 8), Th2 (n = 6), and Th9 (n = 8) cells. i, j. Representative flow cytometry plot (i) and summary data (j) show % IL-9+ cells of resting (d8) human Th9 cells restimulated with Th9 supernatants in the presence of vehicle, tofacitinib (JAK-STAT inhibitor), FK506 (calcineurin/NFAT inhibitor), BAY11 (NF-κB inhibitor), or CAY10571 (p38 MAPK inhibitor) (n = 7). For all experiments: paired or unpaired t-test, normally distributed data; Wilcoxon (paired) or Mann-Whitney (unpaired), non-normally distributed data. Box plots show all data points (min to max, lines at median). All statistical tests are 2-sided, all replicates are biologically independent samples.
Figure 2.
Figure 2.. IL-2 and IL-4 rapidly induce bystander activation of resting Th9 cells through STAT5 and STAT6.
a, b. Representative flow plots (a) show pSTAT5, pSTAT6, and IL-9 expression in non-restimulated resting (d8 from start of culture) human cells differentiated from naïve T cells under Th9-promoting conditions (IL-2, IL-4, TGF-β, IL-1β, αIFN-γ). Representative histograms (a) and summary data (b) show mean fluorescence intensity (MFI) of pSTAT5 and pSTAT6 in resting human IL-9+ and IL-9 cells differentiated under Th9-promoting conditions. Bar graphs show pooled results (n = 6). c, d. Representative cytometry plot (c) and summary data (d) show % IL-9+ cells of resting (d8 from start of culture) human Th9 cells restimulated for 6 hours with vehicle, hIL-2 (n = 8), hIL-4 (n = 8),h IL-9 (n = 5), or a combination of the three (n = 8). e, f. Representative flow cytometric plot (e) and summary data (f) show % IL-9+ cells of resting (d8) human Th9 cells restimulated for 6 hours with IL-2 + IL-4 in the presence of vehicle, tofacitinib (JAK-STAT inhibitor), FK506 (calcineurin/NFAT inhibitor), BAY11 (NF-κB inhibitor), or CAY10571 (p38 MAPK inhibitor) (n = 6). g, h. Representative flow cytometric plot (g) and summary data (h) show % IL-9+ cells of circulating memory CD4+ T cells (CD3+/CD4+/CD8/CD45RO+ cells) stimulated with vehicle vs. IL-2 + IL-4. Cells derive from healthy volunteer peripheral blood mononuclear cells (HV PBMC, n = 6), atopic dermatitis patient PBMC (AD, n = 14), and HV tonsils (n = 12). For all experiments: paired or unpaired t-test, normally distributed data; Wilcoxon (paired) or Mann-Whitney (unpaired), non-normally distributed data. Box plots show all data points (min to max, lines at median). All statistical tests are 2-sided, all replicates are biologically independent samples.
Figure 3.
Figure 3.. STAT-dependent cytokines induce IL9 transcription in recently activated Th9 cells.
a, b. Graphs show total (a) and nascent (b) IL9 expression in d8 human Th9 cells treated with vehicle or IL-2 + IL-4. (n = 3). c, d. Representative flow plots (c) and graphs (d) show % IL-9+ cells of human Th9 differentiated with αCD3/αCD28 for 5 days then continued with Th9-promoting cytokines/antibodies, but without αCD3/αCD28. On d5 (n = 14), d8/d11 (n = 17), d15 (n = 16), and d20 (n = 11), cells were restimulated with vehicle or IL-2 + IL-4. e, f. Representative flow plots (e) and graphs (f) show % IL-9+ cells of murine Th9 differentiated with αCD3/αCD28 for 3 days, then continued with other Th9-promoting cytokines/antibodies, but without αCD3/αCD28. On d3 (n = 12), d4 (n = 11), d5 (n = 9), d6 (n = 3), d7 (n = 3), and d8 (n = 6), cells were restimulated with vehicle or IL-2 + IL-4. g. Representative flow plots show % IL-9+ cells from IL-9 reporter (INFER) mice. IL-9+ cells were sorted on d3 and maintained in Th9-promoting conditions without αCD3/αCD28. Cells were restimulated on d4 and d8 with vehicle or IL-2 + IL-4. h. Graph shows normalized enrichment score (NES) and false discovery rate (FDR) of Th9 cassette (GSEA) in antitumor Th9 cells; IL9high atopic dermatitis skin; house-dust-mite-stimulated T cells from allergic subjects; d3-murine in vitro differentiated Th9; d5-human in vitro differentiated Th9. i,j. Heatmaps show average fold-change in gene expression of in vitro differentiated murine (n = 3, i) and human (n = 4, j) Th9 cells vs. naïve T cells at various time points, for “allergic Th9” genes with dynamic enrichment (FC > 2, FDR < 0.05) in murine (d3/4 vs. d0/8) and human (d5/8 vs. d0/15) cells. k,l. Enrichment plots show Pearson correlation of “allergic Th9” genes with Il9/IL9 expression over time in murine (k) and human (l) Th9 cells. For all experiments: paired or unpaired t-test, normally distributed data; Wilcoxon (paired) or Mann-Whitney (unpaired), non-normally distributed data. For boxplots/line graphs, error bars show ± SEM. All statistical tests are 2-sided, all replicates are biologically independent samples.
Figure 4.
Figure 4.. Prolonged resting of Th9 cells reduces accessibility of STAT5 binding sites and type 2 cytokine loci, including critical IL9 enhancers.
a,b. Bar graphs show enrichment (2-sided Fisher’s t-test) in murine (a) and human (b) Th9 cells of dynamically expressed genes, dynamic ATAC-seq (accessibility) peaks, dynamic H3K4Me1 (poised enhancer) peaks, dynamic H3K4Me3 (active promoter) peaks, and dynamic H3K27Ac (active enhancer) peaks in loci/genes mapping to the ‘allergic Th9” cassette vs. all coding gene loci. c. Heatmap (left) shows log (p-value, HOMER de novo motif discovery) for motif enrichment of transcription factors (TF) in human and murine dynamic peaks. All motifs with significant enrichment in at least 1 murine peak set and at least 1 human peak set are shown. Heatmap (right) shows log2 (average fold-change) in gene expression of TFs with motif enrichment in dynamic peaks. Values are shown for murine and human Th9 at various time points vs. naïve T cells. * transiently upregulated in murine Th9 (FC >2, FDR < 0.05, d3-d4 vs. d0-d8) # transiently upregulated in human Th9 (FC >2, FDR < 0.05, d5-d8 vs. d0-d15); d, e. Genome tracks show poised enhancer (H3K4Me1), active promoter (H3K4Me3), active enhancer (H3K27Ac) marks, and accessibility (ATAC) of the murine Il9 (d) and human IL9 (e) extended locus including the promoter (Il9p), downstream enhancer (DS) and upstream enhancers 1-4 (E1-E4), at different time points during Th9 differentiation and resting. All replicates are biologically independent samples.
Figure 5.
Figure 5.. Th9 cells promote TCR-independent airway pathology in vivo.
a. Enrichment plots show a normalized enrichment score and FDR (GSEA) for the average, or net, transcriptome of Th9 vs. non-Th9 cells for the following Th9-related and activation-dependent transcription factors (TFs): STAT1, STAT3, STAT4, STAT5, STAT6, IRF4, ,NF-kB, NFAT, and JunB. A positive score indicates enrichment in Th9 cells, and a negative score indicates enrichment in non-Th9 cells. A neutral score indicates no significant enrichment. b. Timeline shows model of papain-induced airway inflammation with MHC2 blockade. Mice were sensitized and rechallenged with intranasal papain, and treated with isotype vs. αMHC2 during rechallenge. c-e. Representative periodic acid-Schiff (PAS) stained images (c), pooled histology scores (d), and live CD45+TCRβ+CD4+CD44+IL-9+ (Th9) cell counts (h) from lungs of mice exposed to papain and treated with isotype vs. αMHC II as in (b) (arrows, inflammatory infiltrate; triangles, mucus; n= 8, PBS; n = 13, Papain) f-h. Representative periodic acid-Schiff (PAS) stained images (e), pooled histology scores (f), and live CD45+TCRβ+CD4+CD44+IL-9+ (Th9) cell counts (h) from lungs of Type 2 innate lymphoid cell (ILC2) deficient mice exposed to papain and treated with αMHC II or isotype as in (b) (arrows, inflammatory infiltrate; triangles, mucus; n= 5, PBS; n = 7, Papain-iso; n = 9, Papain-αMHCII. For all in vivo experiments, statistical tests are 2-sided Mann-Whitney; all data are biologically independent samples from ≥ 2 replicate experiments.
Figure 6.
Figure 6.. STAT-dependent Th9 bystander activation promotes allergic disease and is associated with responsiveness to JAK inhibitors.
a-c. Representative periodic acid-Schiff (PAS) stained images (a), pooled histology scores (b), and live CD45.1+TCRβ+CD4+CD44+IL-9+ (adoptively transferred Th9) cell counts (c) in lungs of WT mice who underwent adoptive transfer of PBS or Th9 cells from congenic donors, followed by intratracheal and intranasal challenge with PBS or IL-2 + IL-4; 3 replicates, n = 2 per replicate; arrows, inflammatory infiltrate; triangles, mucus. d-f. Representative PAS-stained images (d), pooled histology scores (e), and live CD45+TCRβ+CD4+CD44+IL-9+ (Th9) cell counts (f) from lungs of mice exposed to chronic papain-induced airway inflammation and treated with methylcellulose (MC) or tofacitinib; n = 6 (PBS/MC), n = 5 (PBS/tofa), n = 11 (Papain/MC), n = 10 (Papain/tofa); arrows, inflammatory infiltrate; triangles, mucus. In vivo data are shown as mean ± SEM, Mann-Whitney. g. Bar graph shows RMA-normalized IL9 expression in house dust mite (HDM) treated CD4+ T cells from healthy volunteers vs. patients with allergic disease. Scatterplot shows normalized enrichment scores (NES; Gene Set Enrichment Analysis, GSEA) and FDR for genes induced by the following TFs in allergic vs. healthy CD4+ cells: STAT1; STAT3; STAT4; STAT5; STAT6. h. Bar graph shows RMA-normalized IL9 expression in HDM-treated CD4+ T cells from allergic patients in which IL9 expression is lower than mean expression for the dataset (IL9low) vs. higher than mean for the dataset (IL9high). Scatterplot shows NES (GSEA) and FDR for genes induced by STAT1, STAT3, STAT4, STAT5, and STAT6 in IL9low vs. IL9high CD4+ cells. i. GSEA plots show NES and FDR for STAT5- and STAT6-induced genes in d29 vs. d0 skin from AD patients treated with the JAK-SYK inhibitor ASN002, 80 mg daily. All statistical tests are 2-sided; all replicates are biologically independent samples.

Comment in

  • JAKing up IL-9 expression in TH9 cells.
    Muñoz-Paleta O, Licona-Limón P. Muñoz-Paleta O, et al. Nat Immunol. 2023 Jun;24(6):891-892. doi: 10.1038/s41590-023-01509-x. Nat Immunol. 2023. PMID: 37142770 No abstract available.

References

    1. Immunology, A. A. o. A. A. a. Allergy Statistics, <https://www.aaaai.org/About/News/For-Media/Allergy-Statistics> (2021).
    1. Angkasekwinai P & Dong C IL-9-producing T cells: potential players in allergy and cancer. Nat Rev Immunol 21, 37–48, doi: 10.1038/s41577-020-0396-0 (2021). - DOI - PubMed
    1. Shimbara A et al. IL-9 and its receptor in allergic and nonallergic lung disease: increased expression in asthma. J Allergy Clin Immunol 105, 108–115, doi: 10.1016/s0091-6749(00)90185-4 (2000). - DOI - PubMed
    1. Brough HA et al. IL-9 is a key component of memory TH cell peanut-specific responses from children with peanut allergy. J Allergy Clin Immunol 134, 1329–1338 e1310, doi: 10.1016/j.jaci.2014.06.032 (2014). - DOI - PubMed
    1. Abdelilah S et al. Functional expression of IL-9 receptor by human neutrophils from asthmatic donors: role in IL-8 release. J Immunol 166, 2768–2774, doi: 10.4049/jimmunol.166.4.2768 (2001). - DOI - PubMed

Methods-only References

    1. Herndler-Brandstetter D et al. KLRG1(+) Effector CD8(+) T Cells Lose KLRG1, Differentiate into All Memory T Cell Lineages, and Convey Enhanced Protective Immunity. Immunity 48, 716–729 e718, doi: 10.1016/j.immuni.2018.03.015 (2018). - DOI - PMC - PubMed
    1. Zhu J et al. Conditional deletion of Gata3 shows its essential function in T(H)1-T(H)2 responses. Nat Immunol 5, 1157–1165, doi: 10.1038/ni1128 (2004). - DOI - PubMed
    1. Gurram RK et al. Crosstalk between ILC2s and Th2 cells varies among mouse models. Cell Rep 42, 112073, doi: 10.1016/j.celrep.2023.112073 (2023). - DOI - PMC - PubMed
    1. Liu P, Jenkins NA & Copeland NG A highly efficient recombineering-based method for generating conditional knockout mutations. Genome Res 13, 476–484, doi: 10.1101/gr.749203 (2003). - DOI - PMC - PubMed
    1. Corces MR et al. An improved ATAC-seq protocol reduces background and enables interrogation of frozen tissues. Nat Methods 14, 959–962, doi: 10.1038/nmeth.4396 (2017). - DOI - PMC - PubMed

References

    1. Seumois G et al. Single-cell transcriptomic analysis of allergen-specific T cells in allergy and asthma. Sci Immunol 5, doi: 10.1126/sciimmunol.aba6087 (2020). - DOI - PMC - PubMed
    1. Micosse C et al. Human "TH9" cells are a subpopulation of PPAR-gamma(+) TH2 cells. Sci Immunol 4, doi: 10.1126/sciimmunol.aat5943 (2019). - DOI - PubMed
    1. Schwartz DM et al. Retinoic Acid Receptor Alpha Represses a Th9 Transcriptional and Epigenomic Program to Reduce Allergic Pathology. Immunity 50, 106–120 e110, doi: 10.1016/j.immuni.2018.12.014 (2019). - DOI - PMC - PubMed

Publication types