. 2023 Jul;7(7):1216-1227.
doi: 10.1038/s41562-023-01579-9. Epub 2023 Apr 27.

Participation bias in the UK Biobank distorts genetic associations and downstream analyses

Affiliations

Participation bias in the UK Biobank distorts genetic associations and downstream analyses

Tabea Schoeler et al. Nat Hum Behav. 2023 Jul.

Abstract

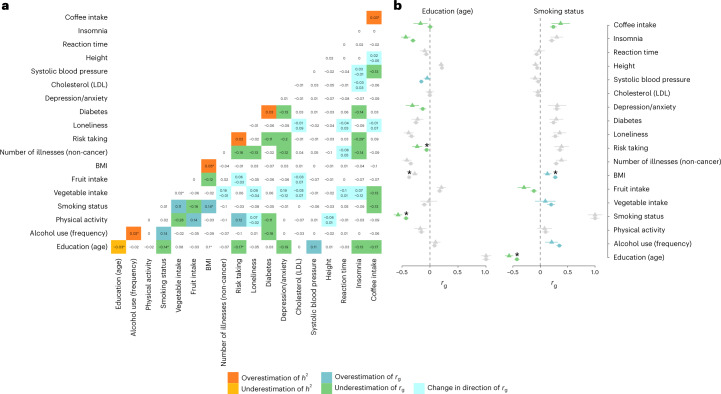
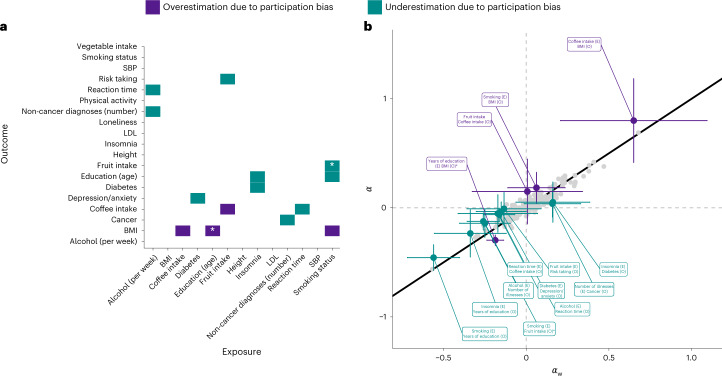
While volunteer-based studies such as the UK Biobank have become the cornerstone of genetic epidemiology, the participating individuals are rarely representative of their target population. To evaluate the impact of selective participation, here we derived UK Biobank participation probabilities on the basis of 14 variables harmonized across the UK Biobank and a representative sample. We then conducted weighted genome-wide association analyses on 19 traits. Comparing the output from weighted genome-wide association analyses (neffective = 94,643 to 102,215) with that from standard genome-wide association analyses (n = 263,464 to 283,749), we found that increasing representativeness led to changes in SNP effect sizes and identified novel SNP associations for 12 traits. While heritability estimates were less impacted by weighting (maximum change in h2, 5%), we found substantial discrepancies for genetic correlations (maximum change in rg, 0.31) and Mendelian randomization estimates (maximum change in βSTD, 0.15) for socio-behavioural traits. We urge the field to increase representativeness in biobank samples, especially when studying genetic correlates of behaviour, lifestyles and social outcomes.


Conflict of interest statement

The authors declare no competing interests.

Figures

Fig. 1
Fig. 1. The impact of participation bias in genetic studies.
ac, The relationships between a genetic variant (G), an exposure (X) or outcome (Y), and study participation (Z). Panel a illustrates the effect of participation bias in GWA studies, where Z is a common consequence of G and Y (red dotted line). Conditioning on a common consequence (Z) induces a non-causal association between G and Y. Panels b,c illustrate the effect of participation bias in MR studies, where bias occurs if Z is a consequence of either X (b) or Y (c). Conditioning on Z induces an association between the genetic variant and confounders, thereby violating the MR assumption of exchangeability. This figure is a simplified illustration of how participation bias can impact results obtained from two commonly employed methods in genomic studies. For further examples illustrating the impact of selection bias, see Hernán et al..
Fig. 2
Fig. 2. Performance of the UKBB probability weights.
a, Truncated (*) density curves of the normalized probability weights (win) for UKBB participants, ranging from 0.02 to 50.01. b, Standardized coefficients (and 95% confidence intervals) of variables predicting UKBB participation (HSE = 0; UKBB = 1) in univariate logistic regression models. Coefficients are provided for all UKBB participants and for males and females separately. c, Correlation coefficients among all auxiliary variables within the UKBB (obtained from weighted and unweighted analyses) and within the HSE. Highlighted in blue are results where the coefficients between the UKBB (rUKBB) and the reference sample (rHSE) deviated (rdiff > 0.05, where rdiff = |rHSE − rUKBB|). d, Percentage change (for categorical variables) and change in means as a function of weighting, obtained for a number of health-related UKBB phenotypes, including the auxiliary variables (blue) and variables not used to construct the weights. Percentage change was estimated as the difference between the weighted (pw) and unweighted proportion (p), divided by the unweighted value ((pw − p) / p × 100). Change in means was expressed as a standardized mean difference, estimated as the difference between the unweighted mean (m) and the weighted mean (mw), divided by the unweighted standard deviation (mw − m/s.d.).
Fig. 3
Fig. 3. SNP estimates from weighted and unweighted genome-wide analyses.
a,b, Summary of the comparison between SNP effects obtained from wGWA and standard GWA analyses on 19 traits. Panel a summarizes the proportions of overestimated and underestimated SNP effects as a result of participation bias. Shown in b are the numbers and proportions of SNPs reaching genome-wide significance in standard GWA, wGWA or both (GWA and wGWA). The scatter plots to the right plot the weighted (|𝛽w|) against the unweighted (|𝛽|) SNP effects for four selected traits.
Fig. 4
Fig. 4. GWA study on the liability to UKBB participation.
Shown are the genetic correlations (rg) and corresponding 95% confidence intervals of UKBB participation (n standard GWA = 283,749) with traits indexing participatory behaviour (in green) and other traits (in blue) (including publically available summary statistics generated using standard GWA. SBP, systolic blood pressure; IR,: Item-response theory.
Fig. 5
Fig. 5. Weighted SNP heritability and genetic correlation estimates.
a, Differences in SNP heritability (hDIFF2=h2hw2) and genetic correlations (rg,DIFF = |rg|  |rg,w|) obtained from weighted and standard GWA analyses. The diagonal shows the differences in SNP heritability, where biases leading to overestimation (hDIFF2 > 0.02) are plotted in orange and biases leading to underestimation (hDIFF2 < −0.02) are plotted in yellow. The off-diagonal highlights overestimated genetic correlations (rg,DIFF > 0.1) in blue and underestimated genetic correlations (rg,DIFF < −0.1) in green. Tiles coloured in turquoise index genetic correlations where rg and rg,w show opposite directions (with rg printed at the top and rg,w printed at the bottom of the tile). b, Estimates of genetic correlations (rg shown as circles; rg,w shown as triangles) and the corresponding 95% confidence intervals for two selected traits. The asterisks indicate estimates showing significant differences (PFDR < 0.05). All P values are from two-sided tests and are corrected for multiple testing using FDR correction (controlled at 5%).
Fig. 6
Fig. 6. Effect of participation bias on MR estimates of exposure–outcome associations.
a,b, Summary of results obtained from weighted (α^w) and standard (α^) MR. MR estimates subject to overestimation (α^α^w>0.1) as a result of participation bias are highlighted in violet. MR estimates subject to underestimation (α^α^w<0.1) are highlighted in cyan. The asterisks highlight results where α^ and α^w showed significant (PFDR < 0.05) differences. The error bars (b) indicate the 95% confidence intervals corresponding to α^ and α^w. All P values are from two-sided tests and are corrected for multiple testing using FDR correction (controlled at 5%).

References

    1. Abdellaoui A, Verweij KJH. Dissecting polygenic signals from genome-wide association studies on human behaviour. Nat. Hum. Behav. 2021;5:686–694. doi: 10.1038/s41562-021-01110-y. - DOI - PubMed
    1. Sjaarda, J. & Kutalik, Z. Partner choice, confounding and trait convergence all contribute to phenotypic partner similarity. Nat. Hum. Behav.10.1038/s41562-022-01500-w (2023). - PMC - PubMed
    1. Howe LJ, et al. Within-sibship genome-wide association analyses decrease bias in estimates of direct genetic effects. Nat. Genet. 2022;54:581–592. doi: 10.1038/s41588-022-01062-7. - DOI - PMC - PubMed
    1. Border R, et al. Assortative mating biases marker-based heritability estimators. Nat. Commun. 2022;13:660. doi: 10.1038/s41467-022-28294-9. - DOI - PMC - PubMed
    1. Fry A, et al. Comparison of sociodemographic and health-related characteristics of UK Biobank participants with those of the general population. Am. J. Epidemiol. 2017;186:1026–1034. doi: 10.1093/aje/kwx246. - DOI - PMC - PubMed

Publication types

LinkOut - more resources