. 2023 Dec;7(12):1583-1601.
doi: 10.1038/s41551-023-01033-1. Epub 2023 Apr 27.

A one-pot isothermal Cas12-based assay for the sensitive detection of microRNAs

Affiliations

A one-pot isothermal Cas12-based assay for the sensitive detection of microRNAs

He Yan et al. Nat Biomed Eng. 2023 Dec.

Abstract

The use of microRNAs as clinical cancer biomarkers is hindered by the absence of accurate, fast and inexpensive assays for their detection in biofluids. Here we report a one-step and one-pot isothermal assay that leverages rolling-circle amplification and the endonuclease Cas12a for the accurate detection of specific miRNAs. The assay exploits the cis-cleavage activity of Cas12a to enable exponential rolling-circle amplification of target sequences and its trans-cleavage activity for their detection and for signal amplification. In plasma from patients with pancreatic ductal adenocarcinoma, the assay detected the miRNAs miR-21, miR-196a, miR-451a and miR-1246 in extracellular vesicles at single-digit femtomolar concentrations with single-nucleotide specificity. The assay is rapid (sample-to-answer times ranged from 20 min to 3 h), does not require specialized instrumentation and is compatible with a smartphone-based fluorescence detection and with the lateral-flow format for visual readouts. Simple assays for the detection of miRNAs in blood may aid the development of miRNAs as biomarkers for the diagnosis and prognosis of cancers.


Conflict of interest statement

Competing interests

H.Y. and Y.Z. are co-inventors on a United States provisional patent application (63/313,870) based on this work. Y.Z. holds equity interest in Clara Biotech and serves on its scientific advisory board. The other authors declare no competing interests.

Figures

Fig. 1 |
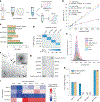
Fig. 1 |. The one-pot EXTRA-CRISPR miRNA assay.
a, The major components and workflow of EXTRA-CRISPR assay. The padlock probe for RCA is engineered with a split ligation module for target miRNA binding and a CRISPR–Cas12a detection module whose complementary sequence activates a Cas12a–crRNA complex. miRNA sequences are extracted from a sample, annealed with the padlock and then added to a reaction tube containing the enzymes, reporter and other reagents. The one-pot assay is carried out at 37 °C in a qPCR apparatus for real-time detection of the fluorescence signal. b, The proposed mechanism of the EXTRA-CRISPR. This assay harnesses both cis-cleavage and trans-cleavage functions of the CRISPR–Cas12a system to convert linear RCA to an exponential amplification method for miRNA detection. Briefly, the Cas12a RNP can bind and cleave the long ssDNA amplicon of RCA by its cis-activity, which generates many secondary primers containing the target sequence to initiate subsequent RCA cycles, resulting in exponential amplification of the target. Meanwhile, the amplicon-activated Cas12a RNP non-specifically cleaves the ssDNA reporters to create and amplify fluorescence signal.
Fig. 2 |
Fig. 2 |. Mechanistic studies of EXTRA-CRISPR.
a, Effect of the padlocks without and with a PAM sequence on miR-21 detection. The assays were conducted with 1 pM miR-21 and 100 nM of each padlock probe. NC, negative control assay with a buffer blank. RFU, relative fluorescence units. b, Real-time one-pot detection of serial 10-fold dilutions of miR-21 from 1 pM to 1 nM with 1 nM Cas12a RNP. Control assays were conducted with one of three enzymes left out each time. c, Gel analysis of the products from the reactions in b; an image of the full scans is provided in Source Data. d, Assessment of Cas12a activities on RCA amplicons in a two-step fashion. In this case, ligation–RCA was first conducted, and then the products were treated with varying amounts of RNP. M, DNA marker; an image of the full scans is provided in Source Data. e, EXTRA-CRISPR assays using the cleaved RCA products from reactions 2 and 3 in d as the targets. f, EXTRA-CRISPR detection of the long-cut and short-cut extracts recovered from the gel bands in lane 2 in d. Despite its lower quantity, the short-cut extract yielded a faster reaction kinetics than the long-cut extract. g, Synthetic ssDNA mimicking the short-cut RCA product effectively triggers the EXTRA-CRISPR assay to produce quantitative signals. h, Exponential amplification of this synthetic short cut was observed in the one-pot assay, as opposed to linear amplification of the synthetic short cut in the two-step assay. The target concentration in both cases is 1 pM. i, Illustration of the length-dependent binding of the Cas12a-cleaved RCA amplicons that results in differential efficiency for the secondary ligation and RCA reactions. In contrast to the short-cut amplicon, the long cuts may hybridize with the padlock sequences in the linear forms, which terminates the ligation and exponential RCA.
Fig. 3 |
Fig. 3 |. Comparison of the kinetics and detection sensitivity of RCA, one-pot EXTRA-CRISPR and multi-step CRISPR-assisted RCA assays.
a, The RCA-only method involves two sequential reactions of ligation and linear RCA and can only detect 100 pM miR-21. Ligation condition, 100 nM padlock probe and 0.625 U μl−1 SplintR ligase. RCA condition, 2 μl ligation product, 0.2 U μl−1 phi29 and SYBY Green II for detection. b, The assay that connects three tandem steps of ligation, RCA and Cas12a readout yielded a LOD of ~100 fM. The conditions for ligation and RCA were the same as in a. After RCA and denaturing of enzymes, 40 nM RNP and 0.8 μM reporter were added into the reaction. c, In the two-step method, ligation and RCA were combined together, followed by fluorogenic detection using Cas12a RNP, conferring similar sensitivity with the three-step assay in b. d, The one-pot EXTRA-CRISPR method improves the sensitivity to detect 10 fM miR-21 before full optimization. Assay concentrations used in c and d, 100 nM padlock-1, 0.625 U μl−1 SplintR ligase, 0.1 U μl−1 phi29 polymerase, 1 μM reporter and 1 nM Cas12a RNP.
Fig. 4 |
Fig. 4 |. Optimization of the one-pot EXTRA-CRISPR miR-21 assay.
a, The position of the CRISPR module in a padlock sequence affects the detection signal and background level. The assays were conducted with 1 pM miR-21 and 100 nM padlock. b, Comparison of T4 DNA ligase and SplintR ligase for the one-pot assay. The assays were conducted with 40 U μl−1 T4 DNA ligase or 2.5 U μl−1 SplintR ligase, 100 nM padlock-1, 0.2 U μl−1 phi29 polymerase, 50 nM Cas12a RNP and 1 μM reporter. cf, Optimization of the concentration of phi29 (c), padlock (d), Cas12a RNP (e) and reporter (f). ΔRFU, unless otherwise specified, was the signal increase from 0 min to 120 min. Error bars, 1 s.d. (n = 3). The selected optimal conditions are indicated by a colour background. g, Representative real-time curves for calibrating the one-pot assay with serial dilutions of synthetic miR-21 standards using the optimized protocol. Inset: the curves of averaged signal for 0 fM (NC), 5 fM and 10 fM miR-21 with the shaded bands indicating 1 s.d. (n = 5). h, Titration curves plotted at various time points for the assay calibration in g show a strong dependence of the assay performance on the reaction time. i, Diagram of the analytical figures of merit determined by the assay calibration, including LOD, sensitivity (the slope of linear calibration curve) and linear dynamic range defined by the lower limit of quantification (LLOQ) and upper limit of quantification (ULOQ). j, Linear calibration obtained with the optimal assay time of 100 min yields a LOD of 1.64 fM miR-21 calculated from 3 × s.d. of the background level and a linear range from 5.47 fM to 500 fM. Error bars, 1 s.d. (n = 5). k, Specificity of the EXTRA-CRISPR for detecting miR-21 against a single-mismatch miR-21 sequence (mismatch-1) and eight different miRNAs (1 pM each). The colour intensity represents the averaged signal level of two replicates.
Fig. 5 |
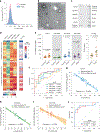
Fig. 5 |. Quantitative profiling of EV-derived miRNAs.
a, Experimental procedure for comparative analysis of miRNAs in EVs isolated from cell culture media and human plasma, respectively, using both EXTRA-CRISPR and RT-qPCR. b, Calibration curves for quantifying miRNA-196a, miR-451a and miR-1246 by EXTRA-CRISPR. Error bars, 1 s.d. (n = 3). c, Comparing the LODs for the EXTRA-CRISPR and RT-qPCR analyses of four miRNA targets. d, Validation of specific analysis across four miRNAs (1 pM each) by EXTRA-CRISPR. The colour intensity denotes the averaged signal level of three technical replicates for each target. e, Abundance and size distribution analyses of EVs isolated from serum-free media of six control and PDAC cell lines by NTA. Normal controls were HADF and HPPF; PDAC cell lines were MIA-PaCa-2, PANC-1, PC1 and PC5. f, Representative TEM images of PANC-1 cell-derived sEVs isolated by ultracentrifugation. Inset: spherical morphology of a sEV highlighting the lipid membrane structure. g, Quality assessment of isolated sEVs with a commercial antibody array. PANC-1 cell-derived sEVs were assayed to detect eight EV-associated protein markers, including CD81, CD63, FLOT1 (flotilin-1), ICAM1 (intercellular adhesion molecule 1), ALIX (programmed cell death 6 interacting protein), EpCAM (epithelial cell adhesion molecule), ANXA5 (annexin A5), TSG101 (tumour susceptibility gene 101) and a control for cellular contamination, GM130 (cis-golgi matrix protein); an image of the full scans is provided in Source Data. h, Comparison of the miRNA levels of MIA-PaCa-2 sEVs determined by EXTRA-CRISPR and RT-qPCR analyses of short RNA extracted from 30 μl of purified sEVs. Error bars, 1 s.d. (n = 2–4 as indicated). i, Heatmap of the normalized expression levels of miR-21, miR-196a, miR-451a and miR-1246 in six cell line-derived sEVs measured by EXTRA-CRISPR. The miRNA expression level was normalized by the input number of sEV particles for each cell line. The colour-coded miRNA level indicates the mean of two technical replicates of each assay. ND, not detected.
Fig. 6 |
Fig. 6 |. One-pot miRNA analysis for the diagnosis of pancreatic cancer.
a, NTA of total EVs isolated by a precipitation kit from the plasma fluids of a healthy donor and a patient with PDAC. b, Representative TEM images of plasma sEVs from a patient with PDAC. c, Quality check of a patient-derived EV sample with the exosome antibody array; an image of the full scans is provided in Source Data. d, Heatmap of the expression levels of individual miRNAs in the isolated plasma EVs from the patients with PDAC (n = 20) and healthy donors (n = 15) measured by EXTRA-CRISPR. Each miRNA in each sample was tested in two technical replicates, and the background-subtracted signals were adjusted by that of the positive control. The EV-Sig was defined by the weighted linear combination of four miRNAs using Lasso regression. e, Scatter plots of individual sEV-miRNA markers and EV-Sig for discriminating the PDAC group from the control group. The middle line and error bar represent the mean and 1 s.e.m., respectively. P values were calculated by two-tailed Student’s t-test with Welch correction. f, ROC curves and AUC analysis of individual sEV-miRNAs and the EV-Sig for PDAC diagnosis. gi, Correlation between the parallel measurements by EXTRA-CRISPR and RT-qPCR for miR-21 (g), miR-451a (h) and miR-1246 (i). The data points represent the mean of two replicates of each measurement by each method. Linear Deming fitting of the data points was performed to generate the linear correlation curves. j, Comparing the EXTRA-CRISPR-based EV-Sig and the RT-qPCR tests of the four-miRNA panel for PDAC diagnosis. The RT-qPCR results of miR-21, miR-451a and miR-1246 were assessed by Lasso regression and ROC analysis. All statistical analyses were performed at 95% confidence level.
Fig. 7 |
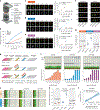
Fig. 7 |. Assessment of the EXTRA-CRISPR assay for low-cost POC testing.
a, The exploded view of a portable smartphone-based fluorescence detector assembled with 3D-printed body parts, a blue LED illuminator and a consumer digital hotplate. b, Real-time fluorescence detection of miR-21 using the portable EXTRA-CRISPR assay system. Images were captured every 2 min using a smartphone with an exposure time of 1 s. ce, Representative fluorescence and corresponding greyscale images (left) acquired for calibrating the low-cost POC system for detection of miR-21 (c), miR-451a (d) and miR-1246 (e). The greyscale images were processed to create the background-subtracted calibration curves (right) for these three miRNAs with linear least-squares regression. Error bar, 1 s.d. (n = 2). f,g, Representative fluorescence images (f) and scatter dot plots (g) for detecting three miRNA markers in sEVs isolated from four control (H1–H4) and four PDAC (P1–P4) plasma samples using the POC device. To plot the scatter dot graph, the background-corrected mean grey values for each miRNA marker were normalized by that of 500 fM standard miRNA. h, Principle of a lateral flow assay for visual detection of the EXTRA-CRISPR product. i, Representative photos (top) and the bar graphs for the intensity of test lines (bottom) for the EXTRA-CRISPR-LFA detection of three miRNAs at variable concentrations. Error bar, 1 s.d. (n = 3). j,k, Representative photos (j) and scatter dot plots (k) for detecting three sEV-miRNA markers in the same clinical samples as in f. The LFA test line signals were normalized with the averaged control line intensity measured for the negative controls, respectively. In g and k, each data point represents the mean of two technical replicates. The middle line and error bar represent the population mean and 1 s.e.m., respectively. P values were calculated by two-tailed Student’s t-test with Welch correction. l, Comparison of the results for measuring sEV miR-451a in g and k shows good correlation between the LFA and the smartphone POC device. Deming linear fitting was performed at the 95% confidence level.

References

    1. Ha M & Kim VN Regulation of microRNA biogenesis. Nat. Rev. Mol. Cell Biol 15, 509–524 (2014). - PubMed
    1. Di Leva G, Garofalo M & Croce CM MicroRNAs in cancer. Annu. Rev. Pathol 9, 287–314 (2014). - PMC - PubMed
    1. Inui M, Martello G & Piccolo S MicroRNA control of signal transduction. Nat. Rev. Mol. Cell Biol 11, 252–263 (2010). - PubMed
    1. Lin S & Gregory RI MicroRNA biogenesis pathways in cancer. Nat. Rev. Cancer 15, 321–333 (2015). - PMC - PubMed
    1. Mori MA, Ludwig RG, Garcia-Martin R, Brandao BB & Kahn CR Extracellular miRNAs: from biomarkers to mediators of physiology and disease. Cell Metab. 30, 656–673 (2019). - PMC - PubMed

Publication types

LinkOut - more resources