. 2023 Aug;7(8):1001-1013.
doi: 10.1038/s41551-023-01035-z. Epub 2023 Apr 27.

1H magnetic resonance spectroscopic imaging of deuterated glucose and of neurotransmitter metabolism at 7 T in the human brain

Affiliations

1H magnetic resonance spectroscopic imaging of deuterated glucose and of neurotransmitter metabolism at 7 T in the human brain

Petr Bednarik et al. Nat Biomed Eng. 2023 Aug.

Abstract

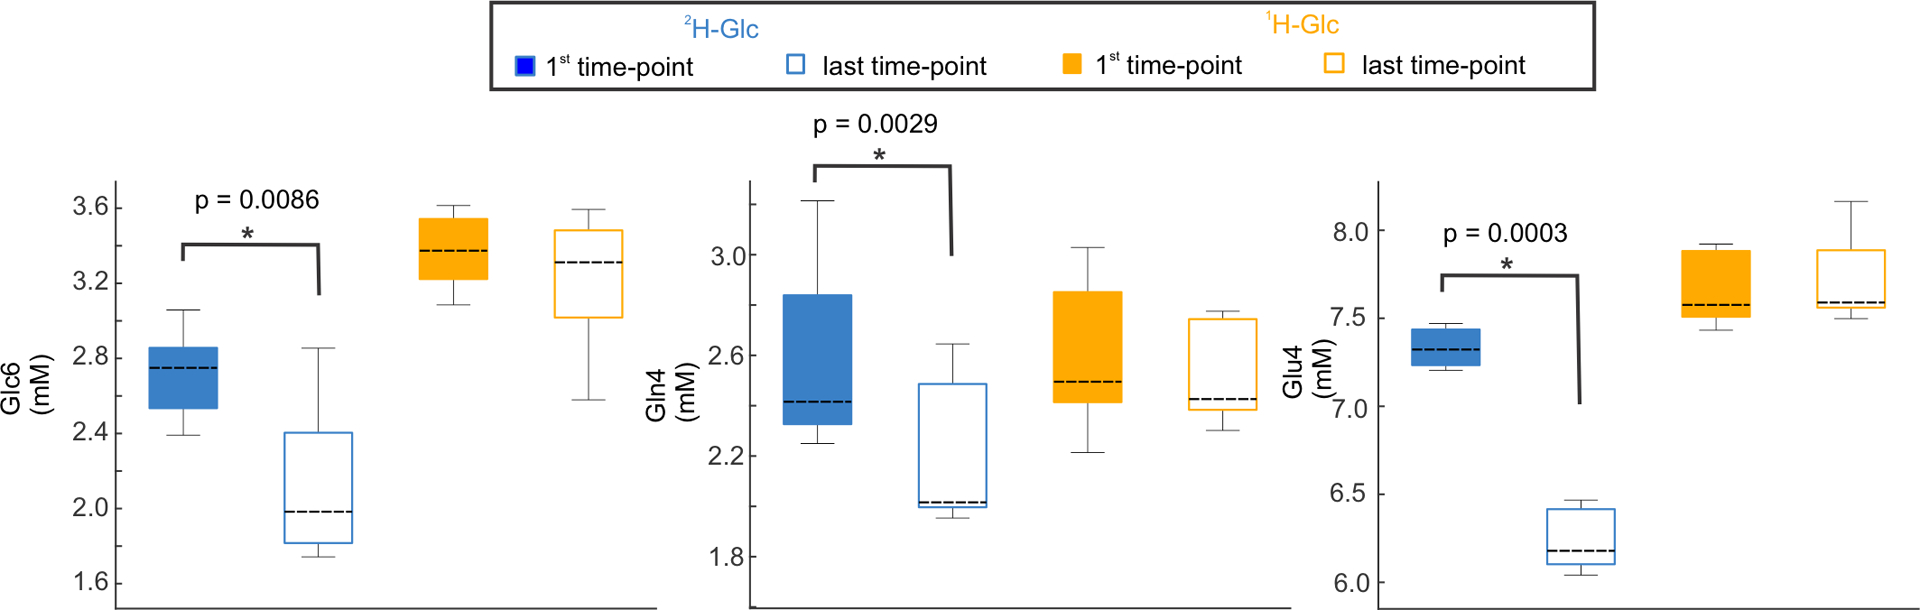
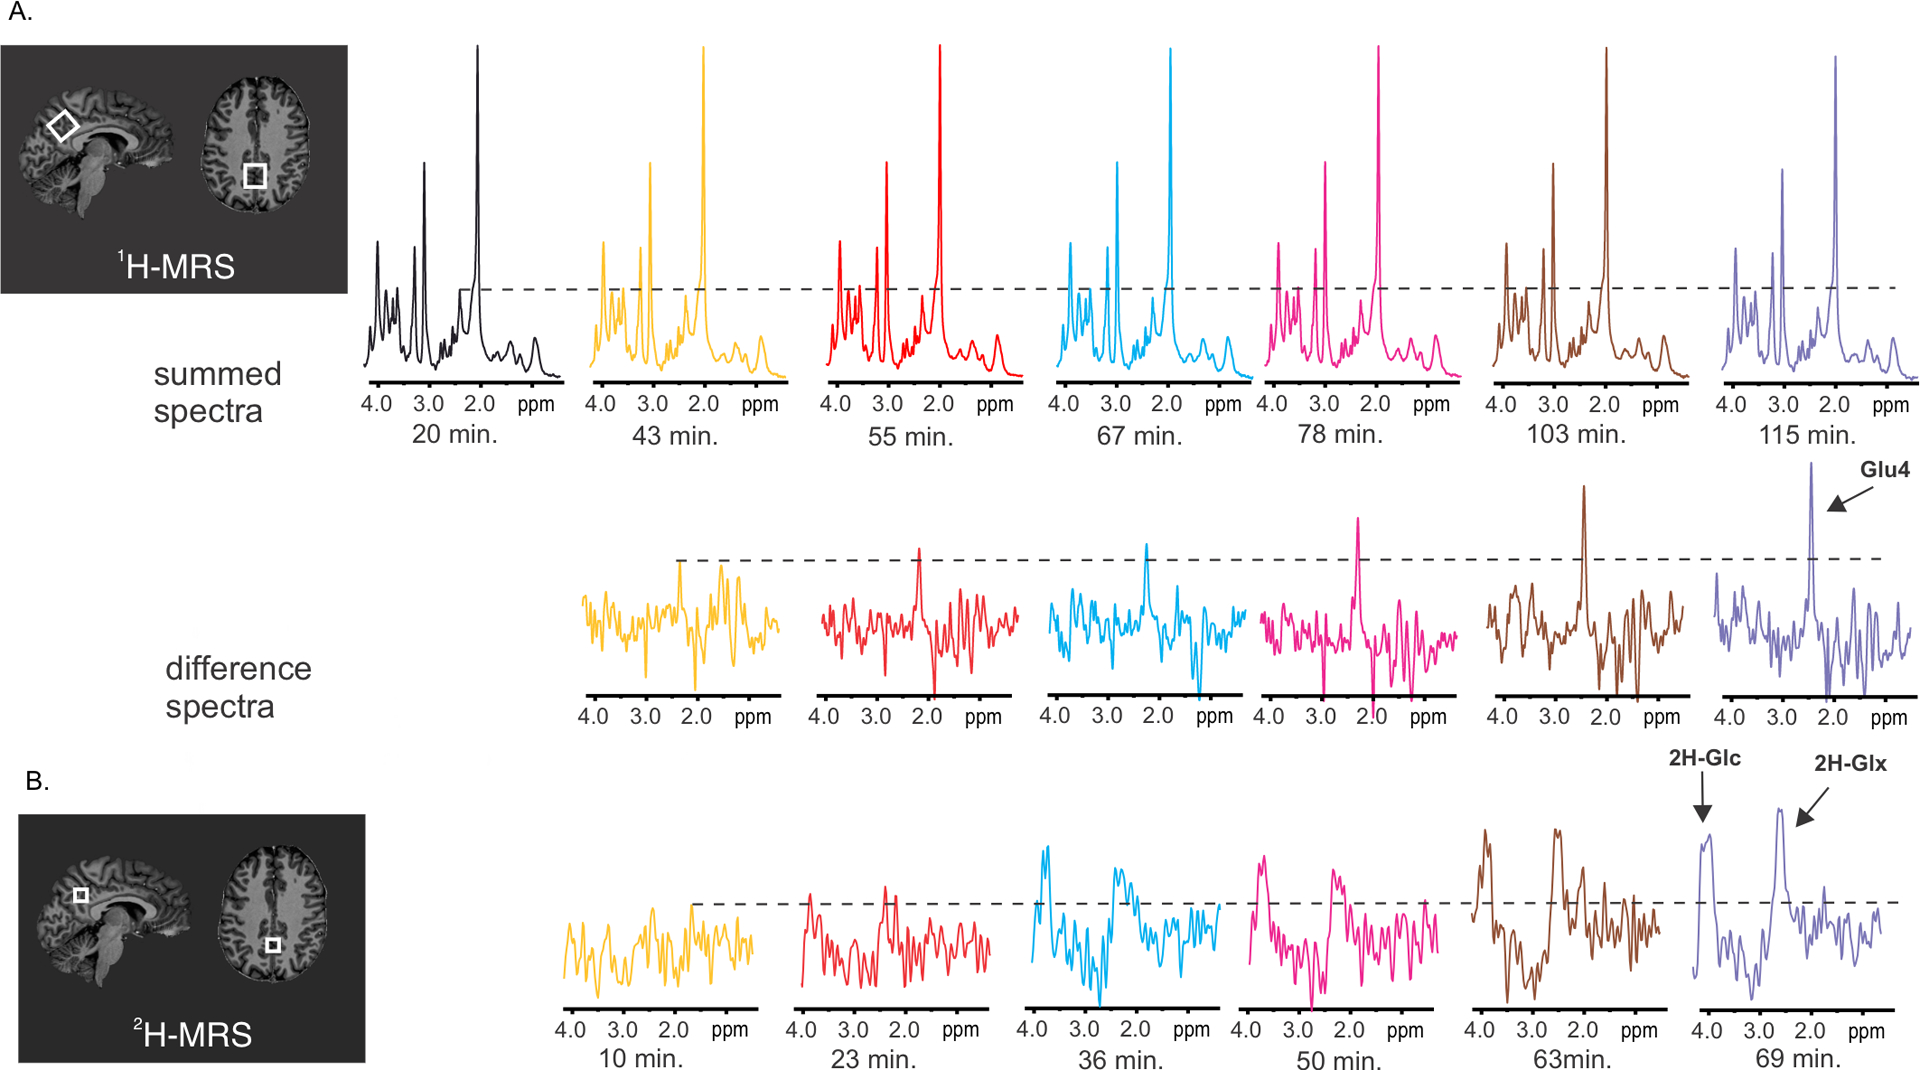
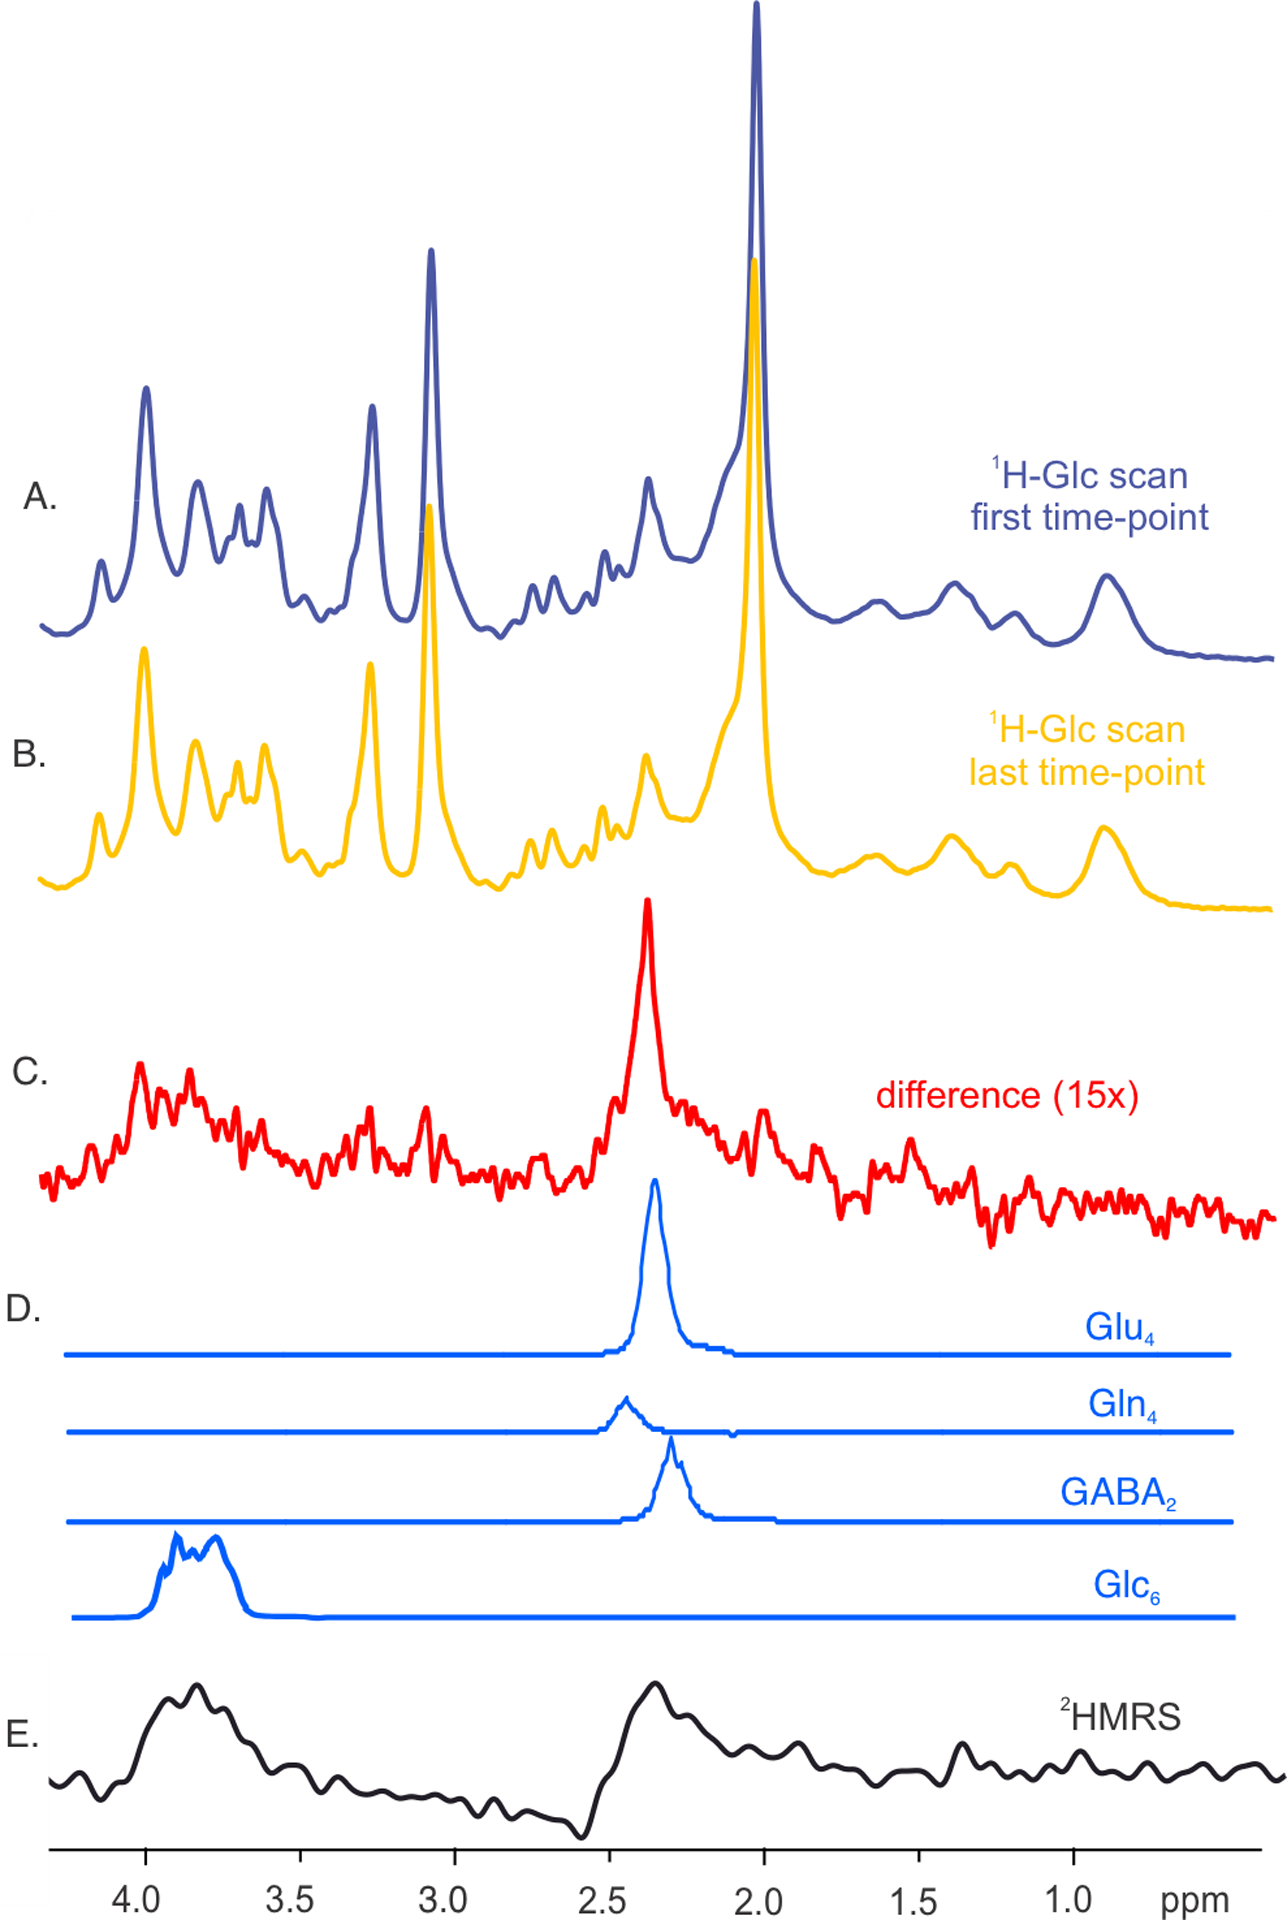
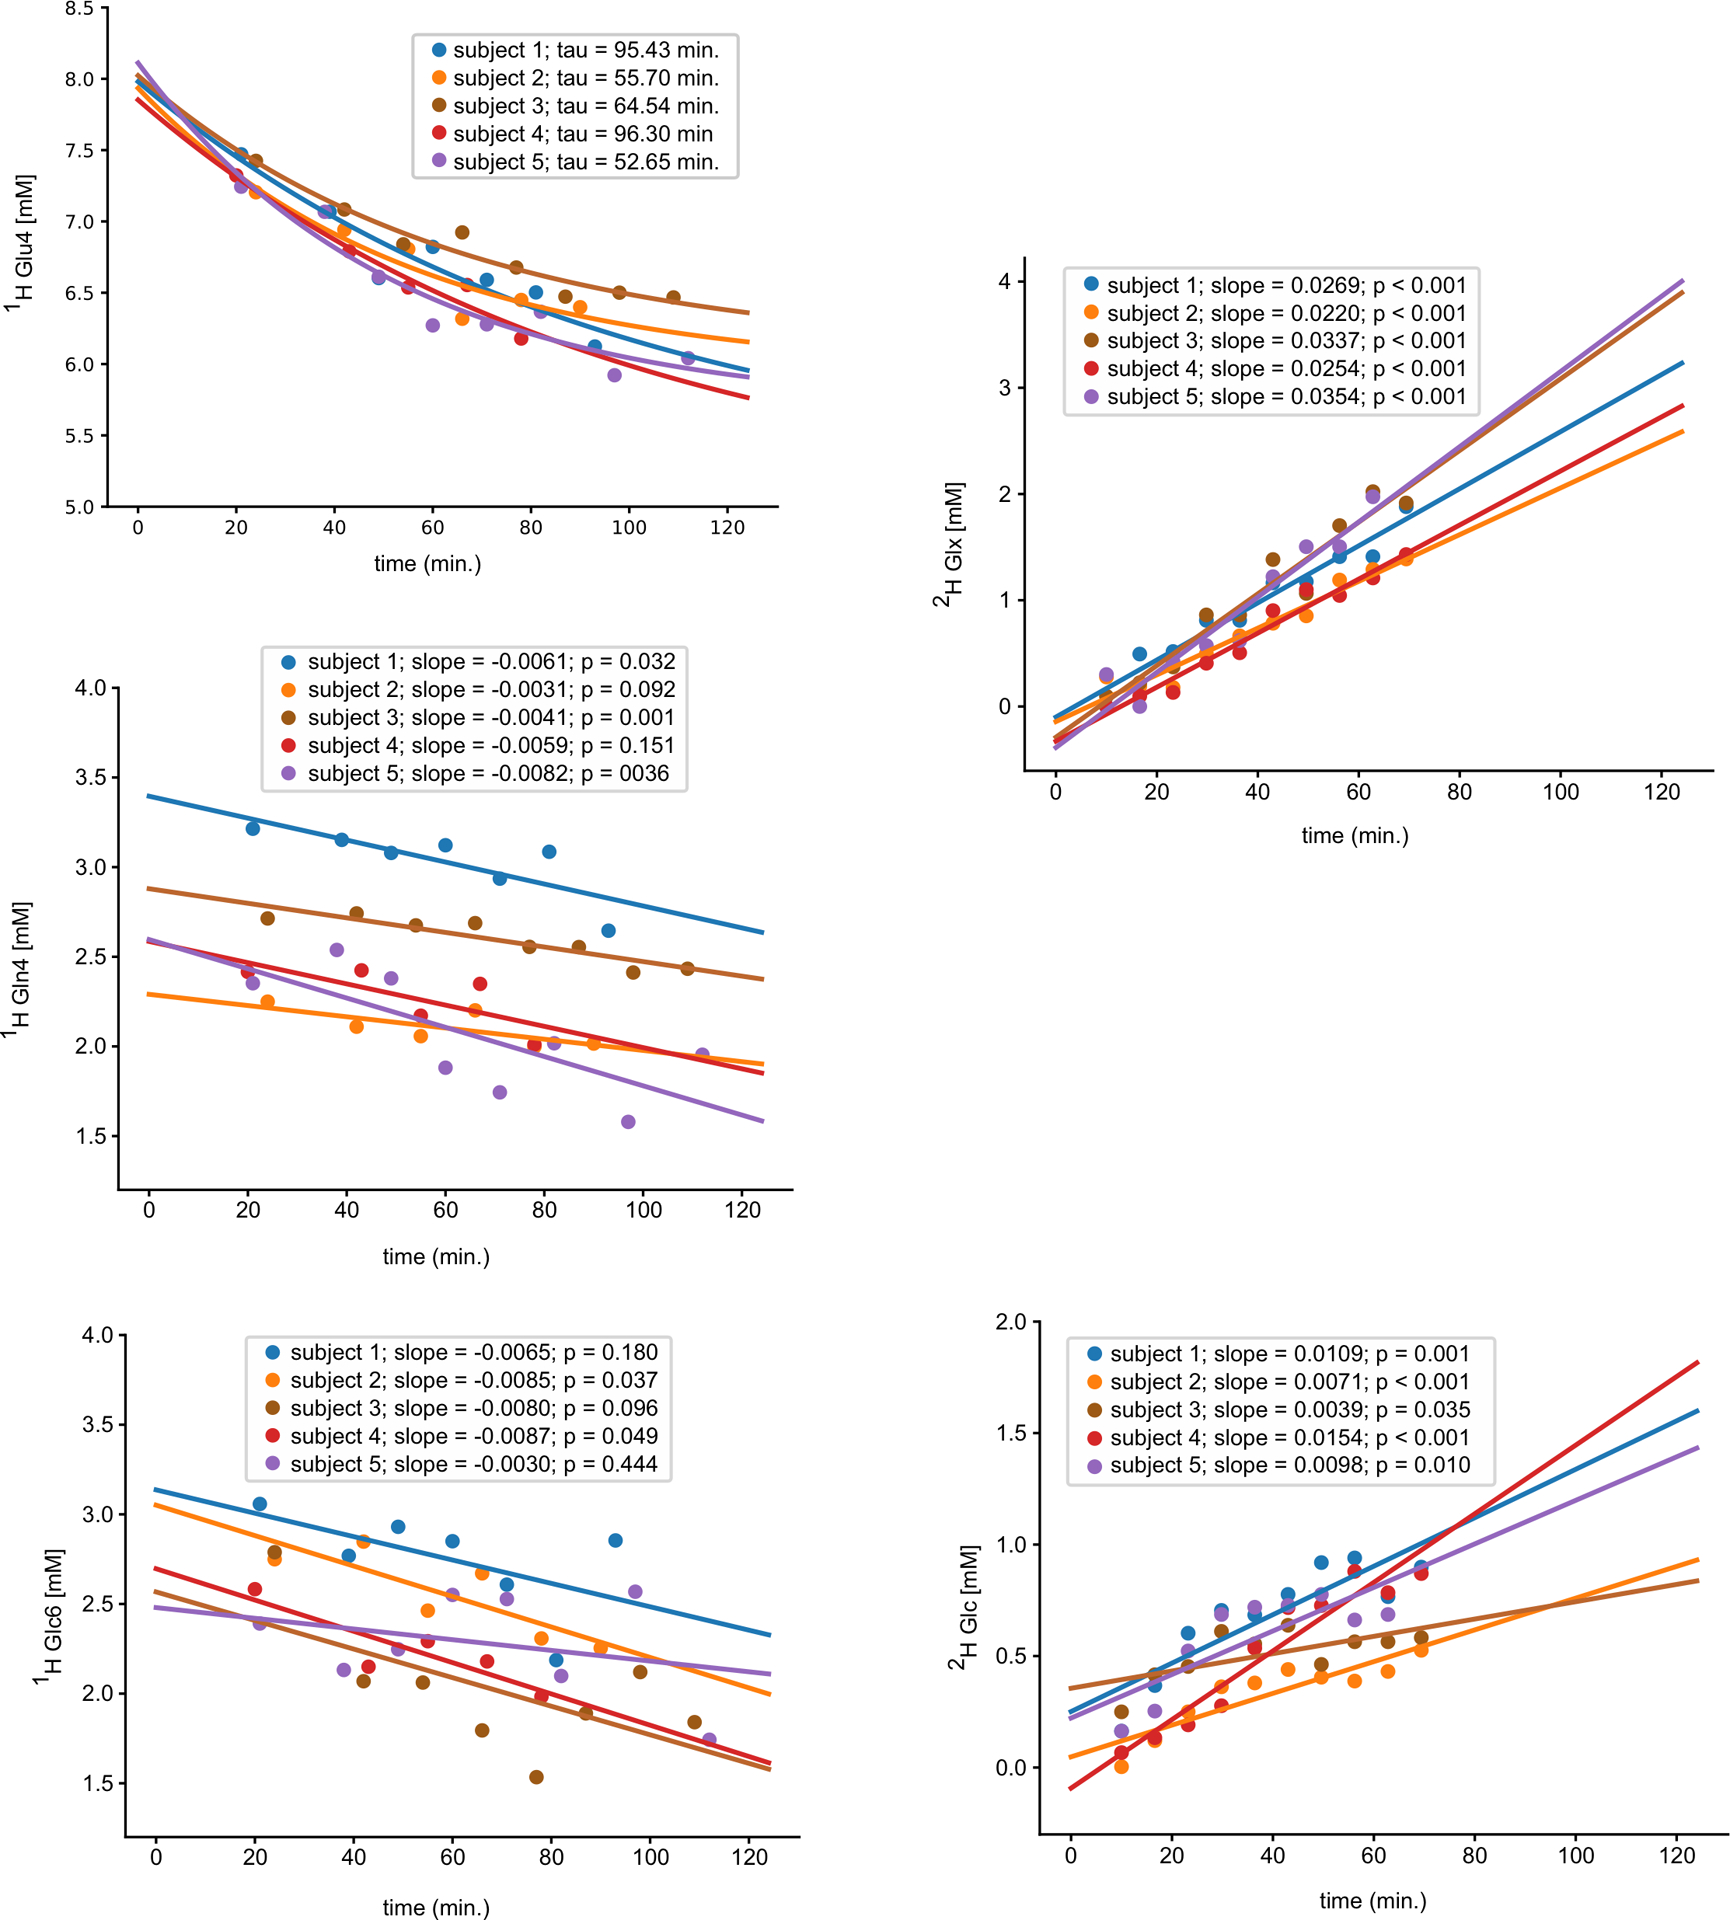
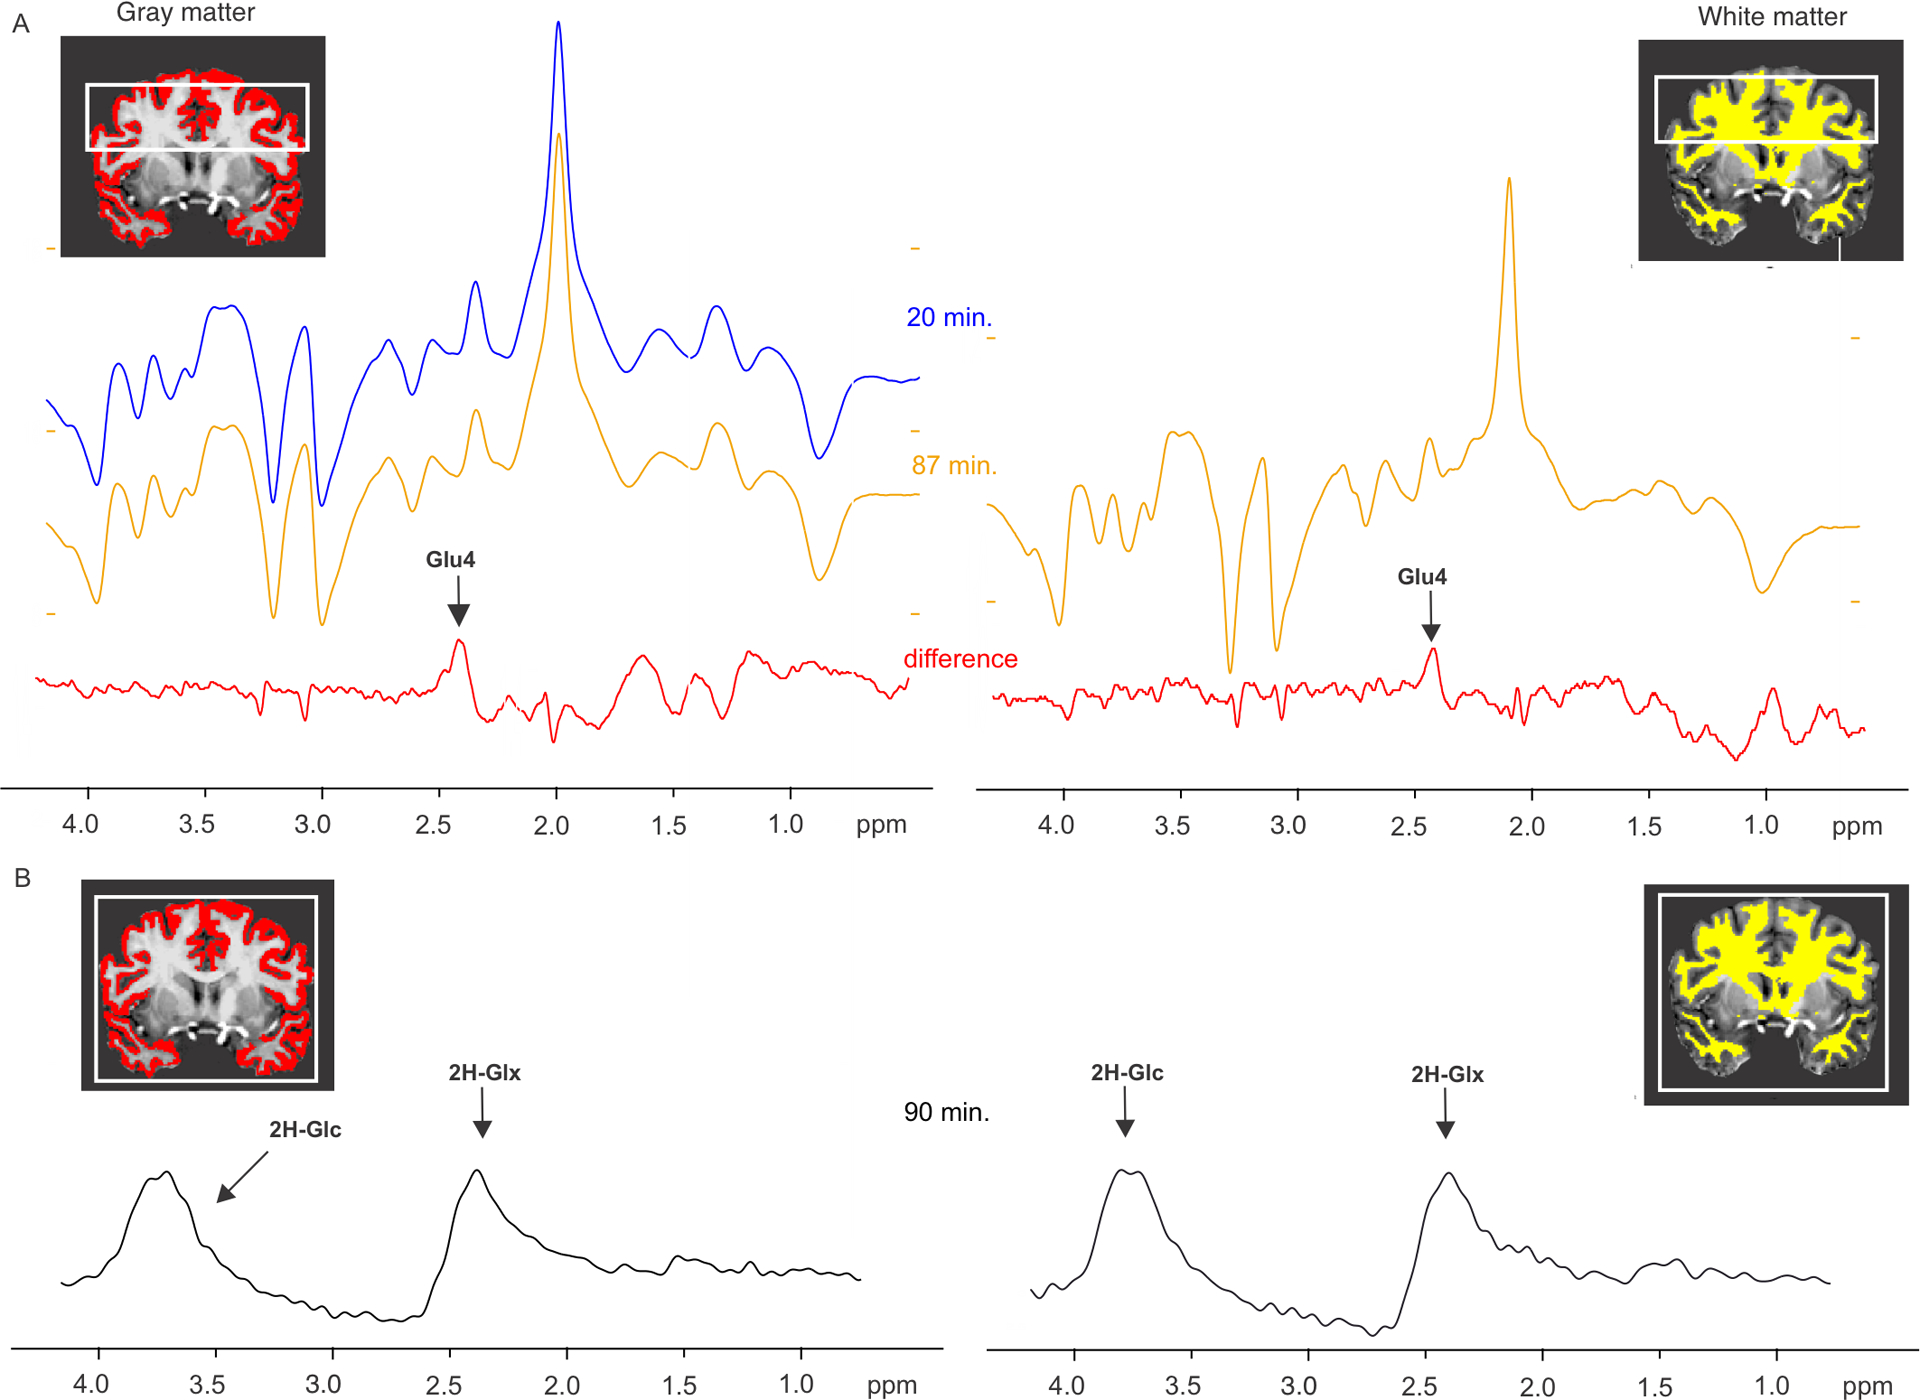
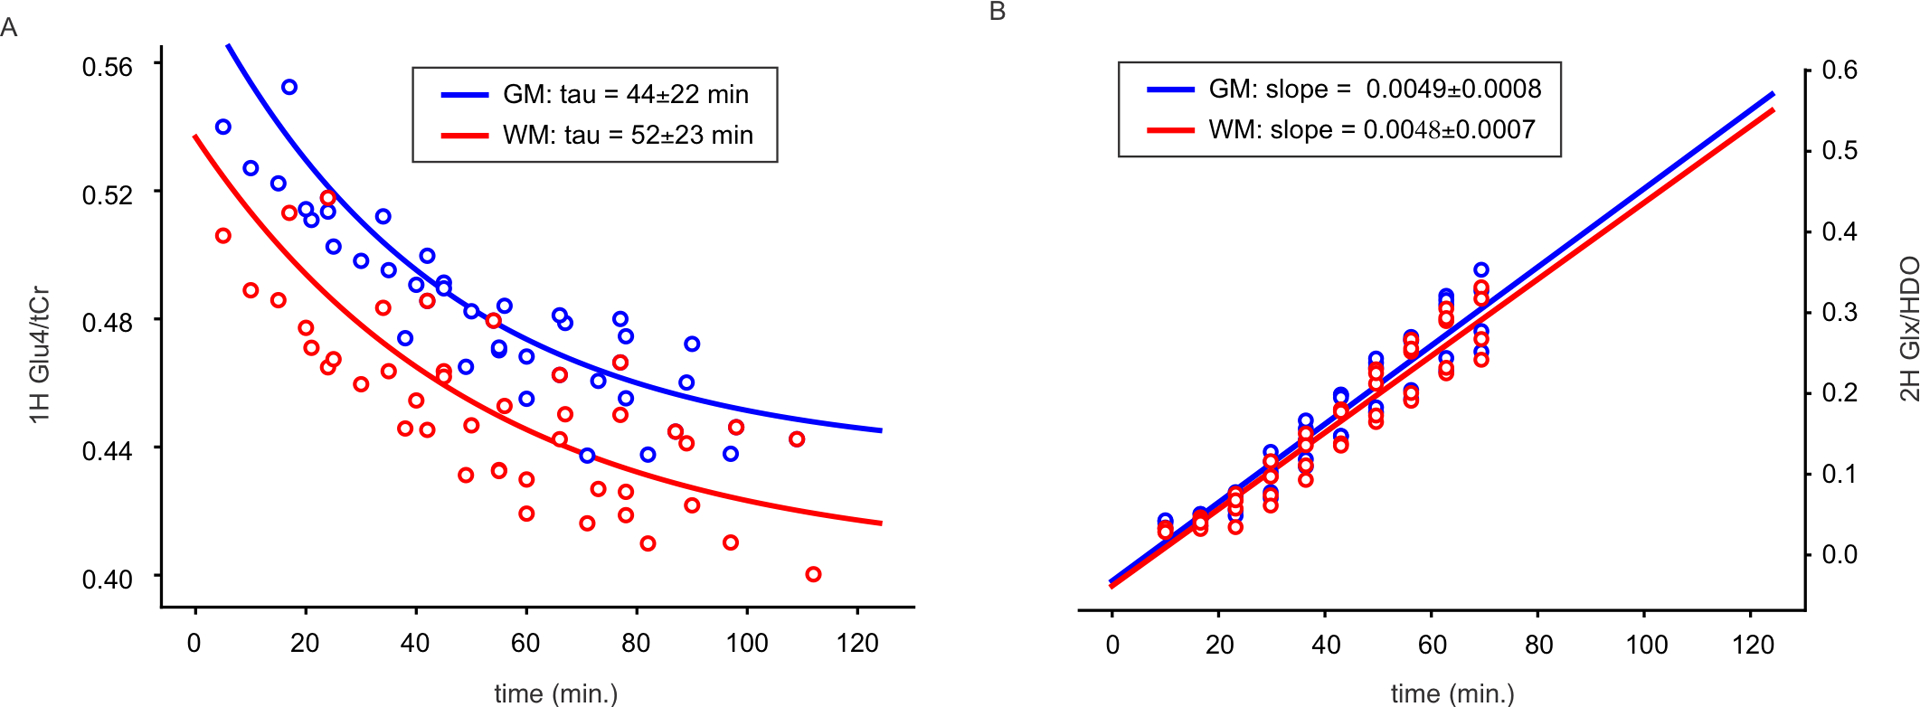
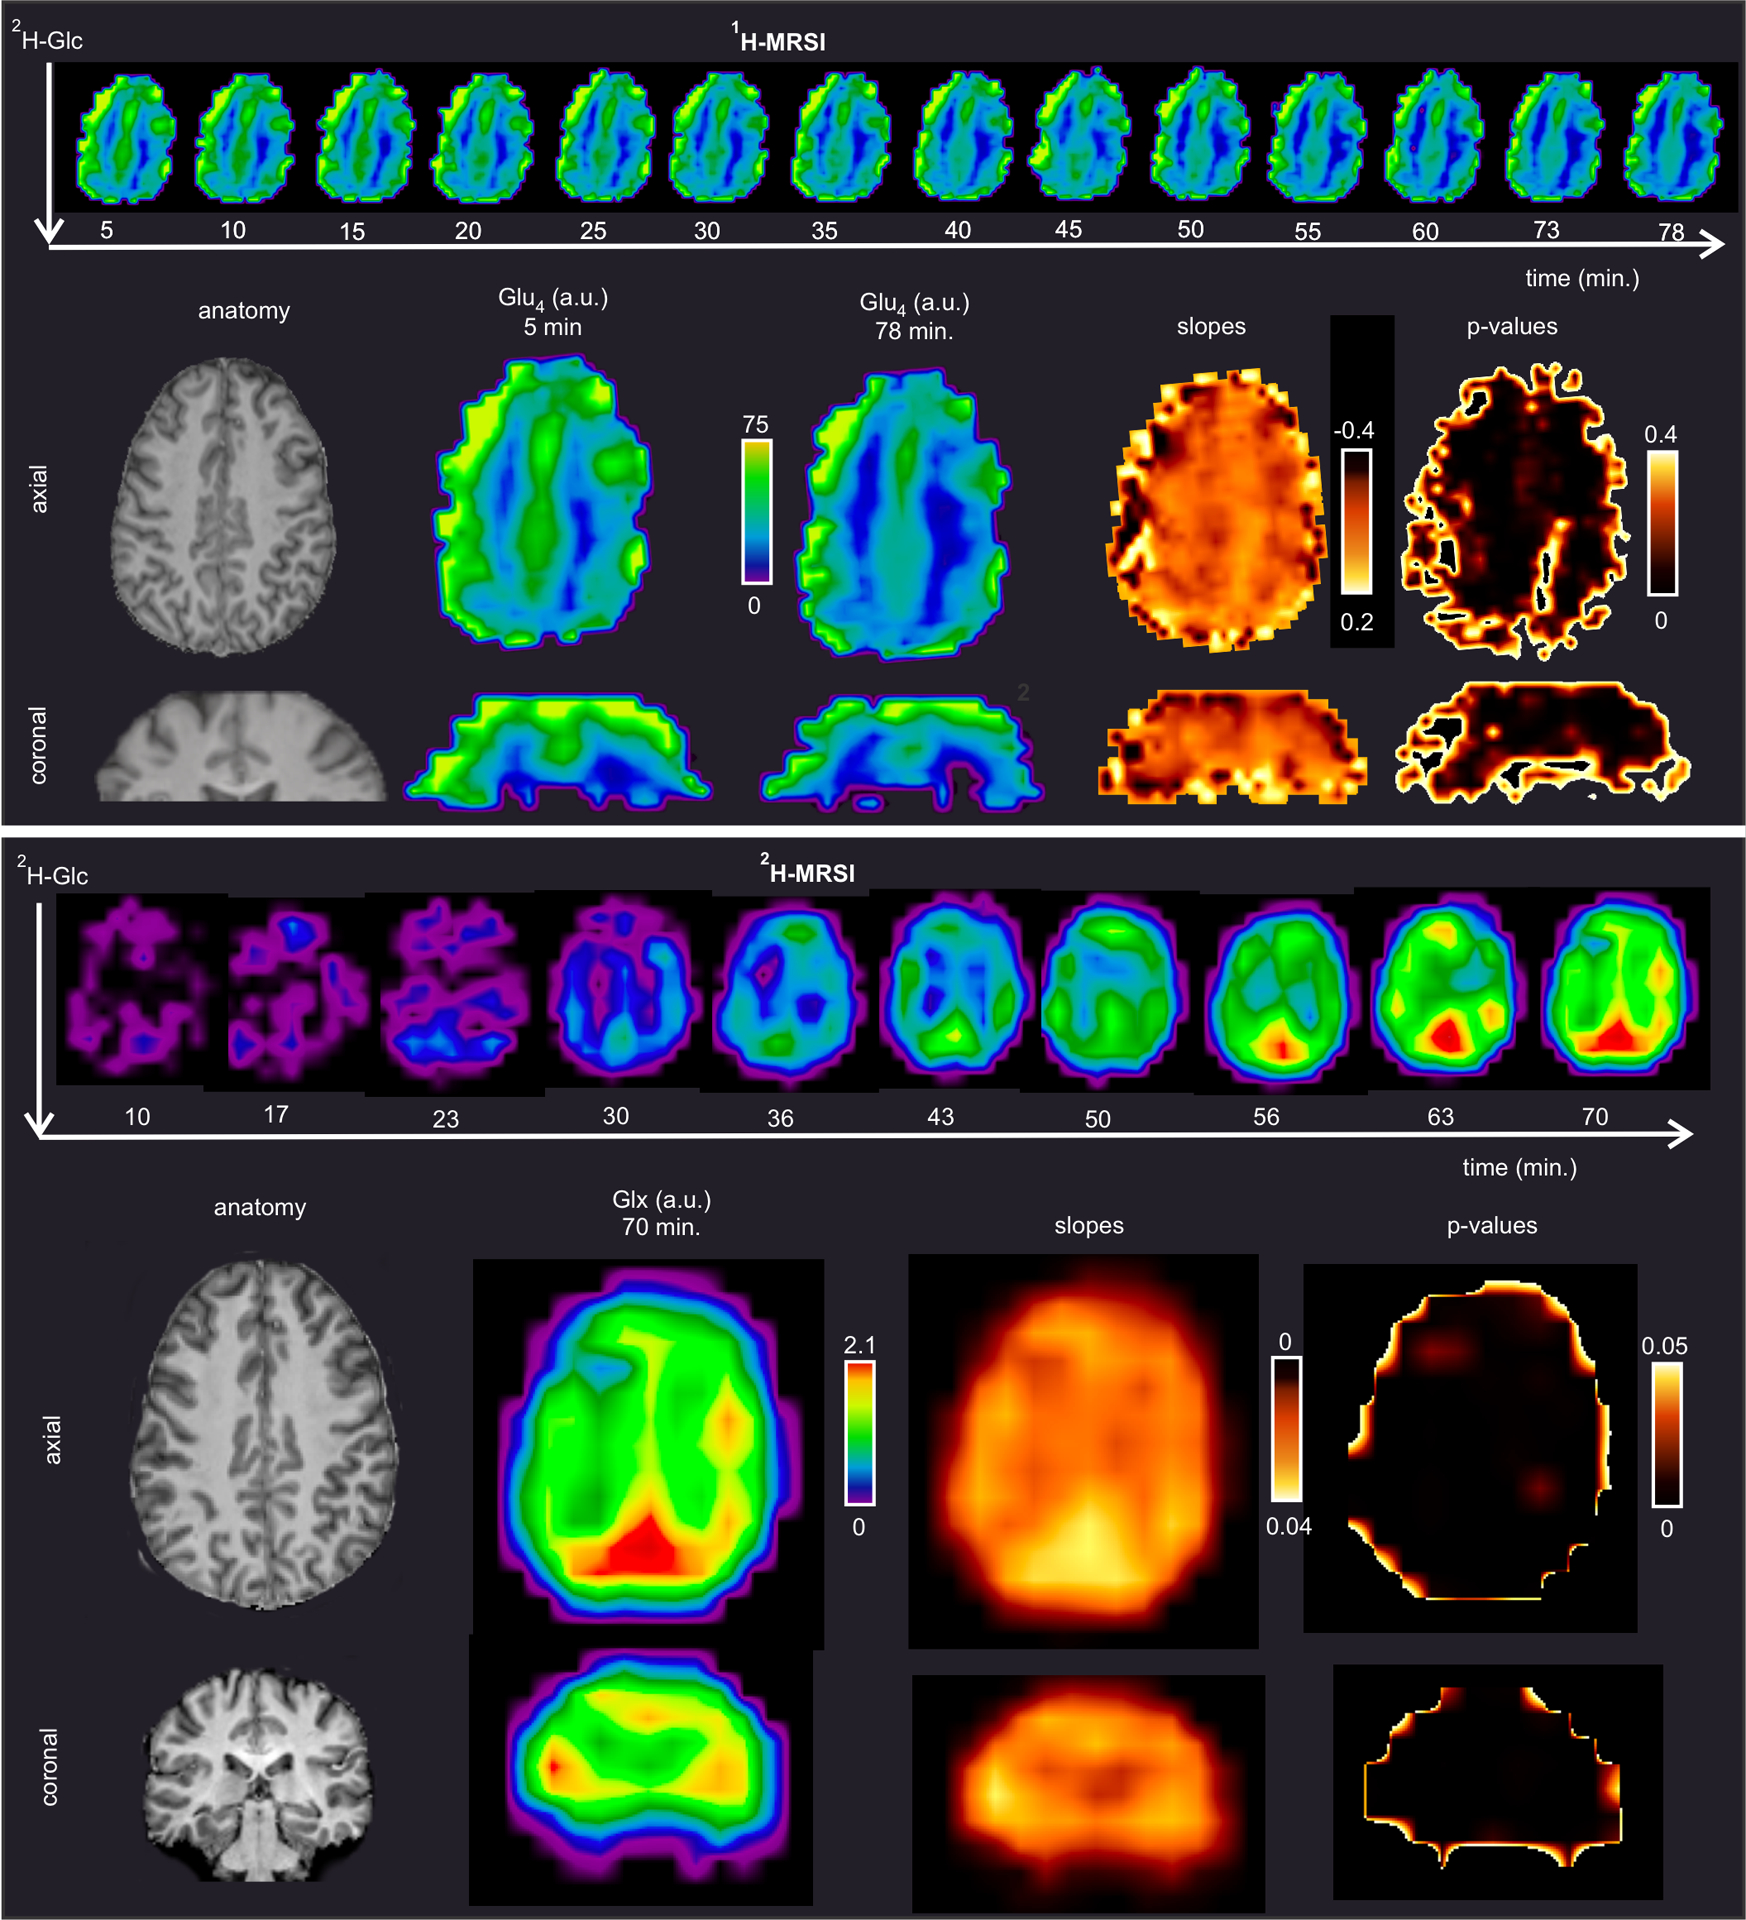
Impaired glucose metabolism in the brain has been linked to several neurological disorders. Positron emission tomography and carbon-13 magnetic resonance spectroscopic imaging (MRSI) can be used to quantify the metabolism of glucose, but these methods involve exposure to radiation, cannot quantify downstream metabolism, or have poor spatial resolution. Deuterium MRSI (2H-MRSI) is a non-invasive and safe alternative for the quantification of the metabolism of 2H-labelled substrates such as glucose and their downstream metabolic products, yet it can only measure a limited number of deuterated compounds and requires specialized hardware. Here we show that proton MRSI (1H-MRSI) at 7 T has higher sensitivity, chemical specificity and spatiotemporal resolution than 2H-MRSI. We used 1H-MRSI in five volunteers to differentiate glutamate, glutamine, γ-aminobutyric acid and glucose deuterated at specific molecular positions, and to simultaneously map deuterated and non-deuterated metabolites. 1H-MRSI, which is amenable to clinically available magnetic-resonance hardware, may facilitate the study of glucose metabolism in the brain and its potential roles in neurological disorders.


Conflict of interest statement

R. Lanzenberger received travel grants and/or conference speaker honoraria within the last three years from Bruker BioSpin MR andHeel, and has served as a consultant for Ono Pharmaceutical. He received investigator-initiated research funding from Siemens Healthcare regarding clinical research using PET/MR. He is a shareholder of the start-up company BM Health GmbH since 2019.

The other authors declared no potential conflicts of interest with respect to the research, authorship, and/or publication of this article.

Figures

Fig.1 |
Fig.1 |. Quantification of SV-MR spectra obtained in posterior cingulum with single-voxel proton-MRS.
Bar diagrams demonstrate concentration comparisons quantified from the first and last time-point spectra following 2H-Glc and 1H-Glc administration for 5 healthy volunteers and reflect continuously decaying metabolite signals through the acquisition period. Peaks that originated from the specific carbon position undergoing deuteration, namely, the 6th carbon position for Glc (Glc6) the 4th carbon position for Glu (Glu4) and Gln (Gln4) and the 2nd carbon position for GABA (GABA2), were separated. Concentrations were compared with a standard, two-tailed, paired t-test between the first and last time-point within the 2H-Glc and 1H-Glc sessions. The metabolites that appeared significant (p < 0.05) are displayed here. The whiskers represent the minimal and maximal values, the boxes first and third quartile and the dashed lines are medians. P-values were not corrected for multiple comparisons. The full analyzed neurochemical profile is shown at Suppl. Fig.1.
Fig. 2 |
Fig. 2 |. Example of MR spectra obtained from one voxel in the posterior cingulum with single voxel 1H-MRS (panel A) and with 2H-MRSI (panel B) in one participant at 7 Tesla.
The displayed spectra were obtained after peroral administration of 2H-Glc. A. The summed spectra show decreasing signal at the resonance frequency of -C41H2- in the glutamate molecule (2.34 ppm) due to enrichment of the glutamate pool with 2H (either -C42H2H- or -C42H1H). The robust change at the 4th carbon position is documented by the increasing signal amplitude at 2.34 ppm in the difference spectra calculated by subtraction of the respective spectrum from the last session minus the first session. B. 2H-MR spectra reflect an increase in the deuterated fraction of Glc and Glx (Glu+Gln). The insets with anatomical images show location of voxels in the posterior cingulate gyrus. The voxel dimensions were 22×20×20 mm for single-voxel proton MRS, whereas voxel selected from 2H-MRSI data had volume of (12.5 mm)3.
Fig.3 |
Fig.3 |. 1H-MRS difference spectra and their quantification.
Summed spectra from all subjects (N=5) represent the first and last time-points after 2H-Glc ingestion. The spectra (A and B) were linewidth-matched with exponential line-broadening and subtracted. The resulting difference spectrum in panel C represents the effect of metabolite 2H enrichment. The metabolite components (D) were obtained via LCModel analysis using a basis set containing simulated spectra of neurochemicals that were undergoing deuteration (i.e., Glu, Gln, and GABA and Glc). The proton signals that originated from different carbon groups were separated. The summed 2H-MRS spectrum (N=5) from the last acquired time-point resembles the 1H-MR spectrum except for the spectral resolution (E).
Fig. 4 |
Fig. 4 |. Fitting of time courses obtained by quantification of 1H (left column) and 2H single-voxel MR spectra (right column).
The spectra were acquired in a single PCC voxel and concentrations were obtained by LCmodel. Decay in the concentrations of glutamate (Glu4) and glutamine (Gln4), glucose (Glc6), Glx (Glu+Gln) were fitted using the exponential function Y=Y0(−t/tau)+c (Glu4), and linear regression Y = a + bX (Gln4,Glc6, 2H-Glc, and 2H-Glx). The 1H-MRS time-courses and their fits following 2H-Glc ingestion are in line with those obtained by quantification of 2H-MR spectra. Two-tailed test was used to calculate significance of the slopes (p-values).
Fig. 5 |
Fig. 5 |. Effect of Deu-Glc on the spectra obtained from the gray and white matter with 3D multi-voxel 1H-MRSI and 2H-MRSI data.
Difference spectra (red) in the panel A were calculated by subtraction of spectra obtained from the first (purple) and last (green) time-point after deuterium ingestion in one healthy volunteer. The spectra were selected using a quality control mask and segmented gray or white matter masks within the 40 mm-thick volume-of-interest (180×180×40 mm) (white box). The signal loss at 2.34 ppm reflects the exchange of protons and deuterons at the 4th carbon position in the glutamate molecule and is displayed as a positive peak in the difference spectra. The signal decay is convincingly found in both gray and white matter. Lack of unwanted signals in the quantified range 1.9–4.2 ppm verifies good spectral quality and stability during the acquisition. The 2H MRS spectra in panel B were acquired in the last time point in the whole brain (the white box, 200×200×175 mm) and averaged from the voxels with most gray and white matter content. While the 1H-MRSI data were acquired with spatial resolution of ~(5 mm)3, the nominal voxel dimension for 2H-MRSI were ~(12.5 mm)3.
Fig. 6 |
Fig. 6 |. Fitting of time courses from averaged regional MRSI maps after 2H-Glc ingestion:
While the exponential fits of 1H-MRS data (panel A) showed 18% faster decay (smaller constant of the decay – tau, M=M0(−t/tau)+c) in the gray (GM, blue) than in the white matter (WM, red), the linear fits of 2H-MRS data (panel B) yielded only minimal differences between GM and WM.
Fig. 7 |
Fig. 7 |. Voxel-wise fitting of Glu4 and Glx4 time-courses obtained with high time resolution.
MRSI data were acquired in one participant with a time-resolution of five (1H-MRSI, panel A.) and 6 minutes (2H-MRSI, panel B.) after peroral administration of 2H-Glc. Maps demonstrate the signal decay of protons on the 4th carbon position in the glutamate molecule (Glu4, 1H-MRSI) and in Glx4 (2H-MRSI). Voxel-wise linear regression was applied to Glu4 and Glx4 time-courses. Respective slopes tend to be higher in the gray matter, which suggests a higher glutamate turnover in the gray than in the white matter. The p-values refer to the significance of the slopes. Spectral postprocessing of 1H-MRSI included channel-wise L2-regularization for suppression of unwanted lipid signals.

References

    1. Kim M et al. What do we know about dynamic glucose-enhanced (DGE) MRI and how close is it to the clinics? Horizon 2020 GLINT consortium report. Magn. Reson. Mater. Physics, Biol. Med 35, 87–104 (2022). - PMC - PubMed
    1. de Graaf RA, Mason GF, Patel AB, Behar KL & Rothman DL In vivo 1H-[13 C]-NMR spectroscopy of cerebral metabolism. NMR Biomed. 16, 339–357 (2003). - PubMed
    1. Ruhm L et al. Deuterium metabolic imaging in the human brain at 9.4 Tesla with high spatial and temporal resolution. Neuroimage (2021) doi:10.1016/j.neuroimage.2021.118639. - DOI - PMC - PubMed
    1. Rich LJ et al. 1H magnetic resonance spectroscopy of 2H-to-1H exchange quantifies the dynamics of cellular metabolism in vivo. Nat. Biomed. Eng 4, 335–342 (2020). - PMC - PubMed
    1. van Zijl PCM & Brindle KM Spectroscopic measurements of metabolic fluxes. Nat. Biomed. Eng 4, 254–256 (2020). - PubMed

Publication types

MeSH terms