

Don't worry, it won't be fine. Contributions of worry and anxious arousal to startle responses and event-related potentials in threat anticipation
- PMID: 37106311
- PMCID: PMC10400686
- DOI: 10.3758/s13415-023-01094-4
Don't worry, it won't be fine. Contributions of worry and anxious arousal to startle responses and event-related potentials in threat anticipation
Erratum in
-
Correction: Don't worry, it won't be fine. Contributions of worry and anxious arousal to startle responses and event-related potentials in threat anticipation.Cogn Affect Behav Neurosci. 2023 Aug;23(4):1223. doi: 10.3758/s13415-023-01109-0. Cogn Affect Behav Neurosci. 2023. PMID: 37193911 Free PMC article. No abstract available.
Abstract
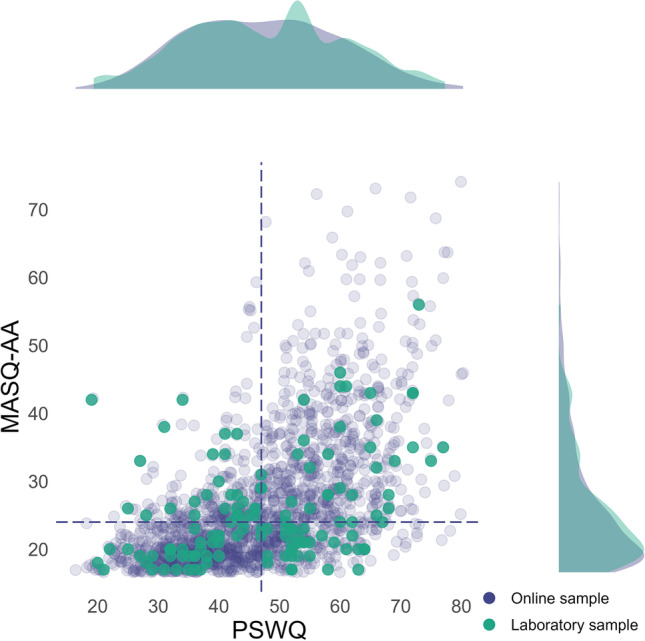
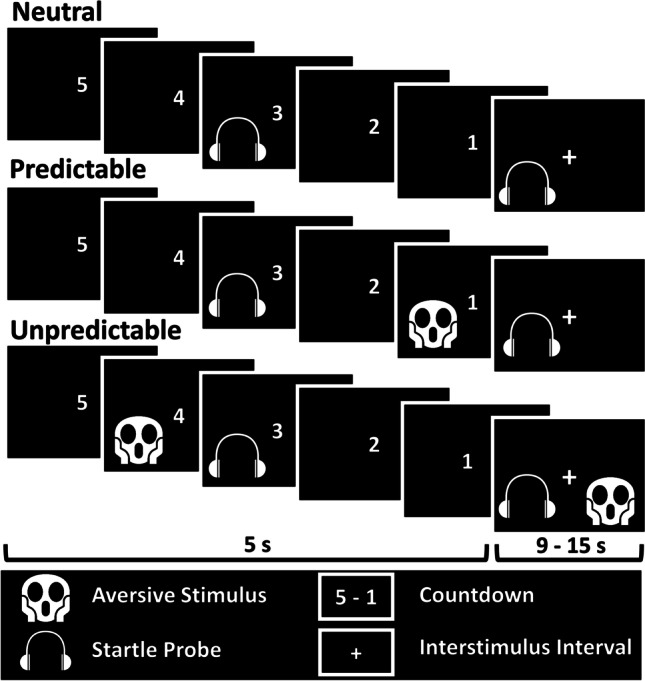
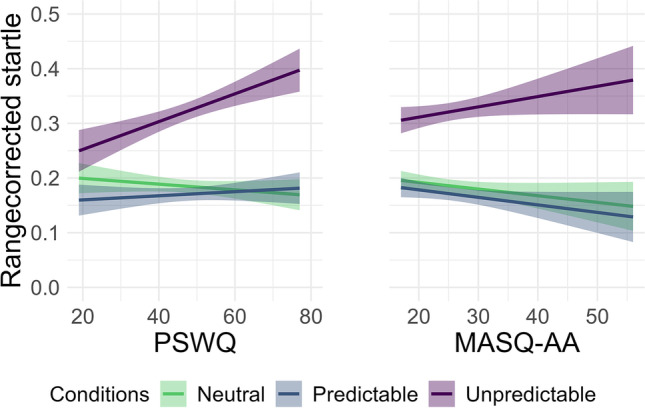
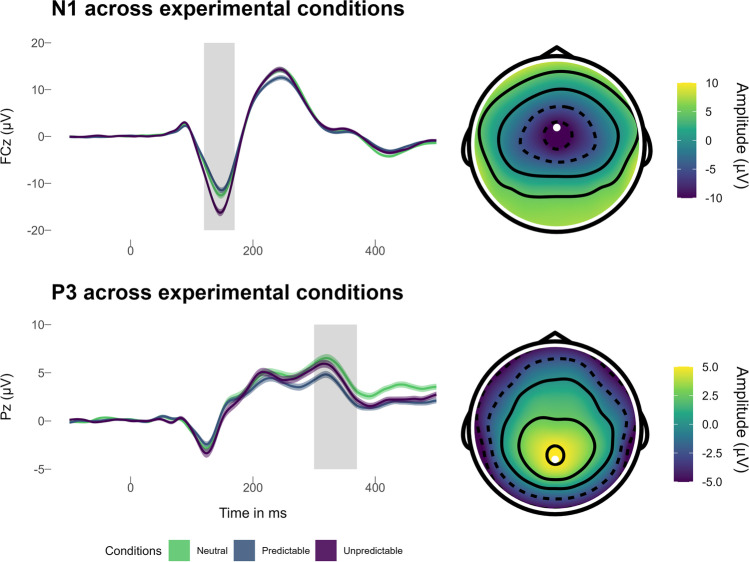
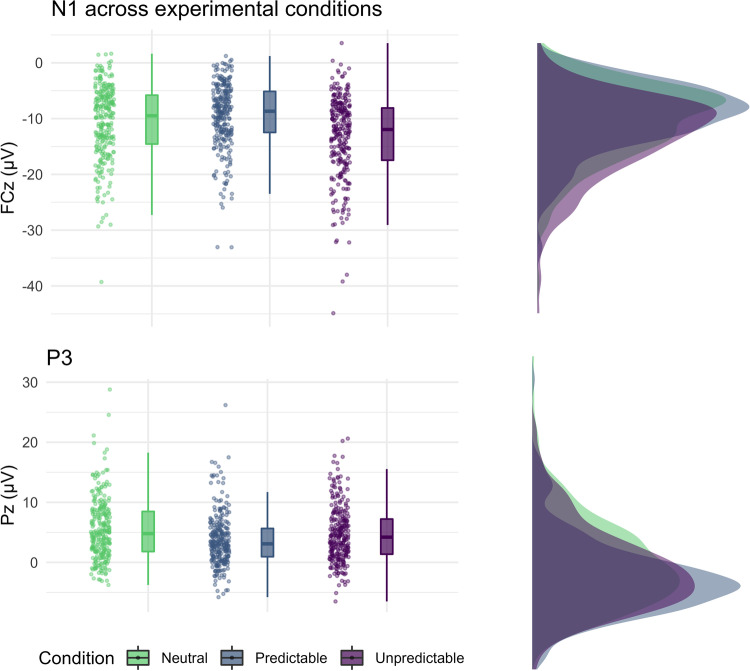
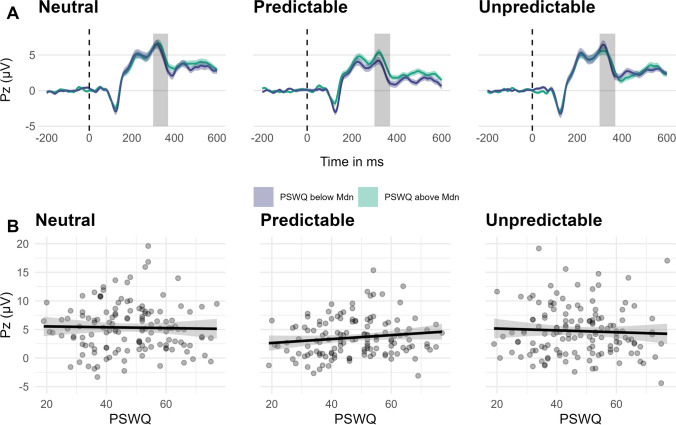
A widely shared framework suggests that anxiety maps onto two dimensions: anxious apprehension and anxious arousal. Previous research linked individual differences in these dimensions to differential neural response patterns in neuropsychological, imaging, and physiological studies. Differential effects of the anxiety dimensions might contribute to inconsistencies in prior studies that examined neural processes underlying anxiety, such as hypersensitivity to unpredictable threat. We investigated the association between trait worry (as a key component of anxious apprehension), anxious arousal, and the neural processing of anticipated threat. From a large online community sample (N = 1,603), we invited 136 participants with converging and diverging worry and anxious arousal profiles into the laboratory. Participants underwent the NPU-threat test with alternating phases of unpredictable threat, predictable threat, and safety, while physiological responses (startle reflex and startle probe locked event-related potential components N1 and P3) were recorded. Worry was associated with increased startle responses to unpredictable threat and increased attentional allocation (P3) to startle probes in predictable threat anticipation. Anxious arousal was associated with increased startle and N1 in unpredictable threat anticipation. These results suggest that trait variations in the anxiety dimensions shape the dynamics of neural processing of threat. Specifically, trait worry seems to simultaneously increase automatic defensive preparation during unpredictable threat and increase attentional responding to threat-irrelevant stimuli during predictable threat anticipation. The current study highlights the utility of anxiety dimensions to understand how physiological responses during threat anticipation are altered in anxiety and supports that worry is associated with hypersensitivity to unpredictable, aversive contexts.
Keywords: Anxiety dimensions; Anxious apprehension; Event-related potentials; NPU-threat test; Startle reflex; Threat anticipation; Uncertainty; Unpredictability.
© 2023. The Author(s).
Figures
Similar articles
-
A rare scare: The role of intolerance of uncertainty in startle responses and event-related potentials in anticipation of unpredictable threat.Int J Psychophysiol. 2022 Sep;179:56-66. doi: 10.1016/j.ijpsycho.2022.06.018. Epub 2022 Jul 3. Int J Psychophysiol. 2022. PMID: 35787439
-
Defensive motivation and attention in anticipation of different types of predictable and unpredictable threat: A startle and event-related potential investigation.Psychophysiology. 2017 Aug;54(8):1180-1194. doi: 10.1111/psyp.12869. Epub 2017 Apr 1. Psychophysiology. 2017. PMID: 28370078 Free PMC article.
-
Family study of the startle reflex and event-related potentials in anticipation of predictable and unpredictable threat in adolescents and their parents.Psychophysiology. 2023 Sep;60(9):e14311. doi: 10.1111/psyp.14311. Epub 2023 Apr 19. Psychophysiology. 2023. PMID: 37076982 Free PMC article.
-
[Specific trait and state anxiety's roles in emergence and maintenance of attentional biases associated with anxiety: Inventories and investigation tracks].Encephale. 2009 Oct;35(5):409-16. doi: 10.1016/j.encep.2008.08.004. Epub 2009 Feb 7. Encephale. 2009. PMID: 19853712 Review. French.
-
Startle reactivity and anxiety disorders: aversive conditioning, context, and neurobiology.Biol Psychiatry. 2002 Nov 15;52(10):958-75. doi: 10.1016/s0006-3223(02)01665-7. Biol Psychiatry. 2002. PMID: 12437937 Review.
Cited by
-
Effects of startle on cognitive performance and physiological activity revealed by fNIRS and thermal imaging.Sci Rep. 2025 Feb 26;15(1):6878. doi: 10.1038/s41598-025-90540-z. Sci Rep. 2025. PMID: 40011512 Free PMC article.
-
Trait state occasion (TSO) modeling of event-related potentials (ERPs).Biol Psychol. 2025 Mar;196:109000. doi: 10.1016/j.biopsycho.2025.109000. Epub 2025 Mar 8. Biol Psychol. 2025. PMID: 40058452
References
Publication types
MeSH terms
LinkOut - more resources
Full Text Sources
Medical
