. 2023 Mar 28;12(4):510.
doi: 10.3390/biology12040510.

Identification and Functional Analysis of Known and New Mutations in the Transcription Factor KLF1 Linked with β-Thalassemia-like Phenotypes

Affiliations

Identification and Functional Analysis of Known and New Mutations in the Transcription Factor KLF1 Linked with β-Thalassemia-like Phenotypes

Rosa Catapano et al. Biology (Basel). .

Abstract

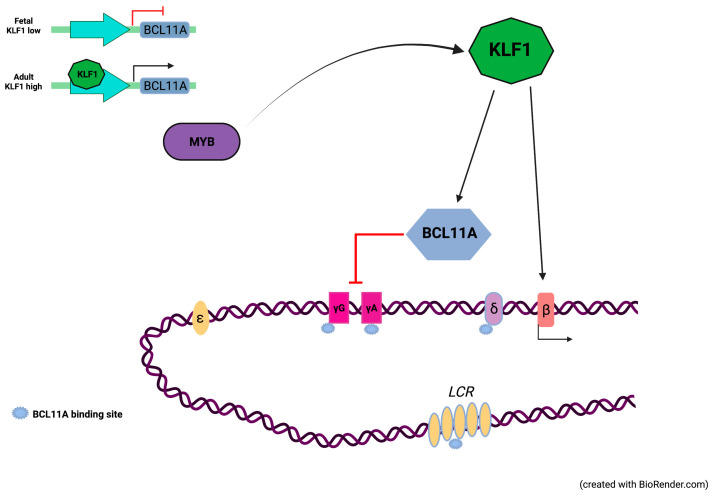
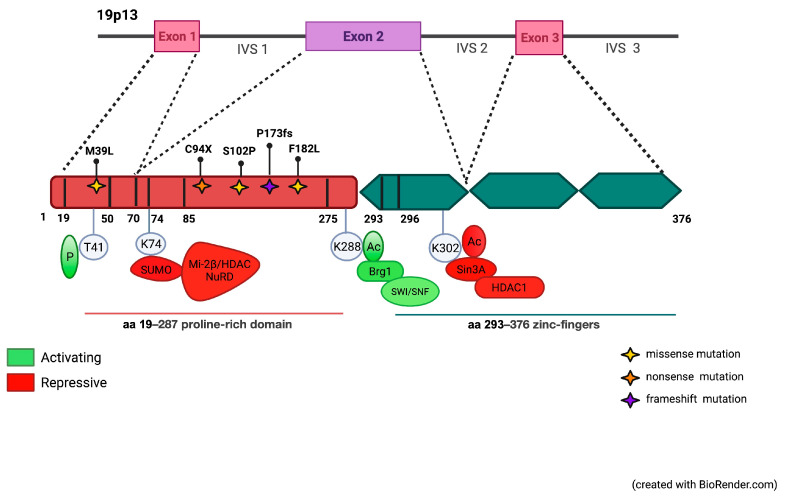
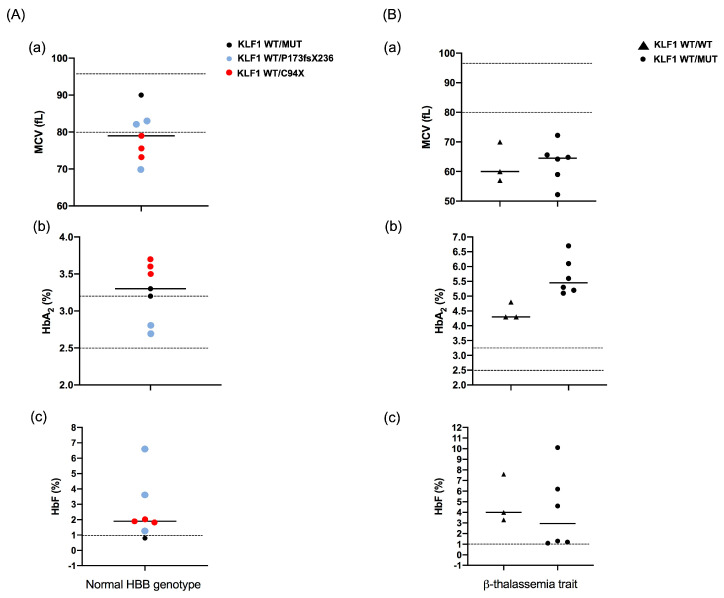
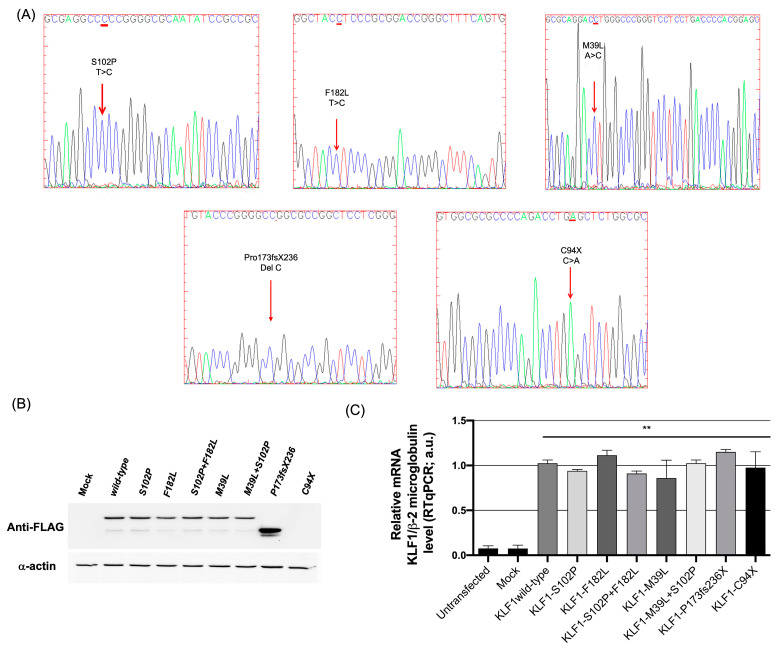
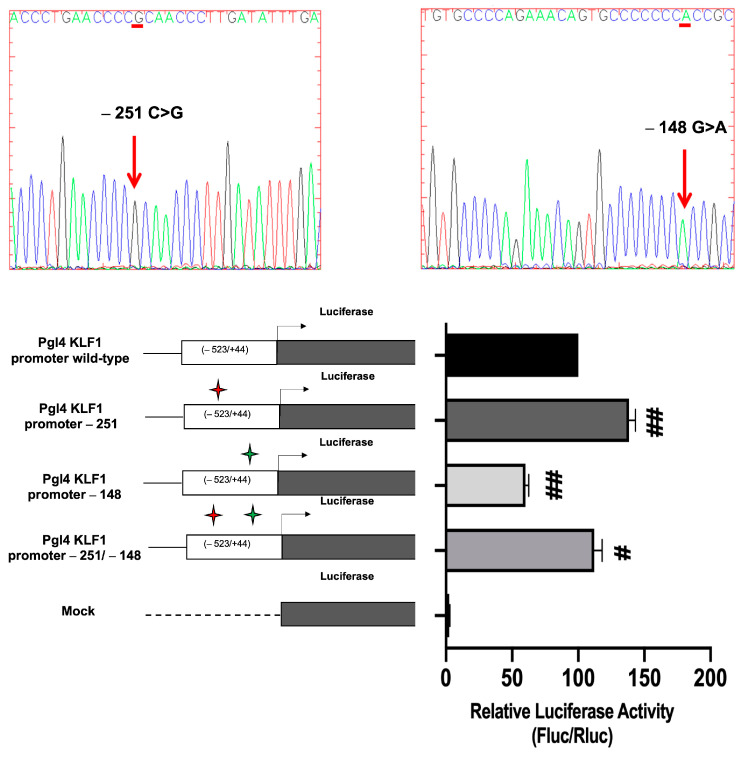
The erythroid transcriptional factor Krüppel-like factor 1 (KLF1) is a master regulator of erythropoiesis. Mutations that cause KLF1 haploinsufficiency have been linked to increased fetal hemoglobin (HbF) and hemoglobin A2 (HbA2) levels with ameliorative effects on the severity of β-thalassemia. With the aim of determining if KLF1 gene variations might play a role in the modulation of β-thalassemia, in this study we screened 17 subjects showing a β-thalassemia-like phenotype with a slight or marked increase in HbA2 and HbF levels. Overall, seven KLF1 gene variants were identified, of which two were novel. Functional studies were performed in K562 cells to clarify the pathogenic significance of these mutations. Our study confirmed the ameliorative effect on the thalassemia phenotype for some of these variants but also raised the notion that certain mutations may have deteriorating effects by increasing KLF1 expression levels or enhancing its transcriptional activity. Our results indicate that functional studies are required to evaluate the possible effects of KLF1 mutations, particularly in the case of the co-existence of two or more mutations that could differently contribute to KLF1 expression or transcriptional activity and consequently to the thalassemia phenotype.

Keywords: HbA2; HbF; KLF1; gene expression; globin gene switching; thalassemia.


Conflict of interest statement

The authors declare no conflict of interest.

Figures

Figure 1
Figure 1
Globin gene activation is dependent upon the expression levels of KLF1. KLF1 directly activates the β-globin gene (HBB) and indirectly represses γ-globin genes (HBG1/2) through BCL11A, a repressor of γ-globin gene expression. In the fetal stage, limited KLF1 levels are associated with low expression levels of BCL11A, consequently fetal globin genes are expressed at high levels. In the adult stage, KLF1 is subject to transcriptional activation by c-Myb. At high levels, KLF1 promotes transcriptional activation of HBB and BCL11A thus contributing to the fetal-to-adult globin gene switching (Created with BioRender.com, accessed on 2 September 2021. Agreement number JR22WOKLFG).
Figure 2
Figure 2
Schematic representation of the KLF1 gene and its protein domains. KLF1 activity is modulated by post-translational modifications promoting protein–protein interactions. Sites of phosphorylation, sumoylation, acetylation, and ubiquitinylation modifications and their effects on subsequent protein–protein interactions and transcriptional readouts are shown. Modifications that are essential for activation are shown in green; repressive modifications in red. Mutations in the proline-rich domain reported in this study are shown (Created with BioRender.com, accessed on 2 September 2021. Agreement number HD22WOKT15).
Figure 3
Figure 3
Effects of KLF1 mutations on hematological parameters. (A) MCV (A(a)), HbA2 (A(b)), and HbF (A(c)) levels in subjects heterozygous for KLF1 mutations with a normal HBB genotype. Red and blue circles correspond to values of subjects heterozygous for C94X and P173fsX236 mutations, respectively. Black circles correspond to heterozygotes for other pathogenic KLF1 variants; (B) MCV (B(a)), HbA2 (B(b)), and HbF (B(c)) levels in subjects with a β-thalassemia trait and wild-type (triangle) or mutant KLF1 (circle). For each parameter, horizontal lines indicate mean values. Reference range values are shown as dotted lines: MCV, 80–97 fL; HbA2, 2.5–3.2%; HbF, <1%.
Figure 4
Figure 4
Evaluation of expression levels of KLF1 mutants in K562 cells. (A) Sanger electropherograms showing the mutations generated in the KLF1 expression vector (p3XFLAG wild-type, p3XFLAG-C94X, p3XFLAG-P173fsX236, p3XFLAG-S102P, p3XFLAG-F182L, and p3XFLAG1-M39L); (B) Western blot analysis showing expression levels of normal and mutated KLF1 constructs in K562 cells transiently transfected with p3XFLAG wild-type, p3XFLAG-S102P, p3XFLAG-F182L, p3XFLAG-S102P + F182L, p3XFLAG-M39L, p3XFLAG-M39L + S102P, p3XFLAG-P173fsX236, and p3XFLAG-C94X) (Figure S1 shows the original image in the supplementary material); (C) Real-time PCR analysis showing expression levels of endogenous KLF1 in untransfected K562 cells and in K562 cells transiently transfected with wild-type and mutant KLF1 vectors or the mock control. All data represent the mean ± SD of three independent experiments. Statistical analysis was performed by one-way ANOVA, followed by Dunnett’s multiple comparisons test. Differences versus untransfected cells and mock controls were considered highly significant when p < 0.0001 (**). ANOVA: analysis of variance; SD: standard deviation.
Figure 5
Figure 5
Expression levels of KLF1 target genes in K562 cells transiently transfected with wild-type and mutant KLF1 vectors. Real-time PCR analysis of (A) β-globin (HBB), (B) BCL11A, (C) ZBTB7A, and (D) γ-globin (HBG1/2) mRNA levels in K562 cells transfected with wild-type and mutant KLF1 constructs. β2-microglobulin was used as a reference gene for the relative normalization of gene expression analysis. Data are presented as fold-changes to the mock control. All data represent the mean ± SD of three independent experiments. Statistical analysis was performed by one-way ANOVA, followed by Dunnett’s multiple comparisons test, where appropriate. Differences were considered significant when p < 0.05 (*) (#) and highly significant when p < 0.0001 (**) (##) versus each respective mock and KLF1 wild-type control group. ANOVA: analysis of variance; SD: standard deviation.
Figure 6
Figure 6
Effects of KLF1 mutations on β-globin production. (A) Luciferase activity assay in K562 cells co-transfected with a plasmid containing the β-globin promoter cloned 5′ to the luciferase reporter gene and KLF1 wild-type or mutant expression vectors. The histogram represents the relative firefly luciferase activity relative to the Renilla luciferase activity (relative luminescence units-LRU) expressed as percentage of activity of the β-globin promoter; (B) schematic representation of the luciferase gene reporter vector showing the β-globin promoter region containing a KLF1 binding site and cloned upstream the luciferase gene. All data represent the mean ± SD of three independent experiments. Statistical analysis was performed by one-way ANOVA, followed by Dunnett’s multiple comparisons test, where appropriate. Differences were considered highly significant when p < 0.0001 (**) (##) versus each respective mock or KLF1 wild-type control group. ANOVA: analysis of variance; SD: standard deviation.
Figure 7
Figure 7
Prediction of transcription binding sites on wild-type and mutated KFL1 promoter sequences. (A) Prediction of transcription factors binding sites (TFBS) on KFL1 promoter, by JASPAR tool (score cutoff set at 8.5), reveals different transcription factor binding profiles on wild-type and mutated −251 C > G and −148 G > A sequences. (B) The table reports the significant TFBS scores found within forward (+) and reverse (−) strands.
Figure 8
Figure 8
Base conservation scores in the KLF1 promoter region. In this figure, we represented the Conservation Scores of Chromosome-19 bases on the negative strand, showing the two segments containing mutation –251C and −148G positions (starred indicated position 12998205 and position 12998102, colored in grey, respectively). Below each base (colored-coded with blue for Cs, red for Ts, black for Gs, and green for As), we reported the respective PhyloP100way score from the VarSome database, presented in the form of a diagram. Based on 99 vertebrate genome sequences aligned to the human genome, the PhyloP100way score represents the individual alignment site conservation state. A positive score indicates sites that are predicted to be conserved; on the other hand, a negative score indicates sites that are predicted to be fast evolving. As shown in the lower panel (black bar graph), the slightly positive score for −251C (+0.178) indicates that this base position is poorly conserved whereas the intermediate value of the negative score for −148G (−0.824) is consistent with a moderately evolving base position.
Figure 9
Figure 9
Luciferase activity assay in K562 cells transfected with mutants and wild-type constructs of the KLF1 promoter. (Upper part) Sanger DNA sequencing analysis showing the mutations generated in the KLF1 expression vector; (lower part) the histogram shows the mean values of Firefly and Renilla luciferase activity ratios (relative bioluminescence units-LRU) for each sample. Red and green stars indicate the presence of the −251 C > G and −148 G > A sequence variations, respectively, in the constructs in exam. The data shown are the mean ± SD of three independent experiments. Statistical analysis was performed by one-way ANOVA, followed by Dunnett’s multiple comparison tests, where appropriate. Differences were considered significant when p < 0.05 (#) and highly significant when p < 0.0001 (##) versus pGL4 KLF1 promoter wild-type.

Similar articles

Cited by

References

    1. Origa R. β-Thalassemia. Genet. Med. 2017;19:609–619. doi: 10.1038/gim.2016.173. - DOI - PubMed
    1. De Martino M., Sessa R., Rosaria Storino M., Giuliano M., Trombetti S., Catapano R., Lo Bianco A., Izzo P., Grosso M. Transcriptional Repressors of Fetal Globin Genes as Novel Therapeutic Targets in Beta-Thalassemia. In: Zakaria M., Hassan T., editors. Beta Thalassemia. IntechOpen; London, UK: 2020.
    1. Suzuki M., Yamamoto M., Engel J.D. Fetal Globin Gene Repressors as Drug Targets for Molecular Therapies to Treat the β-Globinopathies. Mol. Cell. Biol. 2014;34:3560–3569. doi: 10.1128/MCB.00714-14. - DOI - PMC - PubMed
    1. Steinberg M.H. Fetal Hemoglobin in Sickle Hemoglobinopathies: High HbF Genotypes and Phenotypes. J. Clin. Med. 2020;9:3782. doi: 10.3390/jcm9113782. - DOI - PMC - PubMed
    1. Wilber A., Nienhuis A.W., Persons D.A. Transcriptional Regulation of Fetal to Adult Hemoglobin Switching: New Therapeutic Opportunities. Blood. 2011;117:3945–3953. doi: 10.1182/blood-2010-11-316893. - DOI - PMC - PubMed

LinkOut - more resources