. 2023 Apr 16;12(4):604.
doi: 10.3390/biology12040604.

Factors Limiting Radial Growth of Conifers on Their Semiarid Borders across Kazakhstan

Affiliations

Factors Limiting Radial Growth of Conifers on Their Semiarid Borders across Kazakhstan

Nariman B Mapitov et al. Biology (Basel). .

Abstract

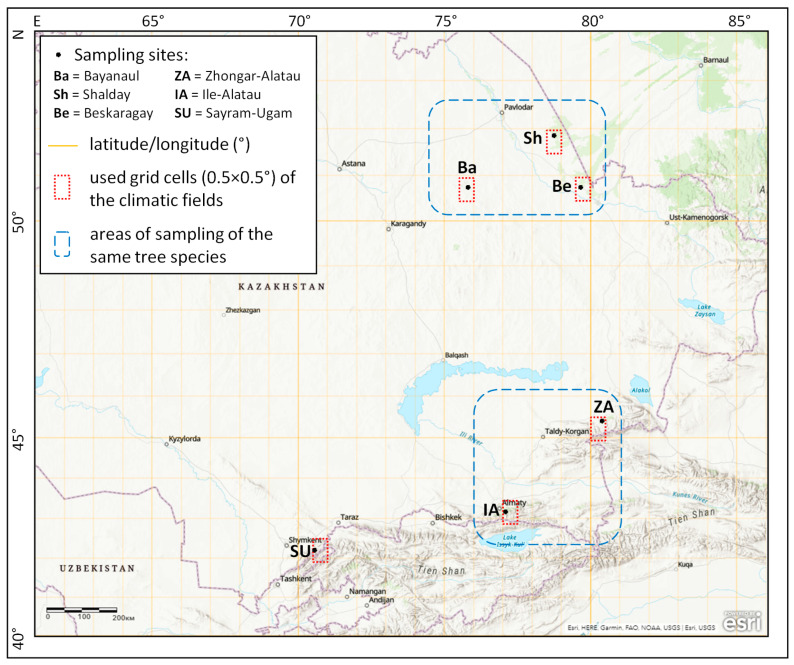
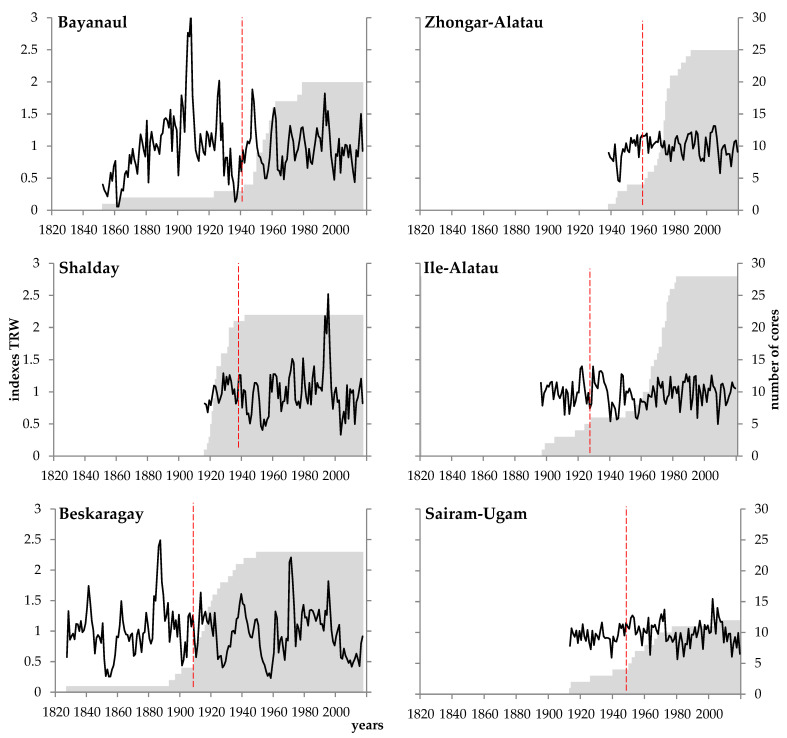
The forests of Central Asia are biodiversity hotspots at risk from rapid climate change, but they are understudied in terms of the climate-growth relationships of trees. This classical dendroclimatic case study was performed for six conifer forest stands near their semiarid boundaries across Kazakhstan: (1-3) Pinus sylvestris L., temperate forest steppes; (4-5) Picea schrenkiana Fisch. & C.A. Mey, foothills, the Western Tien Shan, southeast; (6) Juniperus seravschanica Kom., montane zone, the Western Tien Shan, southern subtropics. Due to large distances, correlations between local tree-ring width (TRW) chronologies are significant only within species (pine, 0.19-0.50; spruce, 0.55). The most stable climatic response is negative correlations of TRW with maximum temperatures of the previous (from -0.37 to -0.50) and current (from -0.17 to -0.44) growing season. The strength of the positive response to annual precipitation (0.10-0.48) and Standardized Precipitation Evapotranspiration Index (0.15-0.49) depends on local aridity. The timeframe of climatic responses shifts to earlier months north-to-south. For years with maximum and minimum TRW, differences in seasonal maximal temperatures (by ~1-3 °C) and precipitation (by ~12-83%) were also found. Heat stress being the primary factor limiting conifer growth across Kazakhstan, we suggest experiments there on heat protection measures in plantations and for urban trees, alongside broadening the coverage of the dendroclimatic net with accents on the impact of habitat conditions and climate-induced long-term growth dynamics.

Keywords: Kazakhstan; climate–growth relationship; conifers; lower forest boundary; tree-ring width.


Conflict of interest statement

The authors declare no conflict of interest. The funders had no role in the design of this study; in the collection, analyses, or interpretation of data; in the writing of the manuscript; or in the decision to publish the results.

Figures

Figure A1
Figure A1
The sampling sites (Ba—Bayanaul, Sh—Shalday, Be—Beskaragay, ZA—Zhongar-Alatau, IA—Ile-Alatau, and SU—Sairam-Ugam).
Figure A2
Figure A2
Average monthly climatic characteristics for geographic grid cell where the sampling site Sairam-Ugam (SU) is located (CRU TS 1901–2020), and at the closest meteostation in Shymkent City (42°19′ N 69°37′ E, 402 m a.s.l.; 1981–2010; http://www.pogodaiklimat.ru/climate/38328.htm; accessed on 10 April 2023) on plains to the west of that area. Lines represent maximum (dark), mean (medium), and minimum (light) temperatures; bars represent precipitation. Note that despite severe differences in the mean values of both temperatures and precipitation, their seasonal curves are remarkably similar between plains and mountains. Since the sampling site is located in the foothills on the western side of the grid cell, we should expect the mean values of temperature and precipitation to be in between the two presented diagrams.
Figure 1
Figure 1
The study area. Markers represent sampling sites (Ba—Bayanaul, Sh—Shalday. Be—Beskaragay, ZA—Zhongar-Alatau, IA—Ile-Alatau, SU—Sairam-Ugam); small dotted rectangles represent geographic grid cells 0.5 × 0.5° for which climatic series from spatially distributed fields were used in correlation analysis; dashed rectangles mark sites where the same tree species were sampled. The map was created in the ArcGIS tool (https://www.arcgis.com/home/webmap/viewer.html; accessed on 10 April 2023) © Esri.
Figure 2
Figure 2
Average monthly climatic characteristics (Climatic Research Unit Time Series, CRU TS 1901–2020) for geographic grid cells where sampling sites are located: Ba—Bayanaul, Sh—Shalday, Be—Beskaragay, ZA—Zhongar-Alatau, IA—Ile-Alatau, and SU—Sairam-Ugam. Lines represent maximum (dark), mean (medium), and minimum (light) temperatures; bars represent precipitation. Numbers represent the average annual mean temperature (T) and the average annual sum of precipitation (P). Note that at sampling sites located in mountain foothills (ZA, IA, and SU), temperatures are probably higher than the values for mountainous areas that are presented here (cf. Figure A2).
Figure 3
Figure 3
Conifer growth dynamics. Line represents standard local chronology; shaded area represents sample depth (number of cores for each year); and vertical dashed line shows the first year of EPS ≥ 0.85, i.e., beginning of period suitable for dendroclimatic analysis.
Figure 4
Figure 4
Correlation coefficients of local standard tree-ring chronologies (B—Bayanaul, C—Shalday. Be—Beskaragay, ZA—Zhongar-Alatau, IA—Ile-Alatau, and SU—Sairam-Ugam) with monthly series of precipitation, maximal, mean, and minimal temperatures from previous June to current September. Color gradient marks correlation values (green, positive; red, negative; see legend). Correlations marked with bold black font are significant at p < 0.05. Asterisks (*) mark months of the previous year.
Figure 5
Figure 5
Characteristics of the pointer years, i.e., years with the highest/lowest tree-ring width (TRW) indices at each sampling site (Ba—Bayanaul, Sh—Shalday, Be—Beskaragay, ZA—Zhongar-Alatau, IA—Ile-Alatau, and SU—Sairam-Ugam): mean values (markers) and standard deviations (whiskers) for TRW, average maximal temperature for previous (prev_Tmax) and current growing season (curr_Tmax), sum of precipitation for previous (prev_P) and current growing season (curr_P), annual sum of precipitation (year_P), and average SPEI (year_SPEI). Site-specific intervals of the seasonal generalizing for climatic variables are as presented in Table 4. Marking (−) and (+) represent sets of five negative and five positive pointer years, respectively (years with minimal/maximal values of TRW indices within cover period of climatic series). Presented values of the significance level p were calculated for differences in means between negative and positive pointer years (p < 0.05 marked by red font). Data points are color-coded by type of variable: TRW, brown; temperature, red; precipitation, blue; SPEI, green. All variables are linearly transformed into z-scores (mean = 0; standard deviation SD = 1).

References

    1. Breshears D.D., Whicker J.J., Johansen M.P., Pinder J.E. Wind and water erosion and transport in semi-arid shrubland, grassland and forest ecosystems: Quantifying dominance of horizontal wind-driven transport. Earth Surf. Process. Landf. 2003;28:1189–1209. doi: 10.1002/esp.1034. - DOI
    1. FAO . The State of the World’s Forests 2018—Forest Pathways to Sustainable Development. Food and Agriculture Organization; Rome, Italy: 2018.
    1. Jhariya M.K., Banerjee A., Meena R.S., Yadav D.K. Sustainable Agriculture, Forest and Environmental Management. Springer; Singapore: 2019. - DOI
    1. Verkerk P.J., Costanza R., Hetemäki L., Kubiszewski I., Leskinen P., Nabuurs G.J., Potocnik J., Palahi M. Climate-smart forestry: The missing link. For. Policy Econ. 2020;115:102164. doi: 10.1016/j.forpol.2020.102164. - DOI
    1. Carrer M., Urbinati C. Age-dependent tree-ring growth responses to climate in Larix decidua and Pinus cembra. Ecology. 2004;85:730–740. doi: 10.1890/02-0478. - DOI

LinkOut - more resources