

Comparative Analysis of Epididymis Cauda of Yak before and after Sexual Maturity
- PMID: 37106918
- PMCID: PMC10135020
- DOI: 10.3390/ani13081355
Comparative Analysis of Epididymis Cauda of Yak before and after Sexual Maturity
Abstract
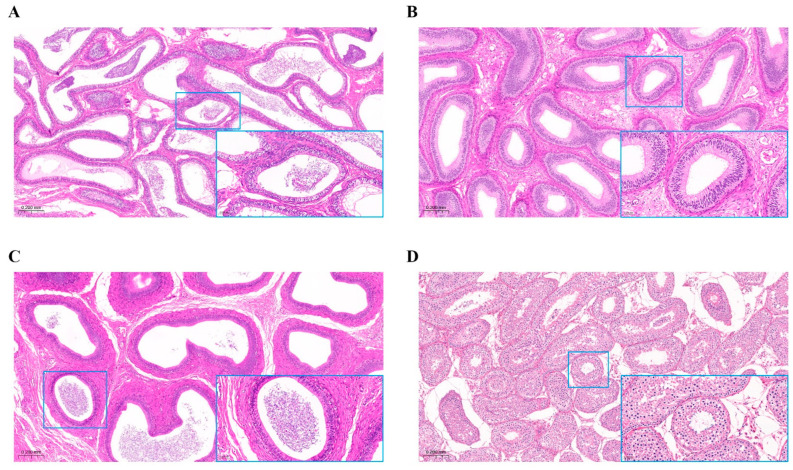
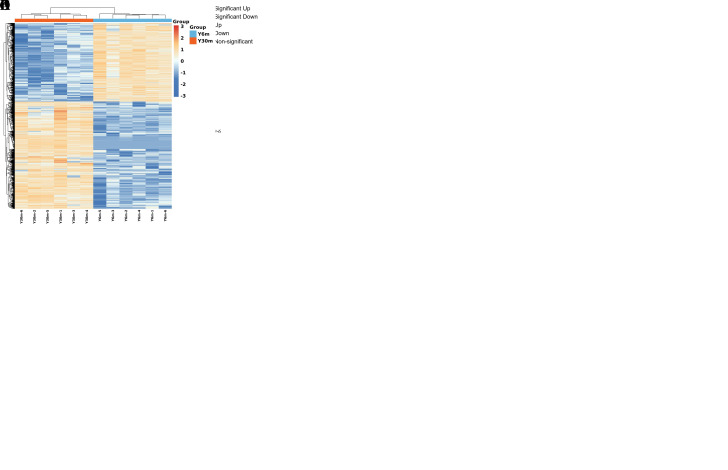
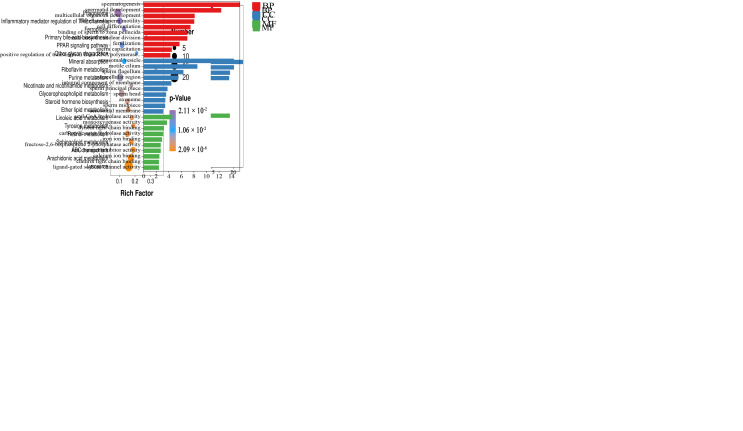
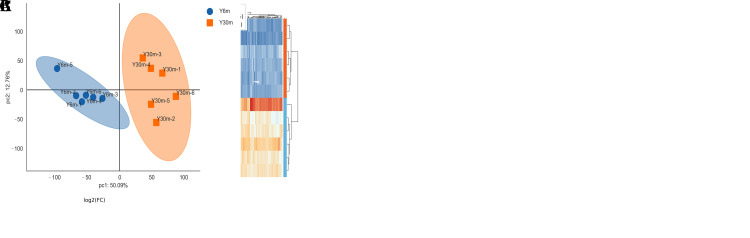
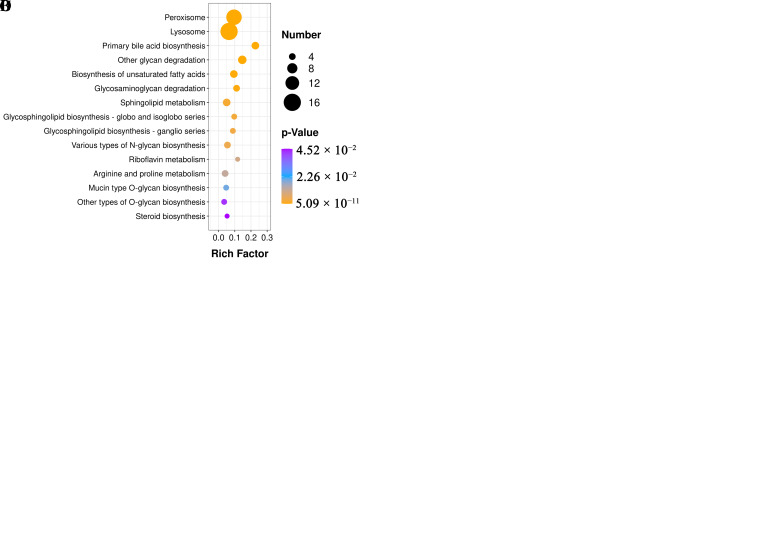
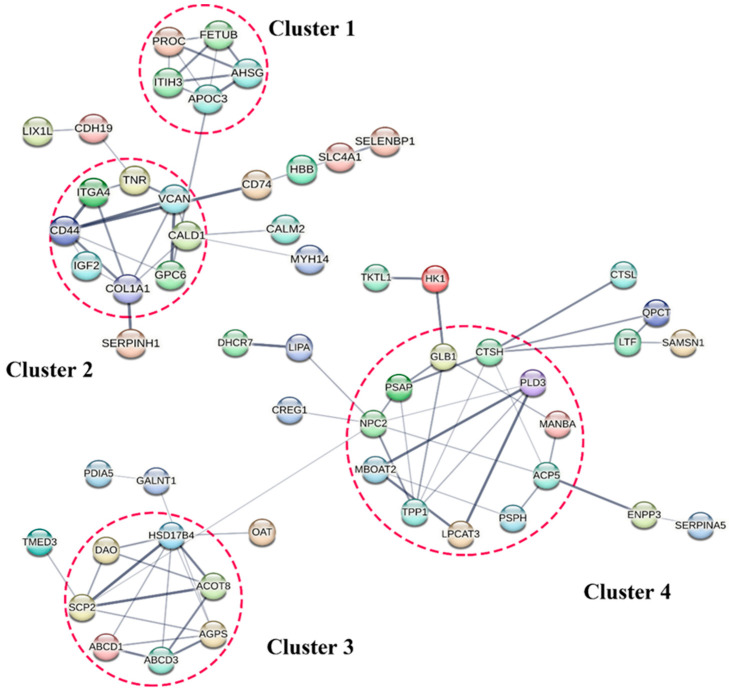
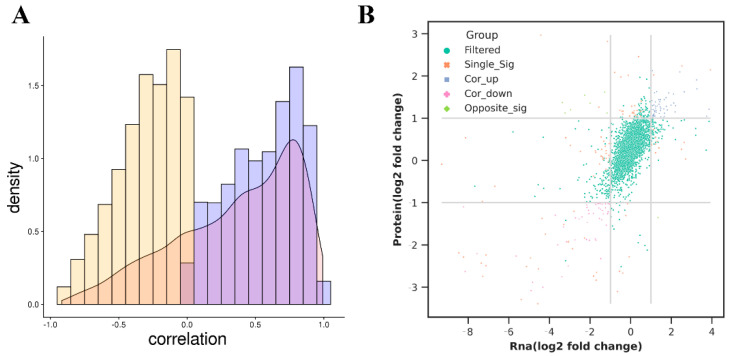
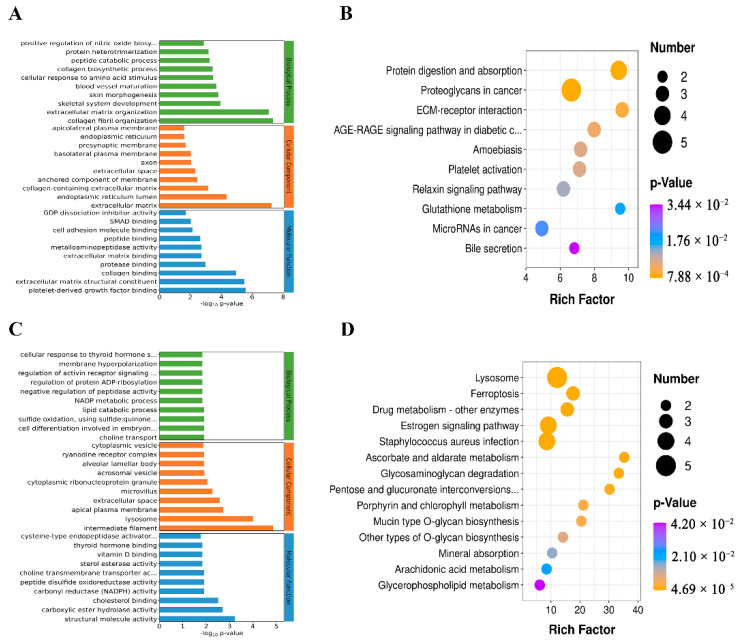
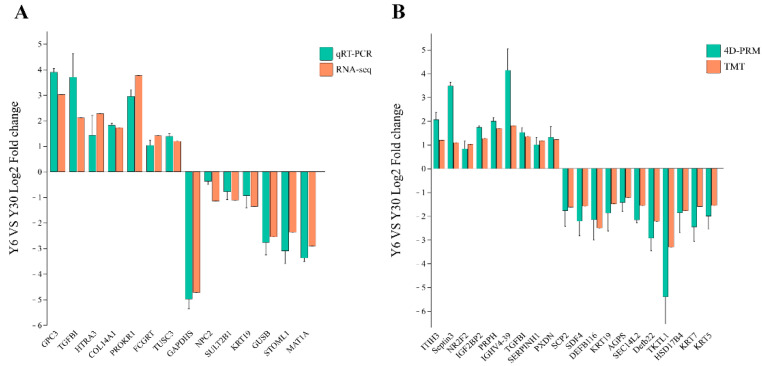
Epididymis development is the basis of male reproduction and is a crucial site where sperm maturation occurs. In order to further understand the epididymal development of yak and how to regulate sperm maturation, we conducted a multi-omics analysis. We detected 2274 differential genes, 222 differential proteins and 117 co-expression genes in the cauda epididymis of yak before and after sexual maturity by RNA-seq and proteomics techniques, which included TGFBI, COL1A1, COL1A2, COL3A1, COL12A1, SULT2B1, KRT19, and NPC2. These high abundance genes are mainly related to cell growth, differentiation, adhesion and sperm maturation, and are mainly enriched via extracellular matrix receptor interaction, protein differentiation and absorption, and lysosome and estrogen signaling pathways. The abnormal expression of these genes may lead to the retardation of epididymal cauda development and abnormal sperm function in yak. In conclusion, through single and combined analysis, we provided a theoretical basis for the development of the yak epididymal cauda, sperm maturation, and screening of key genes involved in the regulation of male yak reproduction.
Keywords: RNA-seq; epididymis; proteomics; sperm maturation; yak.
Conflict of interest statement
The authors declare no conflict of interest.
Figures
Similar articles
-
Characteristic analysis of N6-methyladenine in different parts of yak epididymis.BMC Genomics. 2025 May 19;26(1):500. doi: 10.1186/s12864-025-11684-w. BMC Genomics. 2025. PMID: 40389816 Free PMC article.
-
Region-specific gene expression in the epididymis of Yak.Theriogenology. 2019 Nov;139:132-146. doi: 10.1016/j.theriogenology.2019.08.006. Epub 2019 Aug 5. Theriogenology. 2019. PMID: 31404823
-
The expression spectrum of yak epididymal epithelial cells reveals the functional diversity of caput, corpus and cauda regions.Genomics. 2024 Sep;116(5):110912. doi: 10.1016/j.ygeno.2024.110912. Epub 2024 Aug 6. Genomics. 2024. PMID: 39117249 Review.
-
Comparative iTRAQ proteomics identified proteins associated with sperm maturation between yak and cattleyak epididymis.BMC Vet Res. 2021 Jul 26;17(1):255. doi: 10.1186/s12917-021-02907-9. BMC Vet Res. 2021. PMID: 34311720 Free PMC article.
-
The current perspective on genetic and epigenetic factors in sperm maturation in the epididymis.Andrologia. 2021 Apr;53(3):e13989. doi: 10.1111/and.13989. Epub 2021 Jan 25. Andrologia. 2021. PMID: 33491190 Review.
Cited by
-
Characteristic analysis of N6-methyladenine in different parts of yak epididymis.BMC Genomics. 2025 May 19;26(1):500. doi: 10.1186/s12864-025-11684-w. BMC Genomics. 2025. PMID: 40389816 Free PMC article.
References
Grants and funding
LinkOut - more resources
Full Text Sources
Miscellaneous
