. 2023 Mar 26;12(4):808.
doi: 10.3390/antiox12040808.

By-Product Extracts from Castanea sativa Counteract Hallmarks of Neuroinflammation in a Microglial Model

Affiliations

By-Product Extracts from Castanea sativa Counteract Hallmarks of Neuroinflammation in a Microglial Model

Pasquale Marrazzo et al. Antioxidants (Basel). .

Abstract

Castanea sativa is very common in Italy, and the large amount of waste material generated during chestnut processing has a high environmental impact. Several studies demonstrated that chestnut by-products are a good source of bioactive compounds, mainly endowed with antioxidant properties. This study further investigates the anti-neuroinflammatory effect of chestnut leaf and spiny bur extracts, together with the deepest phytochemical characterisation (by NMR and MS) of active biomolecules contained in leaf extracts, which resulted in being more effective than spiny bur ones. BV-2 microglial cells stimulated with lipopolysaccharide (LPS) were used as a model of neuroinflammation. In BV-2 cells pre-treated with chestnut extracts, LPS signalling is partially blocked via the reduced expression of TLR4 and CD14 as well as the expression of LPS-induced inflammatory markers. Leaf extract fractions revealed the presence of specific flavonoids, such as isorhamnetin glucoside, astragalin, myricitrin, kaempferol 3-rhamnosyl (1-6)(2″-trans-p-coumaroyl)hexoside, tiliroside and unsaturated fatty acids, all of which could be responsible for the observed anti-neuroinflammatory effects. Interestingly, the kaempferol derivative has been identified in chestnut for the first time. In conclusion, the exploitation of chestnut by-products is suitable for the achievement of two goals: satisfaction of consumers' demand for new, natural bio-active compounds and valorisation of by-products.

Keywords: BV-2; Castanea sativa; NF-kB; Toll-like receptor 4; chestnut by-products; flavonoids; microglia; neuroinflammation; waste valorisation.


Conflict of interest statement

The authors declare no conflict of interest.

Figures

Figure 1
Figure 1
Analysis of LPS binding to BV-2 cells after treatment with chestnut leaf or spiny bur extracts. BV-2 cells were pre-treated (or not) with spiny bur (SB) or leaf (L) extracts (0.5 mg/mL) for 3 h, then incubated with 0.5 μg/mL LPS-FITC for a total of 24 h. The fluorescence of bound LPS was evaluated by flow cytometric analysis of live cells. (a) Representative plot of untreated controls and LPS-treated cells (b) Relative quantification is expressed as MFI, the median fluorescence intensity. Results are expressed as means ± SEM of three independent experiments. Statistical analysis was performed by Fisher’s LSD test following one-way ANOVA. ° p < 0.05 significantly different from control cells.
Figure 2
Figure 2
Cell surface level of TLR4 in BV-2 cells treated with chestnut leaf or spiny bur extracts and LPS. BV-2 cells were pre-treated (or not) with spiny bur (SB) or leaf (L) extracts (0.5 mg/mL) for 3 h, incubated with or without LPS (0.5 μg/mL) for a total of 24 h, then subjected to flow cytometric analysis of the immunostaining for TLR4 receptor. (a) Representative plots of untreated BV-2 cells (b) Representative plots of BV-2 cells not activated with LPS (c) Representative plots of LPS-stimulated BV-2 cells (d) Relative quantification is expressed as MFI, median fluorescence intensity. Results are expressed as means ± SEM of three independent experiments. Statistical analysis was performed by Fisher’s LSD test following one-way ANOVA. ° p < 0.05 significantly different from control cells; * p < 0.05 significantly different from LPS-treated cells.
Figure 3
Figure 3
RT-PCR analysis of TLR4 gene expression in BV-2 cells treated with chestnut extracts. BV-2 cells were treated with spiny bur or leaf extracts (0.5 mg/mL) for 3 h, then stimulated (or not) with LPS (0.5 µg/mL) for a total of 24 h. At the end of incubation, RNA was extracted from cells and samples were subjected to RT-PCR analysis using a specific primer for TLR4, as explained in the Materials and Methods section. The relative mRNA content of TLR4 was normalised to (a) untreated control and (b) untreated LPS control. Relative quantification is obtained as reported in the Materials and Methods section; results are expressed as means ± SEM of three independent experiments. Statistical analysis was performed by Fisher’s LSD test following one-way ANOVA. ° p < 0.05 significantly different from control cells; * p < 0.05 significantly different from LPS-treated cells.
Figure 4
Figure 4
RT-PCR analysis of CD14 gene expression in BV-2 cells treated with chestnut leaf or spiny bur extracts. BV-2 cells were treated with spiny bur or leaf extracts (0.5 mg/mL) for 3 h, then stimulated (or not) with LPS (0.5 μg/mL) for a total of 24 h. At the end of incubation, RNA was extracted from cells and samples were subjected to RT-PCR analysis using a specific primer for CD14, as reported in the Materials and Methods section. The relative mRNA content of CD14 was normalised to untreated cells stimulated with LPS. Relative quantification is obtained as explained in the Materials and Methods section; results are expressed as means ± SEM of three independent experiments. Statistical analysis was performed by Fisher’s LSD test following one-way ANOVA. ° p < 0.05 significantly different from control cells; * p < 0.05 significantly different from LPS-treated cells.
Figure 5
Figure 5
RT-PCR analysis of inflammatory markers gene expression in BV-2 cells treated with chestnut extracts. BV-2 cells were treated with spiny bur (SB) or leaf (L) extracts (0.5 mg/mL) for 3 h, then stimulated (or not) with 0.5 μg/mL LPS (red bars) for a total of 24 h. At the end of incubation, RNA was extracted, and samples were subjected to RT-PCR analysis using specific primers for (a) NLRP3, (b) iNOS, and (c) PGES2, as reported in the Materials and Methods section. The relative mRNA contents were normalised to LPS-treated cells. Relative quantification is obtained as described in the Materials and Methods section; results are expressed as means ± SEM of three independent experiments. Statistical analysis was performed by Fisher’s LSD test following one-way ANOVA. ° p < 0.05 significantly different from control cells; * p < 0.05 significantly different from LPS-treated cells.
Figure 6
Figure 6
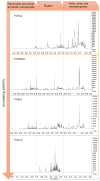
1H NMR profiling of the four fractions obtained by liquid/liquid partition of chestnut leaf extract (L). Spectral regions with the residual solvent signals were removed. Spectra of Fr. Hex, Fr. EtOAc and Fr. But were measured in CD3OD. The spectrum of Fr. H2O was acquired in a blend of CD3OD:D2O (1:1).
Figure 7
Figure 7
Kaempferol 3-rhamnosyl (1-6)(2″-trans-p-coumaroyl)hexoside isolated in fraction FR8. The arrows highlight the most important C-H correlation found through the HMBC experiment, allowing us to draw the connections between the different molecular moieties.
Figure 8
Figure 8
Cell viability of BV-2 treated with different concentrations of chestnut leaf extract fractions. BV-2 cells were treated for 3 h with (a) 100 or 200 μg/mL of different leaf-derived extract fractions or (b) 50 or 75 μg/mL of leaf-derived Fr. Hex (olive bars). Viability was evaluated by MTT assay, as described in the Materials and Methods section. Each bar represents the mean of n = 10 samples ± SEM. Statistical analysis was performed by Fisher’s LSD test following one-way ANOVA. ° p < 0.05 significantly different from control cells.
Figure 9
Figure 9
RT-PCR analysis of TLR4 and CD14 gene expression in BV-2 cells treated with different chestnut leaf extract fractions. BV-2 cells were treated for 3 h with 50 μg/mL of fractions at different polarity (L Fr.), then stimulated with 0.5 μg/mL LPS for a total of 24 h. At the end of incubation, RNA was extracted from cells and samples were subjected to RT-PCR analysis using a specific primer for TLR4 (a) and CD14 (b), as reported in the Materials and Methods section. The relative mRNA contents of TLR4 and CD14 were normalised to LPS-treated cells (red bars). Relative quantification is obtained as described in the Materials and Methods section, and results are expressed as means ± SEM of three independent experiments. Statistical analysis was performed by Fisher’s LSD test following one-way ANOVA. * p < 0.05 significantly different from LPS-treated cells.
Figure 10
Figure 10
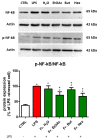
NF-kB and p-NF-kB protein expression in LPS-stimulated BV-2 cells treated with different chestnut leaf extract fractions. BV-2 cells were treated for 3 h with 50 μg/mL of fractions at different polarities obtained from L, then stimulated (or not) with 0.5 μg/mL LPS for 24 h. After cell lysis, the extracted proteins were separated by SDS-PAGE, transferred to a nitrocellulose membrane, and immunoassayed using anti-NF-kB or anti-p-NF-kB and anti-actin antibodies, as reported in the Materials and Methods section. Immunoblots are representative of three independent experiments; bars represent the densitometric analysis of immunoblotting results. Normalised expression levels were calculated relative to LPS-treated cells (red bars). Results are expressed as means ± SEM. Statistical analysis was performed by Fisher’s LSD test following one-way ANOVA. ° p < 0.05 significantly different from control cells; * p < 0.05 significantly different from LPS-treated cells.
Figure 11
Figure 11
RT-PCR analysis of IL-1β and PGES2 gene expression in BV-2 cells treated with different chestnut leaf extract fractions. BV-2 cells were treated for 3 h with 50 μg/mL of different leaf-derived extract fractions, then stimulated with 0.5 μg/mL LPS for a total of 24 h. At the end of incubation, RNA was extracted from cells and samples were subjected to RT-PCR analysis using a specific primer for IL-1β (a) and PGES2 (b), as reported in the Materials and Methods section. The relative mRNA contents were normalised to LPS-treated cells (red bars). Relative quantification is obtained as described in the Materials and Methods section; results are expressed as means ± SEM of three independent experiments. Statistical analysis was performed by Fisher’s LSD test following one-way ANOVA. * p < 0.05 significantly different from LPS-treated cells.
Figure 12
Figure 12
Gene expression and protein content of TNF-α in BV-2 cells treated with different chestnut leaf extract fractions. BV-2 cells were treated for 3 h with 50 μg/mL of different leaf-derived extract fractions, then stimulated with 0.5 μg/mL LPS for a total of 24 h. (a) At the end of incubation, RNA was extracted from cells and samples were subjected to RT-PCR analysis using a specific primer for TNF-α, as explained in the Materials and Methods section. The relative mRNA contents were normalised to LPS-treated cells (red bars). Relative quantification is obtained as described in the Materials and Methods section (b) Cellular content of TNF-α was quantified by ELISA assay as described in the Materials and Methods section. Results are expressed as means ± SEM of three independent experiments. Statistical analysis was performed by Fisher’s LSD test following one-way ANOVA. ° p < 0.05 significantly different from control cells; * p < 0.05 significantly different from LPS-treated cells.
Figure 13
Figure 13
Gene expression and protein level of NLRP3 in BV-2 cells treated with different chestnut leaf extract fractions. BV-2 cells were treated for 3 h with 50 μg/mL of different leaf-derived extract fractions, then stimulated with 0.5 μg/mL LPS for a total of 24 h. (a) At the end of incubation, RNA was extracted from cells and samples were subjected to RT-PCR analysis using a specific primer for NLRP3, as described in the Materials and Methods section. The relative mRNA contents were normalised to LPS-treated cells (red bars). Relative quantification is obtained as described in the Materials and Methods section, and results are expressed as means ± SEM of three independent experiments. (b) After cell lysis, the extracted proteins were separated by SDS-PAGE, transferred to a nitrocellulose membrane, and immunoassayed using anti-NLRP3 and anti-actin antibodies, as explained in the Materials and Methods section. Immunoblot is representative of three independent experiments; bars represent the densitometric analysis of immunoblotting results. Normalised expression levels were calculated relative to LPS-treated cells (red bars). Statistical analysis was performed by Fisher’s LSD test following one-way ANOVA. ° p < 0.05 significantly different from control cells; * p < 0.05 significantly different from LPS-treated cells.
Figure 14
Figure 14
iNOS protein expression and NO level in BV-2 cells treated with different chestnut leaf extract fractions. BV-2 cells were treated for 3 h with 50 μg/mL of different leaf-derived extract fractions (L Fr.), then stimulated with 0.5 μg/mL LPS for a total of 24 h. (a) After cell lysis, the extracted proteins were separated by SDS-PAGE, transferred to a nitrocellulose membrane, and immunoassayed using anti-iNOS and anti-actin antibodies, as reported in the Materials and Methods section. Immunoblot is representative of three independent experiments; bars represent the densitometric analysis of immunoblotting results. Normalised expression levels were calculated relative to LPS-treated cells (red bars) (b) NO level was quantified by Griess assay as described in the Materials and Methods section. Results are expressed as means ± SEM of three independent experiments. Statistical analysis was performed by Fisher’s LSD test following one-way ANOVA. ° p < 0.05 significantly different from control cells; * p < 0.05 significantly different from LPS-treated cells.

References

    1. Almeida I.F., Fernandes E., Lima J.L.F.C., Costa P.C., Bahia M.F. Protective Effect of Castanea sativa and Quercus robur Leaf Extracts against Oxygen and Nitrogen Reactive Species. J. Photochem. Photobiol. B Biol. 2008;91:87–95. doi: 10.1016/j.jphotobiol.2008.02.001. - DOI - PubMed
    1. Barreira J., Ferreira I., Oliveira M., Pereira J. Antioxidant Activities of the Extracts from Chestnut Flower, Leaf, Skins and Fruit. Food Chem. 2008;107:1106–1113. doi: 10.1016/j.foodchem.2007.09.030. - DOI
    1. Braga N., Rodrigues F., Oliveira M.B. Castanea sativa by-Products: A Review on Added Value and Sustainable Application. Nat. Prod. Res. 2015;29:1–18. doi: 10.1080/14786419.2014.955488. - DOI - PubMed
    1. Chiarini A., Micucci M., Malaguti M., Budriesi R., Ioan P., Lenzi M., Fimognari C., Gallina Toschi T., Comandini P., Hrelia S. Sweet Chestnut (Castanea sativa Mill.) Bark Extract: Cardiovascular Activity and Myocyte Protection against Oxidative Damage. Oxidative Med. Cell. Longev. 2013;2013:471790. doi: 10.1155/2013/471790. - DOI - PMC - PubMed
    1. Squillaci G., Apone F., Sena L.M., Carola A., Tito A., Bimonte M., Lucia A.D., Colucci G., Cara F.L., Morana A. Chestnut (Castanea sativa Mill.) Industrial Wastes as a Valued Bioresource for the Production of Active Ingredients. Process Biochem. 2018;64:228–236. doi: 10.1016/j.procbio.2017.09.017. - DOI