. 2023 Mar 28;12(4):819.
doi: 10.3390/antiox12040819.

Total Flavonoids of Rhizoma Drynariae Mitigates Aflatoxin B1-Induced Liver Toxicity in Chickens via Microbiota-Gut-Liver Axis Interaction Mechanisms

Affiliations

Total Flavonoids of Rhizoma Drynariae Mitigates Aflatoxin B1-Induced Liver Toxicity in Chickens via Microbiota-Gut-Liver Axis Interaction Mechanisms

Shucheng Huang et al. Antioxidants (Basel). .

Abstract

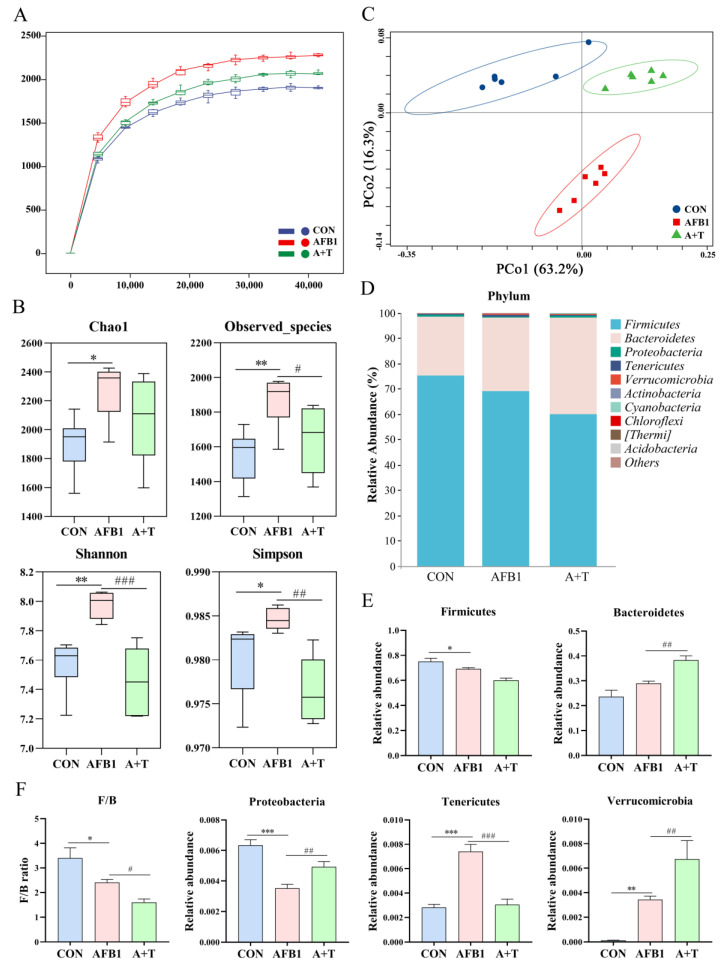
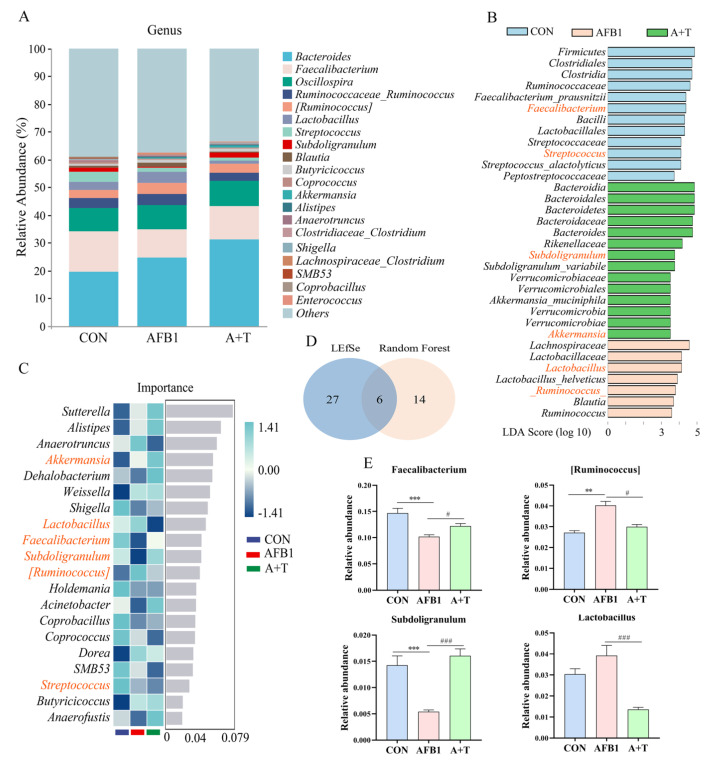
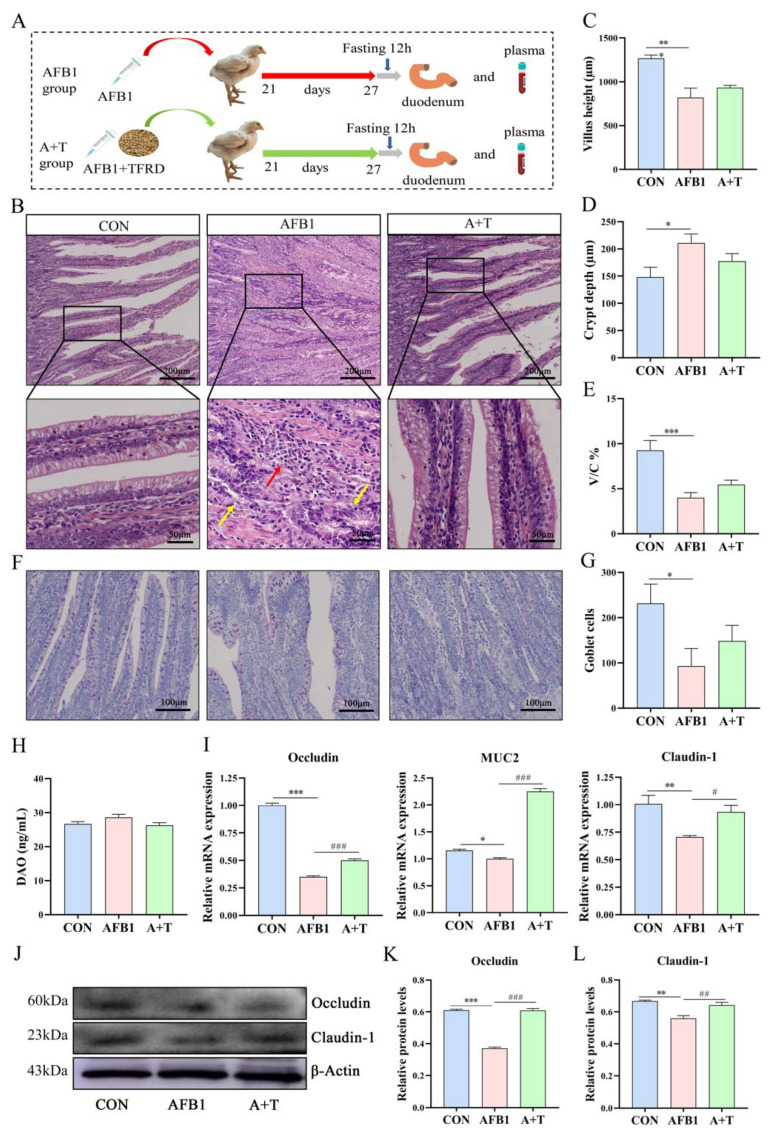
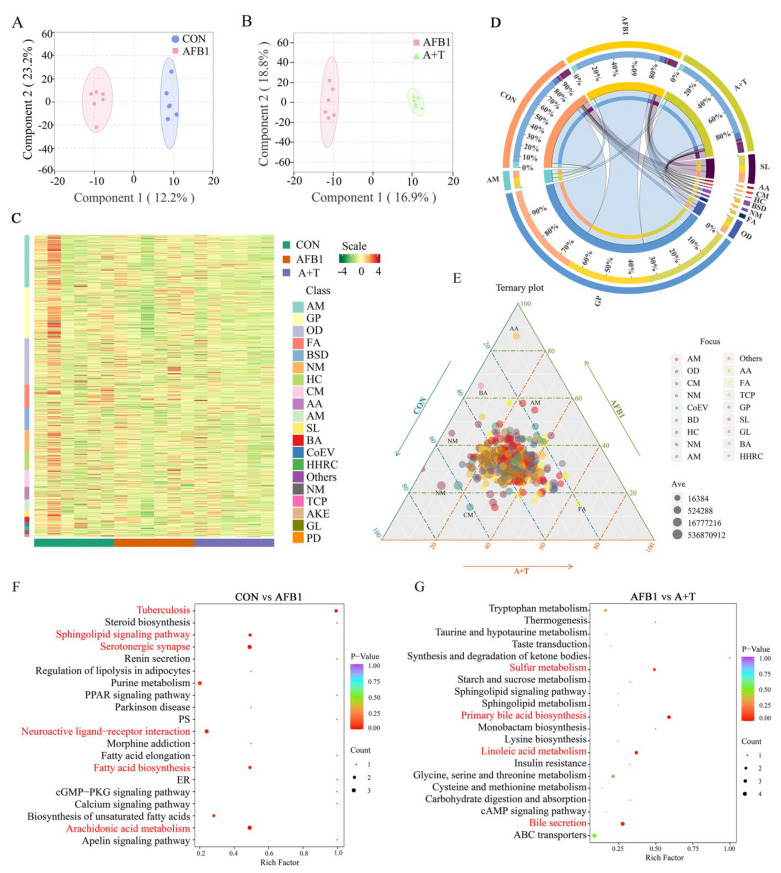
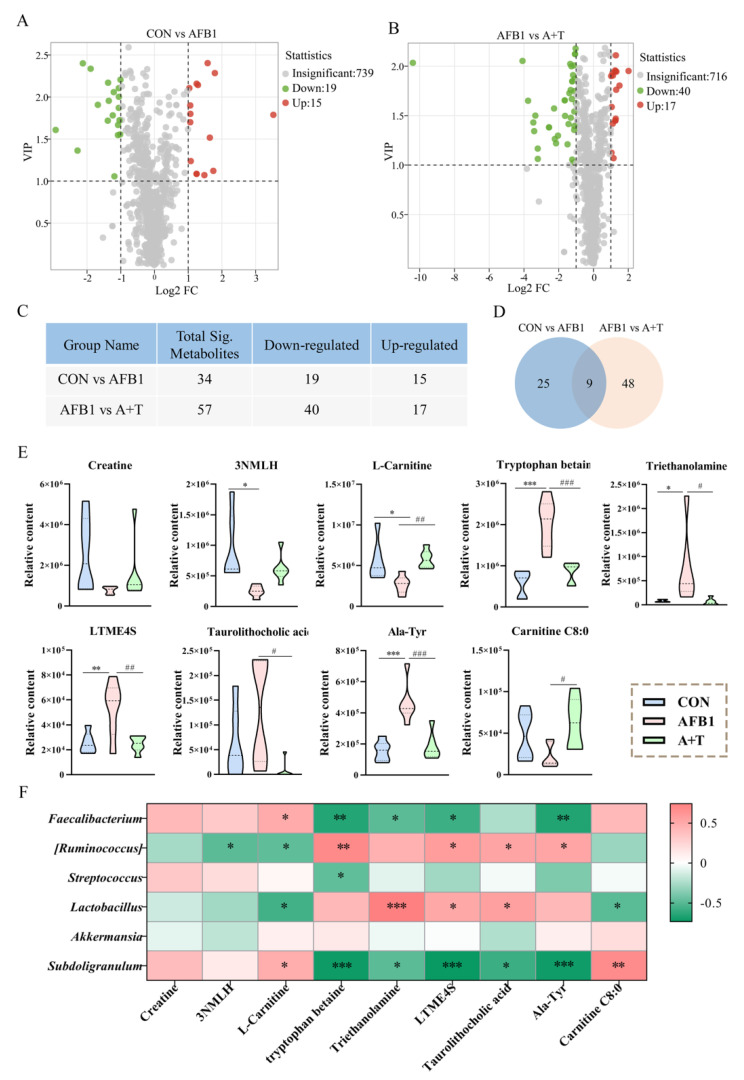
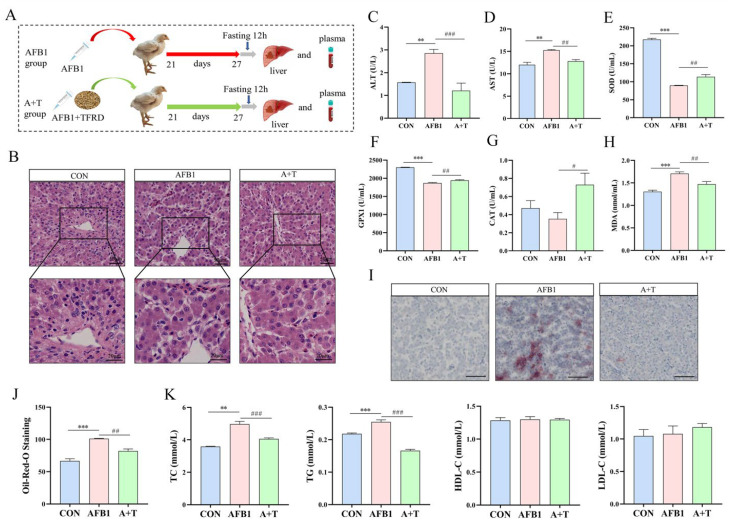
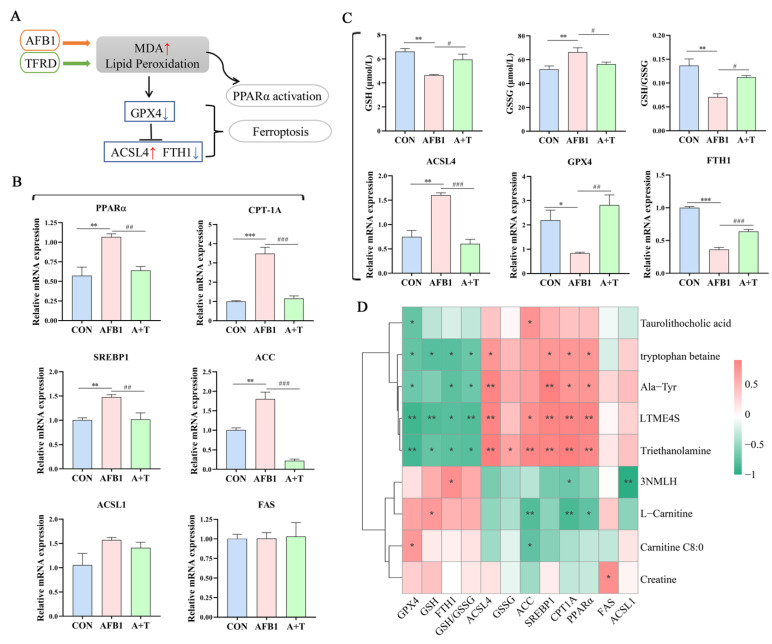
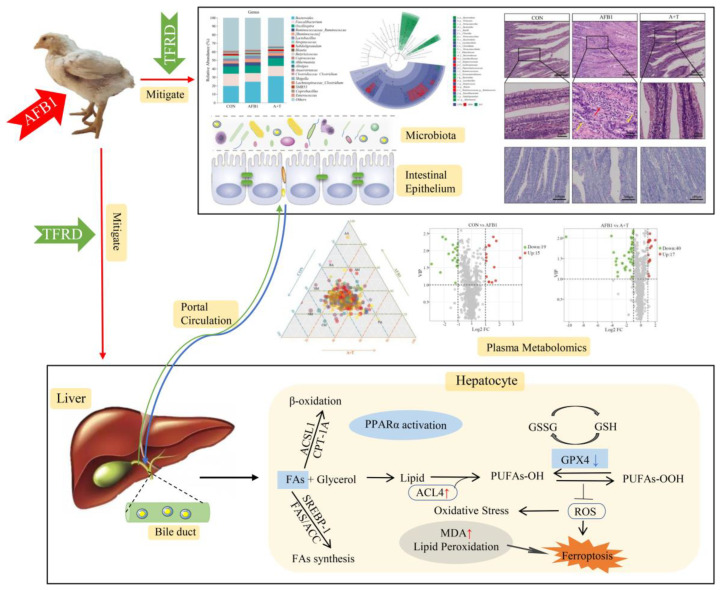
Aflatoxin B1 (AFB1) is a common mycotoxin that widely occurs in feed and has severe hepatotoxic effects both in humans and animals. Total flavonoids of Rhizoma Drynaria (TFRD), a traditional Chinese medicinal herb, have multiple biological activities and potential hepatoprotective activity. This study investigated the protective effects and potential mechanisms of TFRD against AFB1-induced liver injury. The results revealed that supplementation with TFRD markedly lessened broiler intestinal permeability by increasing the expression of intestinal tight junction proteins, as well as correcting the changes in gut microbiota and liver damage induced by AFB1. Metabolomics analysis revealed that the alterations in plasma metabolites, especially taurolithocholic acid, were significantly improved by TFRD treatment in AFB1-exposed chickens. In addition, these metabolites were closely associated with [Ruminococcus], ACC, and GPX1, indicating that AFB1 may cause liver injury by inducing bile acid metabolism involving the microbiota-gut-liver axis. We further found that TFRD treatment markedly suppressed oxidative stress and hepatic lipid deposition, increased plasma glutathione (GSH) concentrations, and reversed hepatic ferroptosis gene expression. Collectively, these findings indicate that ferroptosis might contribute to the hepatotoxicity of AFB1-exposed chickens through the microbiota-gut-liver axis interaction mechanisms; furthermore, TFRD was confirmed as an herbal extract that could potentially antagonize mycotoxins detrimental effects.

Keywords: Chinese medicinal herb; aflatoxin B1; antioxidation; bile acid; ferroptosis; gut microbiota.


Conflict of interest statement

The authors declare no conflict of interest.

Figures

Figure 1
Figure 1
The effect of TFRD on AFB1-induced abnormal variations in the composition of the gut microbiota. (A) Rarefaction curve. (B) Alpha diversity analysis of gut microbiota in experimental broiler chickens. (C) PCoA based on the Weighted–UniFrac distance matrix of OTUs. (D) Relative abundance of gut microbial composition at the phylum level (top 10). (E,F) The effects of AFB1 and TFRD on the relative abundance of microbiota at the phylum level. F/B, Firmicutes/Bacteroidetes ratio. Differences between groups were analyzed by One-way ANOVA. The presented values are the mean ± SEM (n = 6). Differences were considered significant at (*) p < 0.05, (**) p < 0.01, and (***) p < 0.001 compared to the CON group and at (#) p < 0.05, (##) p < 0.01, and (###) p < 0.001 compared to the AFB1 group.
Figure 2
Figure 2
TFRD protects against AFB1–induced abnormal changes in the gut microbiota at the genus level. (A) Relative abundance of gut microbial composition at the genus level (top 20). (B) The differential genera screened by LEfSe analysis and random forest analysis were analyzed by Venn diagram, and the coincidence part was the significantly different genera. Blue indicates CON group, red indicates AFB1 group, and green indicates A + T group. (C) Random forest analysis (top 20 in importance). Blue indicates CON group, red indicates AFB1 group, and green indicates A + T group. (D) Venn diagram analysis of differential genera. (E) Four genera changed significantly in the overlap of the Venn diagram. Differences between groups were analyzed by One–way ANOVA. The presented values are the mean ± SEM (n = 6). Differences were considered significant at (**) p < 0.01, and (***) p < 0.001 compared to the CON group and at (#) p < 0.05, and (###) p < 0.001 compared to the AFB1 group.
Figure 3
Figure 3
TFRD improved AFB1-induced intestinal mucosal barrier injury. (A) Broiler chicken ingluvies injected with AFB1 or fed with TFRD interfered with intestinal mucosal barrier function. (B) Hematoxylin and eosin (HE) staining results of the duodenum. Scale bar = 200 μm for × 4 magnification; scale bar = 50 μm for × 20 magnification (yellow arrows: intestinal villi rupture; red arrow: inflammatory cells). (CE) Villus height, crypt depth, and the ratio of villus height/crypt depth (V/C) of the duodenum. (F) Periodic Acid-Schiff (PAS) staining results of the duodenum (scale bar = 100 μm for × 10 magnification). (G) Goblet cell of the duodenum. (H) The activity of plasma diamine oxidase (DAO). (I) mRNA expression levels of occludin, MUC2, and claudin-1. (JL) Occludin and Claudin-1 protein expression levels. Differences between groups were analyzed by One–way ANOVA. The presented values are the mean ± SEM (n = 4). Differences were considered significant at (*) p < 0.05, (**) p < 0.01, and (***) p < 0.001 compared to the CON group, at (#) p < 0.05, (##) p < 0.01 and (###) p < 0.001 compared to the AFB1 group.
Figure 4
Figure 4
TFRD protects against AFB1–induced alterations in plasma metabolite. (A) OPLS–DA of the CON and AFB1 groups. (B) OPLS–DA of the AFB1 and A + T groups. (C) Heatmap of metabolite content clustering. (D) Metabolite abundance analysis by LC–MS/MS. (E) Ternary analysis shows the relative abundance of metabolites in different groups. AM, Amino acid and its metabolomics; GP, Glycerol phospholipids; OD, Organic acid and their derivatives; FA, Fatty acyl; NM, Nucleotide and its metabolomics; BSD, Benzene and substituted derivatives; HC, Heterocyclic compounds; CM, Carbohydrates and its metabolites; AA, Alcohol and amines; SL, Sphingolipids; BA, Bile acids; CoEV, CoEnzyme and vitamins; HHRC, Hormones and hormone-related compounds; TCP, Tryptamines, Cholines, Pigments; AKE, Aldehyde, Ketones, Esters; and PD, Pteridines and derivatives. (F,G) Metabolic pathway analysis based on significantly differential metabolites from the CON, AFB1, and A + T groups. The color of the dots is p value, and the redder the color, the more significant the enrichment. Differences between groups were analyzed by Student’s t-test. PS, Parathyroid hormone synthesis, secretion and action; ER, Endocrine and other factor-regulated calcium reabsorption.
Figure 5
Figure 5
The differential plasma metabolites after AFB1 exposure were correlated with the gut microbiota. (A,B) Volcano map of differential metabolites between the CON, AFB1, and A + T groups. Difference screening condition: FC ≥ 2 and FC ≤ 0.5, VIP ≥ 1. Differences between groups were analyzed by Student’s t-test. (C) Statistical table of differential metabolites. (D) Venn diagram analysis of differential metabolites in each group (FC ≥ 2 and FC ≤ 0.5, VIP ≥ 1). (E) The relative contents of core differential metabolites in the 3 groups (n = 6). Differences between groups were analyzed by One-way ANOVA. The presented values are the mean ± SEM. Differences were considered significant at (*) p < 0.05, (**) p < 0.01, and (***) p < 0.001 compared to the CON group and at (#) p < 0.05, (##) p < 0.01, and (###) p < 0.001 compared to the AFB1 group. (F) Association analysis of differential bacteria with the marker differential metabolites by Pearson correlation. The asterisks (* p < 0.05, ** p < 0.01 and *** p < 0.001) indicate statistically significant correlations. 3NMLH, 3–N–Methyl–L–Histidine; LTME4S, L–tyrosine methyl ester 4–sulfate.
Figure 6
Figure 6
TFRD improves AFB1-induced liver injury. (A) To evaluate liver performance, broilers were treated with an ingluvies injection of AFB1 or feed supplemented with TFRD. (B) Hematoxylin and eosin (HE) staining of liver tissue. Scale bar = 50 μm for 20× magnification; scale bar = 20 μm for 40× magnification. (C,D) Plasma alanine aminotransferase (ALT) and aspartate aminotransferase (AST) activity. (EH) Plasma antioxidant enzyme superoxide dismutase (SOD), glutathione peroxidase 1 (GPX1), catalase (CAT) activities, and oxidation product malondialdehyde (MDA) levels. (I) Oil Red O (ORO) staining of liver tissue (scale bar = 100 μm for ×10 magnification). (J) The lipid droplet number of the liver with oil red O staining. (K) The levels of plasma total cholesterol (TC), triglyceride (TG), high-density lipoprotein cholesterol (HDL-C), and low-density lipoprotein cholesterol (LDL-C). Differences between groups were analyzed by One-way ANOVA. The presented values are the mean ± SEM (n = 6), Differences were considered significant at (**) p < 0.01 and (***) p < 0.001 compared to the CON group and at (#) p < 0.05, (##) p < 0.01, and (###) p < 0.001 compared to the AFB1 group.
Figure 7
Figure 7
TFRD ameliorates AFB1-induced hepatic ferroptosis and abnormal lipid metabolism. (A) Lipid peroxidation promotes ferroptosis and PPARα activation. (B) The mRNA expression levels of key lipid metabolism genes (PPARα, CPT-1A, SREBP1, ACC, FAS, and ACSL1) in liver. (C) Plasma GSH and GSSG levels, the GSH/GSSG ratio, and the mRNA expression levels of key ferroptosis genes (ACSL4, GPX4, and FTH1) in liver. GSH, glutathione; GSSG, oxidized glutathione. Differences between groups were analyzed by One-way ANOVA. The presented values are the mean ± SEM (n = 6). Differences were considered significant at (*) p < 0.05, (**) p < 0.01, and (***) p < 0.001 compared to the CON group and at (#) p < 0.05, (##) p < 0.01, and (###) p < 0.001 compared to the AFB1 group. (D) Association analysis of key ferroptosis parameters and lipid metabolism genes with marker differential metabolites by Pearson correlation. The asterisks (* p < 0.05, and ** p < 0.01) indicate statistically significant correlations. 3NMLH, 3-N-Methyl-L-Histidine; LTME4S, L-tyrosine methyl ester 4-sulfate.
Figure 8
Figure 8
TFRD mitigates AFB1–induced liver toxicity in chickens via microbiota–gut–liver axis interaction mechanisms.

References

    1. Lin L., Fu P., Chen N., Gao N., Cao Q., Yue K., Xu T., Zhang C., Zhang C., Liu F., et al. Total flavonoids of Rhizoma Drynariae protect hepatocytes against aflatoxin B1-induced oxidative stress and apoptosis in broiler chickens. Ecotoxicol. Environ. Saf. 2022;230:113148. doi: 10.1016/j.ecoenv.2021.113148. - DOI - PubMed
    1. Rushing B.R., Selim M.I. Aflatoxin B1: A review on metabolism, toxicity, occurrence in food, occupational exposure, and detoxification methods. Food Chem. Toxicol. 2019;124:81–100. doi: 10.1016/j.fct.2018.11.047. - DOI - PubMed
    1. Zhao L., Feng Y., Deng J., Zhang N.Y., Zhang W.P., Liu X.L., Rajput S.A., Qi D.S., Sun L.H. Selenium deficiency aggravates aflatoxin B1-induced immunotoxicity in chick spleen by regulating 6 selenoprotein genes and redox/inflammation/apoptotic signaling. J. Nutr. 2019;149:894–901. doi: 10.1093/jn/nxz019. - DOI - PubMed
    1. Mughal M.J., Peng X., Kamboh A.A., Zhou Y., Fang J. Aflatoxin B1 induced systemic toxicity in poultry and rescue effects of selenium and zinc. Biol. Trace Elem. Res. 2017;178:292–300. doi: 10.1007/s12011-016-0923-9. - DOI - PubMed
    1. Yue K., Liu K.-L., Zhu Y.-D., Ding W.-L., Xu B.-W., Shaukat A., He Y.-F., Lin L.-X., Zhang C., Huang S.-C. Novel Insights into Total Flavonoids of Rhizoma Drynariae against Meat Quality Deterioration Caused by Dietary Aflatoxin B1 Exposure in Chickens. Antioxidants. 2022;12:83. doi: 10.3390/antiox12010083. - DOI - PMC - PubMed

LinkOut - more resources