. 2023 Apr 13;12(4):926.
doi: 10.3390/antiox12040926.

Agomelatine, a Melatonin-Derived Drug, as a New Strategy for the Treatment of Colorectal Cancer

Affiliations

Agomelatine, a Melatonin-Derived Drug, as a New Strategy for the Treatment of Colorectal Cancer

Sara Moreno-SanJuan et al. Antioxidants (Basel). .

Abstract

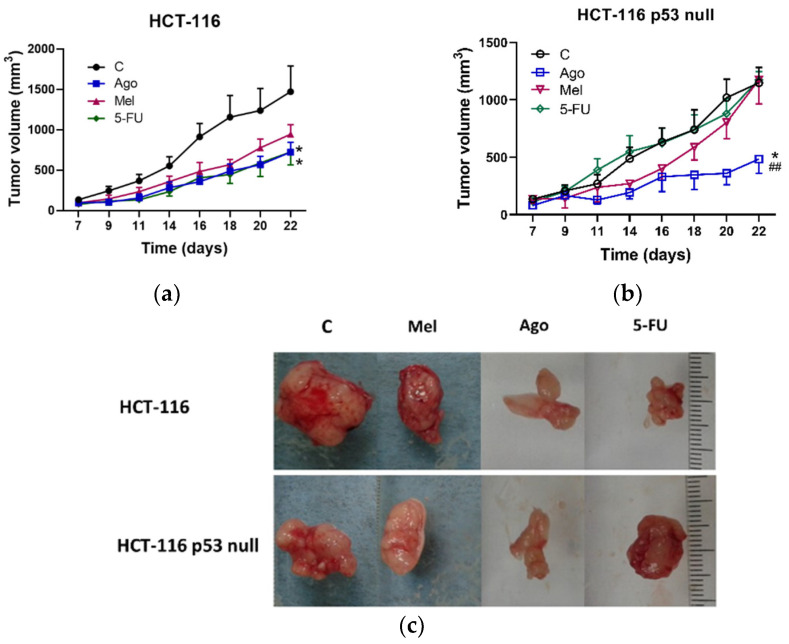
The potential use of agomelatine as an alternative treatment for colorectal cancer is evaluated in this work. The effect of agomelatine was studied in an in vitro model using two cell lines with different p53 statuses (HCT-116, wild-type p53, and HCT-116 p53 null) and an in vivo xenograft model. The inhibitory effects of agomelatine and melatonin were stronger in the cells harboring the wild-type p53, although in both cell lines, the effect of agomelatine was greater than that of the melatonin. In vivo, only agomelatine was able to reduce the volumes of tumors generated by the HCT-116-p53-null cells. Both treatments induced changes in the rhythmicity of the circadian-clock genes in vitro, albeit with some differences. Agomelatine and melatonin regulated the rhythmicity of Per1-3, Cry1, Sirt1, and Prx1 in the HCT-116 cells. In these cells, agomelatine also regulated Bmal1 and Nr1d2, while melatonin changed the rhythmicity of Clock. In the HCT-116-p53-null cells, agomelatine regulated Per1-3, Cry1, Clock, Nr1d2, Sirt1, and Prx1; however, melatonin only induced changes in Clock, Bmal1, and Sirt1. The differences found in the regulation of the clock genes may explain the greater oncostatic effect of agomelatine in CRC.

Keywords: SIRT1; agomelatine; circadian clock; colorectal cancer; melatonin; p53.


Conflict of interest statement

The authors declare no conflict of interest.

Figures

Figure 1
Figure 1
Inhibition of viability on HCT-116 and HCT-116-p53-null cells by (a) agomelatine and (b) melatonin. The results represent the mean ± SD of three experiments performed in quadruplicate. * p < 0.05 vs. C; ** p < 0.01 vs. C; *** p < 0.001 vs. C; ## p < 0.01 vs. the same concentration of agomelatine (Ago) or melatonin (Mel); # p < 0.05 vs. the same concentration of melatonin (Mel) or agomelatine (Ago). (c) Representative example of colony-formation assay and (d) graphical representation of three experiments in HCT-116 and HCT-116-p53-null cells after treatment with agomelatine (Ago) (0.5 mM) and melatonin (Mel) (1 mM) versus control (C) cells. Results are presented as means ± SD. *** Values of p < 0.001 versus C; ## p < 0.01 vs. agomelatine; ### p < 0.001 vs. agomelatine. In other experiments, (e) HTC-116 and HCT-116-p53-null cells were cultured in a 3D model and (f) the size of the spheroids was measured in control and after agomelatine (Ago) (0.5 mM) and melatonin (Mel) (1 mM) treatments during 72 h. ** Values of p < 0.01 vs. C; *** p < 0.001 vs. C; ## p < 0.01 vs. melatonin; ### p < 0.001 vs. melatonin.
Figure 2
Figure 2
Percentage distribution in the different stages of the cell-cycle after treatment of HCT-116 and HCT-116-p53-null cells with agomelatine (Ago) (a,b) and melatonin (Mel) (c,d). Data represent the mean ± SD of three experiments performed in triplicate. ** Values of p < 0.01 vs. C; *** p < 0.001 vs. C. ## p < 0.01 vs. lower doses of treatment; ### p < 0.001 vs. lower doses of treatment.
Figure 3
Figure 3
Percentage of apoptosis in HCT-116 and HCT-116-p53-null cells after agomelatine (a) and melatonin (b) treatments. Data represent the mean ± SD of three experiments performed in duplicate. * Values of p < 0.05 vs. C; ** p < 0.01 vs. C; *** p < 0.001 vs. C; ## p < 0.01 vs. HCT-116. (c) Expression of cleaved caspase-3 after treatment for 72 h with different doses of melatonin (Mel) and agomelatine (Ago) on HCT-116 and HCT-116 p53 null.
Figure 4
Figure 4
Tumor growth in the four groups of nude mice (controls and those treated with agomelatine, melatonin, or 5-FU, as described in Materials and Methods) in cell-line-derived xenografts in either (a) HCT-116 or (b) HCT-116 p53 null. Data represent mean ± SEM. * p < 0.05 vs. control mice; ## p < 0.01 vs. 5-FU group. (c) Representative images of tumors in control and treated mice in cell-line-derived xenografts. C: control; Mel: melatonin; Ago: agomelatine; 5-FU: 5-fluorouracil.
Figure 5
Figure 5
Expression levels of p53-protein in response to the treatments (a) with 0.5 mM agomelatine (Ago) and 1 mM melatonin (Mel) in the in vitro model, and (b) with agomelatine (Ago), melatonin (Mel), and 5-5-fluorouracil (FU) in tumors derived from HCT-116 and HCT-116-p53-null cell lines.
Figure 5
Figure 5
Expression levels of p53-protein in response to the treatments (a) with 0.5 mM agomelatine (Ago) and 1 mM melatonin (Mel) in the in vitro model, and (b) with agomelatine (Ago), melatonin (Mel), and 5-5-fluorouracil (FU) in tumors derived from HCT-116 and HCT-116-p53-null cell lines.
Figure 6
Figure 6
Characteristics of the rhythms obtained for Period 1 (Per1) (a,b), Period 2 (Per2) (c,d), Period 3 (Per3) (e,f), cryptocrome1 (Cry1) (g,h), circadian locomotor cycles kaput (Clock) (i,j), brain and muscle ARNT-like (Bmal1) (k,l) and nuclear receptor subfamily 1 group D member 2 (Nr1d2) (m,n) gene after agomelatine (Ago) and melatonin (Mel) treatments in the HCT-116 and HCT-116-p53-null cell lines. Curve fittings under the different conditions were performed using a 48-h test period.
Figure 6
Figure 6
Characteristics of the rhythms obtained for Period 1 (Per1) (a,b), Period 2 (Per2) (c,d), Period 3 (Per3) (e,f), cryptocrome1 (Cry1) (g,h), circadian locomotor cycles kaput (Clock) (i,j), brain and muscle ARNT-like (Bmal1) (k,l) and nuclear receptor subfamily 1 group D member 2 (Nr1d2) (m,n) gene after agomelatine (Ago) and melatonin (Mel) treatments in the HCT-116 and HCT-116-p53-null cell lines. Curve fittings under the different conditions were performed using a 48-h test period.
Figure 7
Figure 7
Characteristics of each of the rhythms obtained for sirtuin 1 (SIRT1) gene after agomelatine (Ago) and melatonin (Mel) treatments in the HCT-116 (a) and HCT-116-p53-null (b) cell lines. Curve fittings under the different conditions were performed using a 48-h test period.
Figure 8
Figure 8
Circadian rhythms obtained for peroxiredoxin 1 (PRX1) gene after agomelatine (Ago) and melatonin (Mel) treatments in the HCT-116 (a) and HCT-116-p53-null (b) cell lines. Curve fittings under the different conditions were performed using a 48-h test period.

References

    1. Bray F., Ferlay J., Soerjomataram I., Siegel R.L., Torre L.A., Jemal A. Global Cancer Statistics 2018: GLOBOCAN Estimates of Incidence and Mortality Worldwide for 36 Cancers in 185 Countries. CA A Cancer J. Clin. 2018;68:394–424. doi: 10.3322/caac.21492. - DOI - PubMed
    1. Xie Y.-H., Chen Y.-X., Fang J.-Y. Comprehensive Review of Targeted Therapy for Colorectal Cancer. Signal Transduct. Target. Ther. 2020;5:22. doi: 10.1038/s41392-020-0116-z. - DOI - PMC - PubMed
    1. Vodenkova S., Buchler T., Cervena K., Veskrnova V., Vodicka P., Vymetalkova V. 5-Fluorouracil and Other Fluoropyrimidines in Colorectal Cancer: Past, Present and Future. Pharmacol. Ther. 2020;206:107447. doi: 10.1016/j.pharmthera.2019.107447. - DOI - PubMed
    1. Robinson I., Reddy A.B. Molecular Mechanisms of the Circadian Clockwork in Mammals. FEBS Lett. 2014;588:2477–2483. doi: 10.1016/j.febslet.2014.06.005. - DOI - PubMed
    1. Tang B.L. Sirt1 and the Mitochondria. Mol. Cells. 2016;39:87–95. doi: 10.14348/molcells.2016.2318. - DOI - PMC - PubMed