. 2023 Apr 17;12(4):941.
doi: 10.3390/antiox12040941.

Inflammation and Vitamin C in Women with Prenatal Depression and Anxiety: Effect of Multinutrient Supplementation

Affiliations

Inflammation and Vitamin C in Women with Prenatal Depression and Anxiety: Effect of Multinutrient Supplementation

Anitra C Carr et al. Antioxidants (Basel). .

Abstract

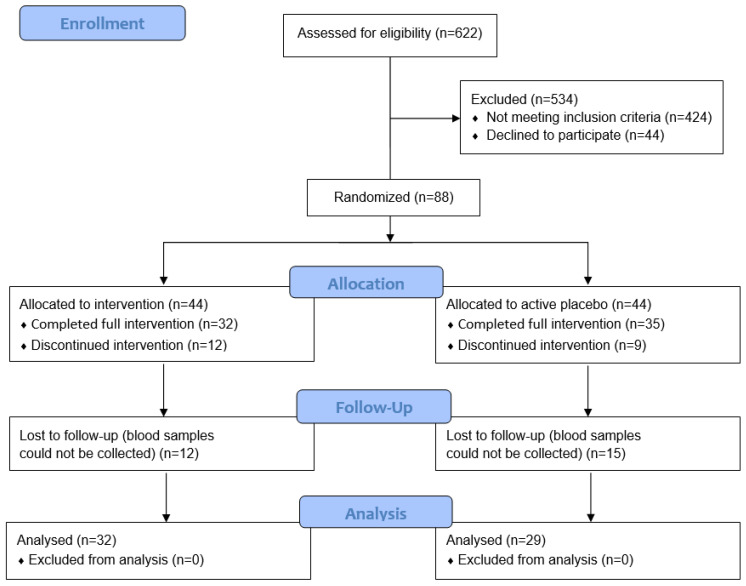
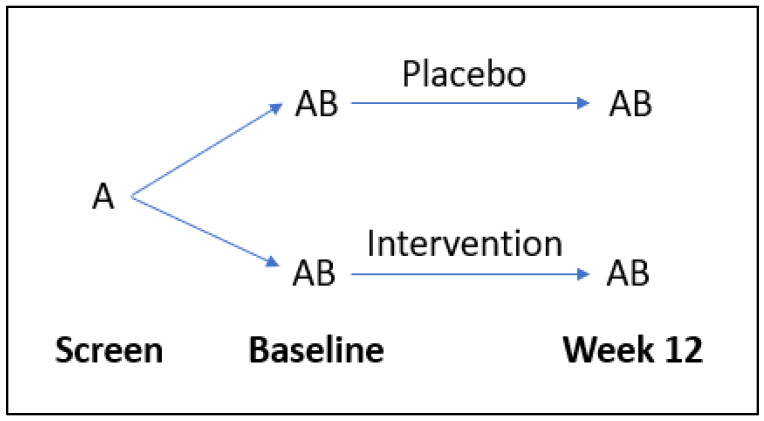
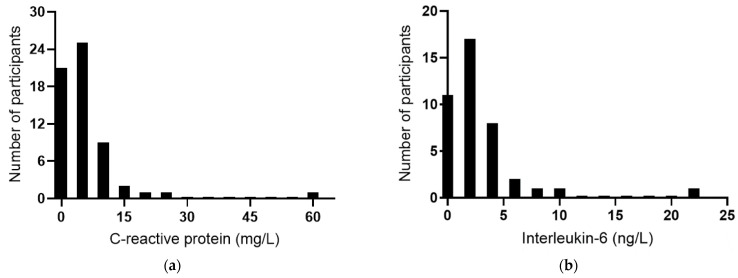
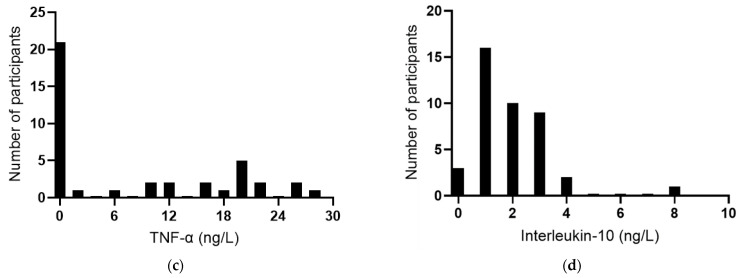
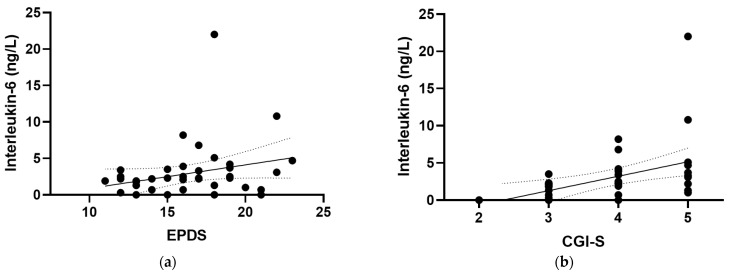
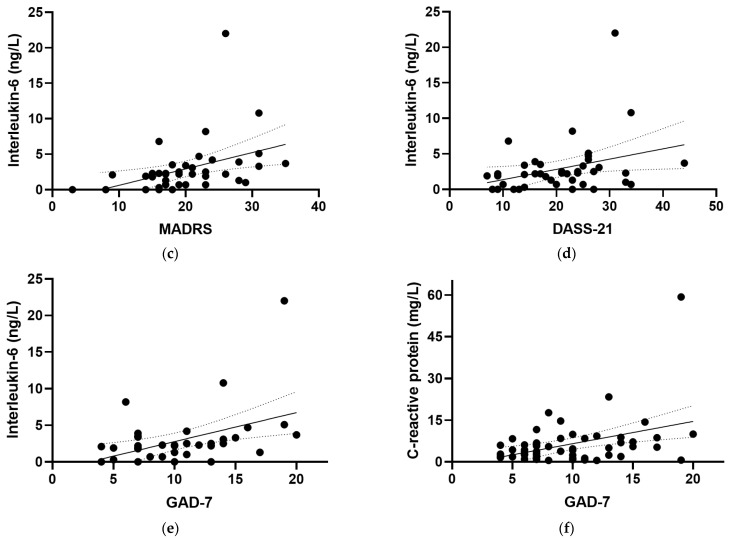
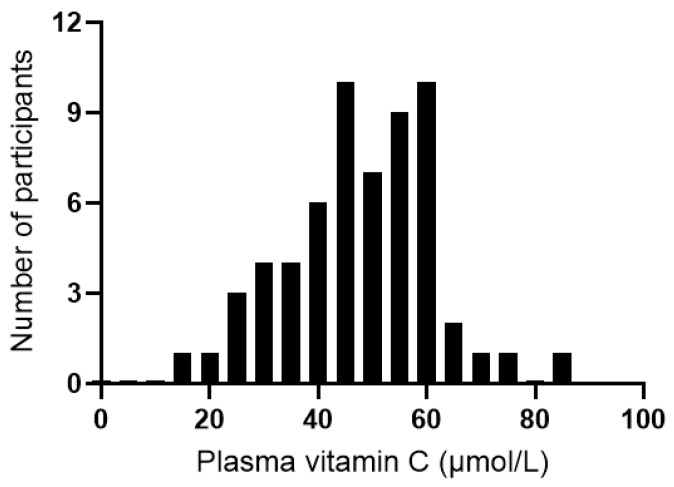
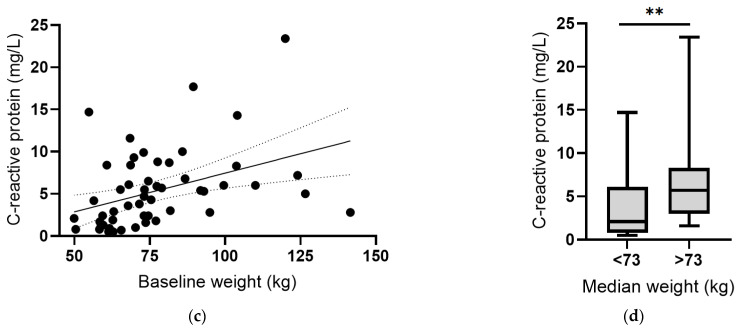
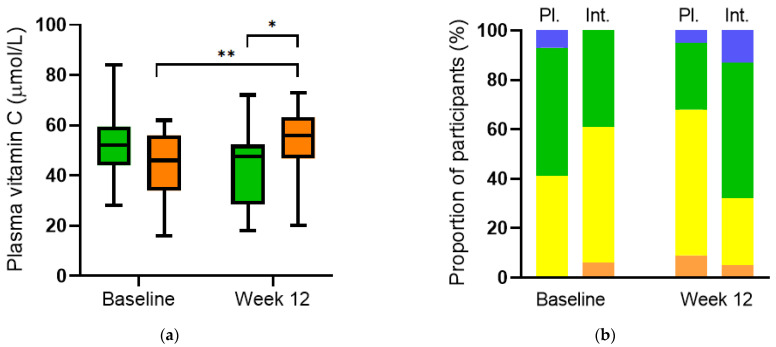
Elevated inflammation has been associated with adverse mood states, such as depression and anxiety, and antioxidant nutrients, such as vitamin C, have been associated with decreased inflammation and improved mood. In the current study comprising a cohort of pregnant women with depression and anxiety, we hypothesised that elevated inflammation would be associated with adverse mood states and inversely associated with vitamin C status and that multinutrient supplementation would optimise vitamin concentrations and attenuate inflammation. Sixty-one participants from the NUTRIMUM trial had blood samples collected between 12 and 24 weeks gestation (baseline) and following 12 weeks of daily supplementation with a multinutrient formula containing 600 mg of vitamin C or active placebo. The samples were analysed for inflammatory biomarkers (C-reactive protein (CRP) and cytokines) and vitamin C content and were related to scales of depression and anxiety. Positive correlations were observed between interleukin-6 (IL-6) and all of the mood scales administered (p < 0.05), including the Edinburgh Postnatal Depression Scale, the Clinical Global Impressions-Severity Scale, the Montgomery and Åsberg Depression Rating Scale, the Depression Anxiety Stress Scale 21, and the Generalized Anxiety Disorder-7 (GAD-7). CRP correlated weakly with GAD-7 (p = 0.05). There was an inverse correlation between CRP and the vitamin C status of the cohort (p = 0.045), although there was no association of the latter with the mood scales (p > 0.05). Supplementation with the multinutrient formula resulted in a significant increase in the vitamin C status of the cohort (p = 0.007) but did not affect the inflammatory biomarker concentrations (p > 0.05). In conclusion, greater systemic inflammation was associated with worse mood states; however, 12-week multinutrient supplementation did not alter inflammatory biomarker concentrations. Nevertheless, the vitamin C status of the cohort was improved with supplementation, which may aid pregnancy and infant outcomes.

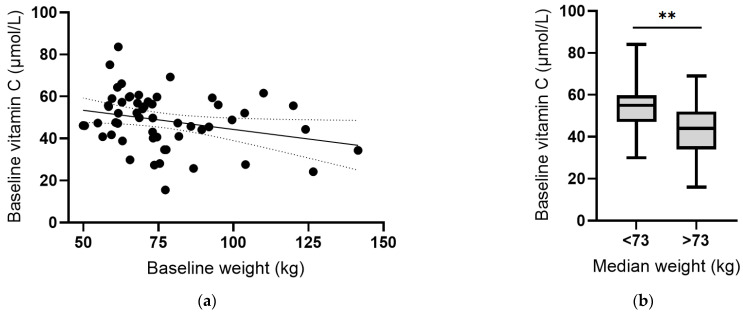
Keywords: C-reactive protein; ascorbic acid; body weight; inflammatory; interleukin-6; micronutrients; mood disorders; perinatal; tumour necrosis factor.


Conflict of interest statement

The authors declare no conflict of interest.

Figures

Figure 1
Figure 1
CONSORT flow diagram.
Figure 2
Figure 2
Flow diagram of study design. A = questionnaires, B = laboratory tests.
Figure 3
Figure 3
Baseline inflammatory biomarker status in the study cohort. Frequency distributions of: (a) C-reactive protein (n = 60), (b) interleukin-6 (n = 41), (c) tumour necrosis factor-alpha (TNF-α; n = 40), and (d) interleukin-10 (n = 41).
Figure 3
Figure 3
Baseline inflammatory biomarker status in the study cohort. Frequency distributions of: (a) C-reactive protein (n = 60), (b) interleukin-6 (n = 41), (c) tumour necrosis factor-alpha (TNF-α; n = 40), and (d) interleukin-10 (n = 41).
Figure 4
Figure 4
Correlations of inflammatory biomarkers with mood scores. Correlations of interleukin-6 with (a) the Edinburgh Postnatal Depression Scale (EPDS; r = 0.319, p = 0.04), (b) the Clinical Global Impressions—Severity Scale (CGI-S; r = 0.528, p < 0.001), (c) the Montgomery and Åsberg Depression Rating Scale (MADRS; r = 0.563, p < 0.001), (d) the Depression Anxiety Stress Scale 21 (DASS-21; r = 0.379, p = 0.015), and (e) the Generalized Anxiety Disorder-7 (GAD-7; r = 0.442, p = 0.005). (f) Correlation of C-reactive protein with GAD-7 (r = 0.260, p = 0.05). Dashed lines indicate 95% confidence intervals.
Figure 4
Figure 4
Correlations of inflammatory biomarkers with mood scores. Correlations of interleukin-6 with (a) the Edinburgh Postnatal Depression Scale (EPDS; r = 0.319, p = 0.04), (b) the Clinical Global Impressions—Severity Scale (CGI-S; r = 0.528, p < 0.001), (c) the Montgomery and Åsberg Depression Rating Scale (MADRS; r = 0.563, p < 0.001), (d) the Depression Anxiety Stress Scale 21 (DASS-21; r = 0.379, p = 0.015), and (e) the Generalized Anxiety Disorder-7 (GAD-7; r = 0.442, p = 0.005). (f) Correlation of C-reactive protein with GAD-7 (r = 0.260, p = 0.05). Dashed lines indicate 95% confidence intervals.
Figure 5
Figure 5
Distribution of plasma vitamin C concentrations of the study cohort at baseline (n = 60).
Figure 6
Figure 6
Vitamin C and C-reactive protein concentrations relative to body weight. (a) Inverse correlation between vitamin C status and weight (r = −0.287, p = 0.03). (b) Vitamin C status relative to median body weight (** p = 0.001). (c) Positive correlation between CRP and weight (r = 0.501, p = 0.0001). (d) CRP concentration relative to median body weight (** p = 0.004). Dashed lines indicate 95% confidence intervals. Box plots represent median with 25th and 75th percentiles as boundaries, and whiskers indicate maximum and minimum values.
Figure 6
Figure 6
Vitamin C and C-reactive protein concentrations relative to body weight. (a) Inverse correlation between vitamin C status and weight (r = −0.287, p = 0.03). (b) Vitamin C status relative to median body weight (** p = 0.001). (c) Positive correlation between CRP and weight (r = 0.501, p = 0.0001). (d) CRP concentration relative to median body weight (** p = 0.004). Dashed lines indicate 95% confidence intervals. Box plots represent median with 25th and 75th percentiles as boundaries, and whiskers indicate maximum and minimum values.
Figure 7
Figure 7
Plasma vitamin C concentrations before and after intervention. (a) Vitamin C increased over time in the intervention group (orange boxes; ** p = 0.007) and relative to placebo at week 12 (green boxes; * p = 0.01). (b) Categories of vitamin C status: hypovitaminosis C (≤23 µmol/L; orange bars), inadequate (<50 µmol/L; yellow bars), adequate (≥50 µmol/L; green bars), saturating (≥70 µmol/L; blue bars). Pl., placebo; Int., intervention.

Similar articles

Cited by

References

    1. Mathers C.D., Loncar D. Projections of global mortality and burden of disease from 2002 to 2030. PLoS Med. 2006;3:e442. doi: 10.1371/journal.pmed.0030442. - DOI - PMC - PubMed
    1. American Psychiatric Association . Diagnostic and Statistical Manual of Mental Disorders. 5th ed. American Psychiatric Association; Washington, DC, USA: 2013. DSM-5.
    1. Signal T.L., Paine S.J., Sweeney B., Muller D., Priston M., Lee K., Gander P., Huthwaite M. The prevalence of symptoms of depression and anxiety, and the level of life stress and worry in New Zealand Māori and non-Māori women in late pregnancy. Aust. N. Z. J. Psychiatry. 2017;51:168–176. doi: 10.1177/0004867415622406. - DOI - PubMed
    1. Letourneau N.L., Dennis C.L., Cosic N., Linder J. The effect of perinatal depression treatment for mothers on parenting and child development: A systematic review. Depress. Anxiety. 2017;34:928–966. doi: 10.1002/da.22687. - DOI - PubMed
    1. Osimo E.F., Pillinger T., Rodriguez I.M., Khandaker G.M., Pariante C.M., Howes O.D. Inflammatory markers in depression: A meta-analysis of mean differences and variability in 5,166 patients and 5,083 controls. Brain Behav. Immun. 2020;87:901–909. doi: 10.1016/j.bbi.2020.02.010. - DOI - PMC - PubMed