

Untargeted Lipidomic Profiling Reveals Lysophosphatidylcholine and Ceramide as Atherosclerotic Risk Factors in apolipoprotein E Knockout Mice
- PMID: 37108120
- PMCID: PMC10138920
- DOI: 10.3390/ijms24086956
Untargeted Lipidomic Profiling Reveals Lysophosphatidylcholine and Ceramide as Atherosclerotic Risk Factors in apolipoprotein E Knockout Mice
Abstract
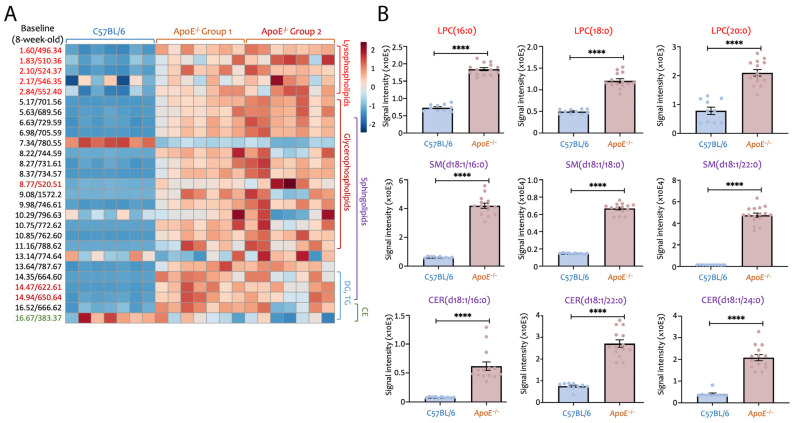
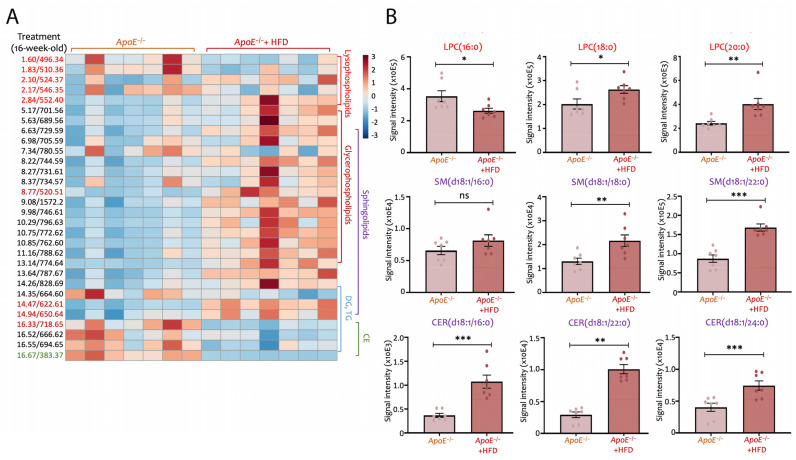
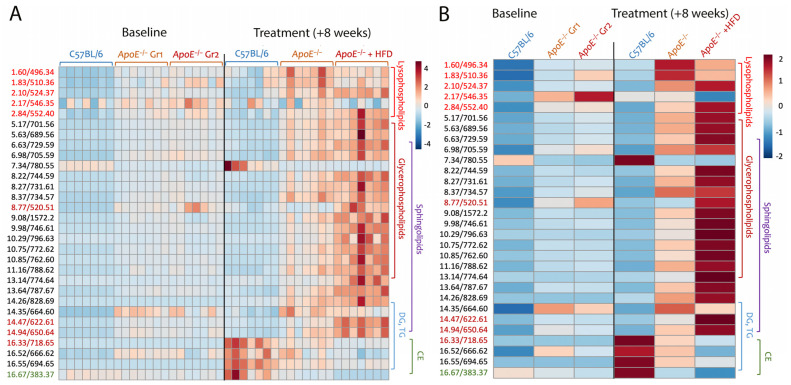
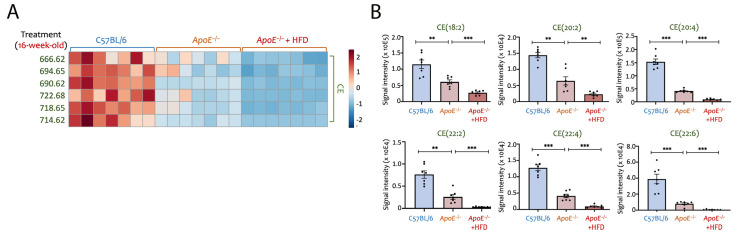
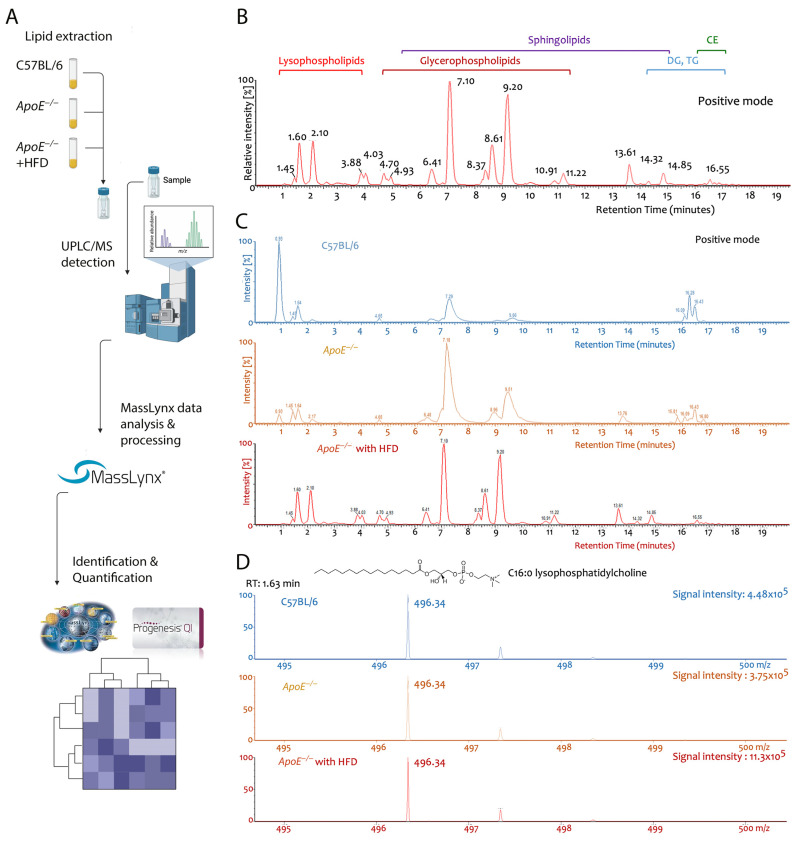
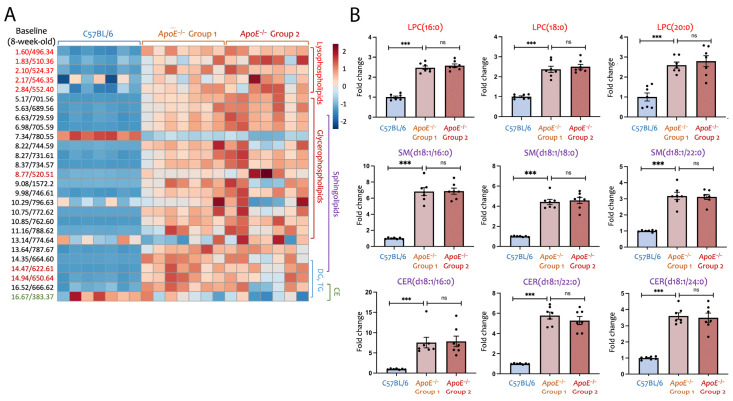
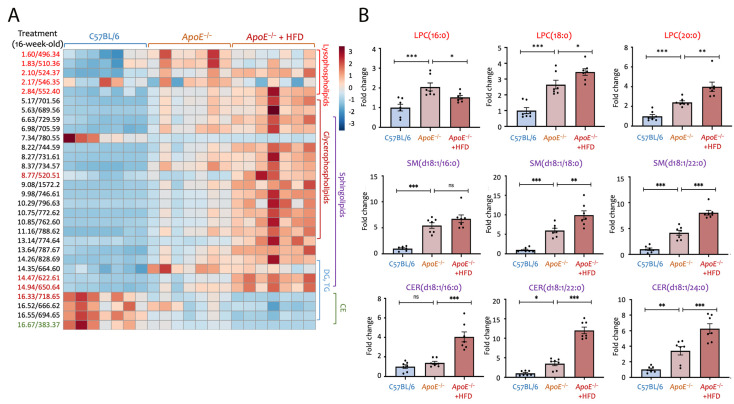
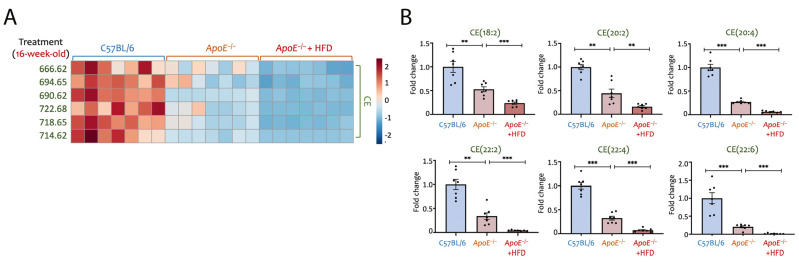
Despite the availability and use of numerous cholesterol-lowering drugs, atherosclerotic cardiovascular disease (ASCVD) remains the leading cause of mortality globally. Many researchers have focused their effort on identifying modified lipoproteins. However, lipid moieties such as lysophosphatidylcholine (LPC) and ceramide (CER) contribute to atherogenic events. LPC and CER both cause endothelial mitochondrial dysfunction, leading to fatty acid and triglyceride (TG) accumulation. In addition, they cause immune cells to differentiate into proinflammatory phenotypes. To uncover alternative therapeutic approaches other than cholesterol- and TG-lowering medications, we conducted untargeted lipidomic investigations to assess the alteration of lipid profiles in apolipoprotein E knockout (apoE-/-) mouse model, with or without feeding a high-fat diet (HFD). Results indicated that, in addition to hypercholesterolemia and hyperlipidemia, LPC levels were two to four times higher in apoE-/- mice compared to wild-type mice in C57BL/6 background, regardless of whether they were 8 or 16 weeks old. Sphingomyelin (SM) and CER were elevated three- to five-fold in apoE-/- mice both at the basal level and after 16 weeks when compared to wild-type mice. After HFD treatment, the difference in CER levels elevated more than ten-fold. Considering the atherogenic properties of LPC and CER, they may also contribute to the early onset of atherosclerosis in apoE-/- mice. In summary, the HFD-fed apoE-/- mouse shows elevated LPC and CER contents and is a suitable model for developing LPC- and CER-lowering therapies.
Keywords: apolipoprotein E (apoE) knockout; atherosclerosis; atherosclerotic cardiovascular disease (ASCVD); ceramide (CER); cholesteryl ester (CE); lipidomic; lysophosphatidylcholine (LPC); mass spectrometry; triglyceride (TG).
Conflict of interest statement
The authors declare no conflict of interest.
Figures
Similar articles
-
Plasma Lipidomics, Gut Microbiota Profile, and Phenotype of Adipose Tissue in an ApoE-/- Mouse Model of Plaque Instability.Front Biosci (Landmark Ed). 2025 Mar 21;30(3):27236. doi: 10.31083/FBL27236. Front Biosci (Landmark Ed). 2025. PMID: 40152393
-
Carboxyl ester lipase expression in macrophages increases cholesteryl ester accumulation and promotes atherosclerosis.J Biol Chem. 2005 Nov 18;280(46):38592-8. doi: 10.1074/jbc.M502266200. Epub 2005 Sep 14. J Biol Chem. 2005. PMID: 16166077
-
Ceramide ratios are affected by cigarette smoke but not heat-not-burn or e-vapor aerosols across four independent mouse studies.Life Sci. 2020 Dec 15;263:118753. doi: 10.1016/j.lfs.2020.118753. Epub 2020 Nov 12. Life Sci. 2020. PMID: 33189821
-
Atherosclerotic dyslipidemia revealed by plasma lipidomics on ApoE-/- mice fed a high-fat diet.Atherosclerosis. 2017 Jul;262:78-86. doi: 10.1016/j.atherosclerosis.2017.05.010. Epub 2017 May 11. Atherosclerosis. 2017. PMID: 28527370
-
Beyond Cholesterol: Unraveling Residual Lipidomic Risk in Cardiovascular Health.Curr Atheroscler Rep. 2025 Mar 17;27(1):37. doi: 10.1007/s11883-025-01284-0. Curr Atheroscler Rep. 2025. PMID: 40095146 Review.
Cited by
-
Ceramides-Emerging Biomarkers of Lipotoxicity in Obesity, Diabetes, Cardiovascular Diseases, and Inflammation.Diseases. 2024 Aug 23;12(9):195. doi: 10.3390/diseases12090195. Diseases. 2024. PMID: 39329864 Free PMC article. Review.
-
ACSL1 Aggravates Thromboinflammation by LPC/LPA Metabolic Axis in Hyperlipidemia Associated Myocardial Ischemia-Reperfusion Injury.Adv Sci (Weinh). 2025 Mar;12(11):e2406359. doi: 10.1002/advs.202406359. Epub 2025 Jan 23. Adv Sci (Weinh). 2025. PMID: 39853712 Free PMC article.
-
Dysregulation of Ceramide Metabolism Is Linked to Iron Deposition and Activation of Related Pathways in the Aorta of Atherosclerotic Miniature Pigs.Antioxidants (Basel). 2023 Dec 19;13(1):4. doi: 10.3390/antiox13010004. Antioxidants (Basel). 2023. PMID: 38275624 Free PMC article.
-
Integrating machine learning and nontargeted plasma lipidomics to explore lipid characteristics of premetabolic syndrome and metabolic syndrome.Front Endocrinol (Lausanne). 2024 Mar 15;15:1335269. doi: 10.3389/fendo.2024.1335269. eCollection 2024. Front Endocrinol (Lausanne). 2024. PMID: 38559697 Free PMC article.
-
Diet-Induced Severe Hyperhomocysteinemia Promotes Atherosclerosis Progression and Dysregulates the Plasma Metabolome in Apolipoprotein-E-Deficient Mice.Nutrients. 2024 Jan 23;16(3):330. doi: 10.3390/nu16030330. Nutrients. 2024. PMID: 38337615 Free PMC article.
References
-
- Goff D.C., Jr., Lloyd-Jones D.M., Bennett G., Coady S., D’Agostino R.B., Gibbons R., Greenland P., Lackland D.T., Levy D., O’Donnell C.J., et al. 2013 ACC/AHA guideline on the assessment of cardiovascular risk: A report of the American College of Cardiology/American Heart Association Task Force on Practice Guidelines. Circulation. 2014;129:S49–S73. doi: 10.1161/01.cir.0000437741.48606.98. - DOI - PubMed
-
- Stone N.J., Robinson J.G., Lichtenstein A.H., Bairey Merz C.N., Blum C.B., Eckel R.H., Goldberg A.C., Gordon D., Levy D., Lloyd-Jones D.M., et al. 2013 ACC/AHA guideline on the treatment of blood cholesterol to reduce atherosclerotic cardiovascular risk in adults: A report of the American College of Cardiology/American Heart Association Task Force on Practice Guidelines. Circulation. 2014;129:S1–S45. doi: 10.1161/01.cir.0000437738.63853.7a. - DOI - PubMed
-
- Fernandez-Friera L., Fuster V., Lopez-Melgar B., Oliva B., Garcia-Ruiz J.M., Mendiguren J., Bueno H., Pocock S., Ibanez B., Fernandez-Ortiz A., et al. Normal LDL-Cholesterol Levels Are Associated With Subclinical Atherosclerosis in the Absence of Risk Factors. J. Am. Coll. Cardiol. 2017;70:2979–2991. doi: 10.1016/j.jacc.2017.10.024. - DOI - PubMed
MeSH terms
Substances
Grants and funding
LinkOut - more resources
Full Text Sources
Medical
Miscellaneous
