. 2023 Apr 9;24(8):6971.
doi: 10.3390/ijms24086971.

ZnO Nanorods Create a Hypoxic State with Induction of HIF-1 and EPAS1, Autophagy, and Mitophagy in Cancer and Non-Cancer Cells

Affiliations

ZnO Nanorods Create a Hypoxic State with Induction of HIF-1 and EPAS1, Autophagy, and Mitophagy in Cancer and Non-Cancer Cells

Michele Aventaggiato et al. Int J Mol Sci. .

Abstract

Nanomaterials are gaining increasing attention as innovative materials in medicine. Among nanomaterials, zinc oxide (ZnO) nanostructures are particularly appealing because of their opto-electrical, antimicrobial, and photochemical properties. Although ZnO is recognized as a safe material and the Zn ion (Zn2+) concentration is strictly regulated at a cellular and systemic level, different studies have demonstrated cellular toxicity of ZnO nanoparticles (ZnO-NPs) and ZnO nanorods (ZnO-NRs). Recently, ZnO-NP toxicity has been shown to depend on the intracellular accumulation of ROS, activation of autophagy and mitophagy, as well as stabilization and accumulation of hypoxia-inducible factor-1α (HIF-1α) protein. However, if the same pathway is also activated by ZnO-NRs and how non-cancer cells respond to ZnO-NR treatment, are still unknown. To answer to these questions, we treated epithelial HaCaT and breast cancer MCF-7 cells with different ZnO-NR concentrations. Our results showed that ZnO-NR treatments increased cell death through ROS accumulation, HIF-1α and endothelial PAS domain protein 1 (EPAS1) activation, and induction of autophagy and mitophagy in both cell lines. These results, while on one side, confirmed that ZnO-NRs can be used to reduce cancer growth, on the other side, raised some concerns on the activation of a hypoxic response in normal cells that, in the long run, could induce cellular transformation.

Keywords: ZnO nanorods; autophagy; cancer; hypoxia; mitophagy; nanomaterials.


Conflict of interest statement

The authors declare no conflict of interest.

Figures

Figure 1
Figure 1
FE-SEM images of ZnO-NRs. FE-SEM images of hydrothermally grown ZnO-NRs, showing typical dimensions ranging between 40 and 50 nm in diameter, and lengths of ∼800 nm after sonication.
Figure 2
Figure 2
ZnO-NRs’ effects on HaCaT and MCF-7 cells. HaCaT and MCF-7 cells were either untreated or treated with the indicated ZnO-NR concentration for 24 and 48 h. The ncrease of ZnO-NR concentration caused a decrease (A,B) in cell viability and (C,D) clonogenicity ability. (E) Intracellular ROS measured in both cell lines after ZnO-NR treatment using 2′,7′-dichlorofluorescin diacetate (DCFH-DA). (F) Intracellular Zn2+ measured after ZnO-NR treatment using Zinquin. Experiments were repeated three times. * p < 0.05, ** p < 0.01, and *** p < 0.001. ns, not significant.
Figure 2
Figure 2
ZnO-NRs’ effects on HaCaT and MCF-7 cells. HaCaT and MCF-7 cells were either untreated or treated with the indicated ZnO-NR concentration for 24 and 48 h. The ncrease of ZnO-NR concentration caused a decrease (A,B) in cell viability and (C,D) clonogenicity ability. (E) Intracellular ROS measured in both cell lines after ZnO-NR treatment using 2′,7′-dichlorofluorescin diacetate (DCFH-DA). (F) Intracellular Zn2+ measured after ZnO-NR treatment using Zinquin. Experiments were repeated three times. * p < 0.05, ** p < 0.01, and *** p < 0.001. ns, not significant.
Figure 3
Figure 3
Ultrastructural analysis of HaCaT and MCF-7 cells after ZnO-NR treatment. HaCaT and MCF-7 cells were either untreated or treated with the indicated ZnO-NR concentration for 24 h. (A) TEM images of untreated HaCaT cells showing normal cellular morphology. Size bars, 1 µm. (B) TEM images of HaCaT cells treated with 20 µg/mL ZnO-NRs showing the extracellular presence and plasma membrane deposition of ZnO-NRs. Arrows point to autophagic vacuoles. Size bars, 1 µm for the upper left and right image and 2 µm for the lower left image. (C) TEM images of HaCaT cells treated with 50 µg/mL ZnO-NRs showing increasing extracellular (upper left) and intracellular ZnO-NRs accumulation (lower right) as well as presence of autophagic bodies (arrows) and damaged mitochondria with disruption/loss of the cristae (arrowhead) (lower image). Size bars, 2 µm for the upper image and 1 µm for the lower left and right images. (D) TEM image of untreated MCF-7 cells showing cancer cell morphology. Size bar, 5 µm. (E) TEM images of MCF-7 cells treated with 20 µg/mL ZnO-NRs showing presence of ZnO-NRs along the microvilli of the plasma membrane, in pinocytic vacuoles localized beneath the plasma membrane (left image), and also intracellularly (arrows in right image). Size bars, 0.5 µm (left) and 1 µm (right). (F) TEM images of MCF-7 cells treated with 50 µg/mL ZnO-NRs showing deposition along the entire surface of the plasma membrane (arrows) and in intracellular vacuoles. Size bars, 1 µm (left image) and 0.2 µm (right image). In all panels: N, nucleus; M, mitochondrion; PM, plasma membrane; G, Golgi.
Figure 4
Figure 4
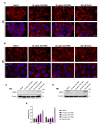
ZnO-NRs’ effects on HIF-1α expression and localization in HaCaT cells. HaCaT cells were either untreated or treated with the indicated ZnO-NR concentration for 24 and 48 h. (A) HIF-1α nuclear translocation (red fluorescence) after 24 h treatment with 20 and 50 µg/mL ZnO-NRs. Nuclei were stained with DAPI (blue fluorescence), 40× magnification. (B) HIF-1α nuclear translocation (red fluorescence) after 48 h treatment with 20 and 50 µg/mL ZnO-NRs. Nuclei were stained with DAPI (blue fluorescence), 40× magnification. (C,D) HIF-1α, hexokinase II (HKII), and carbonic anhydrase IX (CAIX) protein expression after 24 and 48 h treatment with 10, 20, and 50 µg/mL of ZnO-NRs. (EG) Densitometric analysis of HIF-1α, HKII, and CAIX protein expression after 24 and 48 h treatment with 10, 20, and 50 µg/mL ZnO-NRs. Experiments were repeated three times. * p < 0.05, ** p < 0.01, and *** p < 0.001. ns, not significant. In all experiments, hypoxia, induced by 200 µM CoCl2, was used as positive control. β-actin was used as loading control.
Figure 5
Figure 5
ZnO-NRs’ effects on HIF-1α expression and localization in MCF-7 cells. MCF-7 cells were either untreated or treated with the indicated ZnO-NR concentration for 24 and 48 h. (A) HIF-1α nuclear translocation (red fluorescence) after 24 h treatment with 20 and 50 µg/mL ZnO-NRs. Nuclei were stained with DAPI (blue fluorescence), 40× magnification. (B) HIF-1α nuclear translocation (red fluorescence) after 48 h treatment with 20 and 50 µg/mL ZnO-NRs. Nuclei were stained with DAPI (blue fluorescence), 40× magnification. (C,D) HIF-1α, HKII, and CAIX protein expression after 24 and 48 h treatment with 10, 20, and 50 µg/mL ZnO-NRs. (EG) Densitometric analysis of HIF-1α, HKII, and CAIX protein expression after 24 and 48 h treatment with 10, 20, and 50 µg/mL ZnO-NRs. Experiments were repeated three times. * p < 0.05, ** p < 0.01, and *** p < 0.001. ns, not significant. In all experiments, hypoxia, induced by 200 µM CoCl2, was used as positive control. β-actin was used as loading control.
Figure 6
Figure 6
ZnO-NRs’ effects on EPAS1 expression and localization in HaCaT cells. HaCaT cells were either untreated or treated with the indicated ZnO-NR concentration for 24 and 48 h. (A) EPAS1 nuclear translocation (red fluorescence) after 24 h treatment with 20 and 50 µg/mL ZnO-NRs. Nuclei were stained with DAPI (blue fluorescence), 40× magnification. (B) EPAS1 nuclear translocation (red fluorescence) after 48 h treatment with 20 and 50 µg/mL ZnO-NRs. Nuclei were stained with DAPI (blue fluorescence), 40× magnification. (C,D) EPAS1 protein expression after 24 and 48 h treatment with 10, 20, and 50 µg/mL ZnO-NRs. (E) Densitometric analysis of EPAS1 protein expression after 24 and 48 h treatment with 10, 20, and 50 µg/mL ZnO-NRs. Experiments were repeated three times. * p < 0.05, and *** p < 0.001. ns, not significant. In all experiments, hypoxia, induced by 200 µM CoCl2, was used as positive control. β-actin was used as loading control.
Figure 7
Figure 7
ZnO-NRs’ effects on EPAS1 expression and localization in MCF-7 cells. MCF-7 cells were either untreated or treated with the indicated ZnO-NR concentration for 24 and 48 h. (A) EPAS1 nuclear translocation (red fluorescence) after 24 h treatment with 20 and 50 µg/mL ZnO-NRs. Nuclei were stained with DAPI (blue fluorescence), 40× magnification. (B) EPAS1 nuclear translocation (red fluorescence) after 48 h treatment with 20 and 50 µg/mL ZnO-NRs. Nuclei were stained with DAPI (blue fluorescence), 40× magnification. (C,D) EPAS1 protein expression after 24 and 48 h treatment with 10, 20, and 50 µg/mL ZnO-NRs. (E) Densitometric analysis of EPAS1 protein expression after 24 and 48 h treatment with 10, 20, and 50 µg/mL ZnO-NRs. Experiments were repeated three times. ** p < 0.01, and *** p < 0.001. ns, not significant. In all experiments, hypoxia, induced by 200 µM CoCl2, was used as positive control. β-actin was used as loading control.
Figure 8
Figure 8
ZnO-NRs’ effects on autophagy and mitophagy in HaCaT cells. HaCaT cells were either untreated or treated with the indicated ZnO-NR concentration for 24 and 48 h. (A) BNIP3, LC3I, and LC3II expression after 24 h treatment with 10, 20, and 50 µg/mL ZnO-NRs. Right side, densitometric analysis of BNIP3, LC3I, and LC3II protein expression. (B) TEM images of HaCaT cells treated with 50 µg/mL ZnO-NRs for 24 h showing the presence of mitophagic vacuoles (black arrows). Size bars, 0.5 µm. (C) TEM images of HaCaT cells treated with 50 µg/mL ZnO-NRs for 24 h showing the presence of autophagic and mitophagic vacuoles (black arrows). Size bars, 0.5 µm. (D) BNIP3, LC3I, and LC3II expression after 48 h treatment with 10, 20, and 50 µg/mL ZnO-NRs. Right side, densitometric analysis of BNIP3, LC3I, and LC3II protein expression. (E,F) Poly(ADP-ribose) polymerase 1 (PARP1) and cleaved PARP expression after 24 and 48 h treatment with 10, 20, and 50 µg/mL ZnO-NRs. Densitometric analysis is reported below each blot. Experiments were repeated three times. * p < 0.05, ** p < 0.01, and *** p < 0.001. ns, not significant. In all experiments, hypoxia, induced by 200 µM CoCl2, was used as positive control. β-actin was used as loading control.
Figure 8
Figure 8
ZnO-NRs’ effects on autophagy and mitophagy in HaCaT cells. HaCaT cells were either untreated or treated with the indicated ZnO-NR concentration for 24 and 48 h. (A) BNIP3, LC3I, and LC3II expression after 24 h treatment with 10, 20, and 50 µg/mL ZnO-NRs. Right side, densitometric analysis of BNIP3, LC3I, and LC3II protein expression. (B) TEM images of HaCaT cells treated with 50 µg/mL ZnO-NRs for 24 h showing the presence of mitophagic vacuoles (black arrows). Size bars, 0.5 µm. (C) TEM images of HaCaT cells treated with 50 µg/mL ZnO-NRs for 24 h showing the presence of autophagic and mitophagic vacuoles (black arrows). Size bars, 0.5 µm. (D) BNIP3, LC3I, and LC3II expression after 48 h treatment with 10, 20, and 50 µg/mL ZnO-NRs. Right side, densitometric analysis of BNIP3, LC3I, and LC3II protein expression. (E,F) Poly(ADP-ribose) polymerase 1 (PARP1) and cleaved PARP expression after 24 and 48 h treatment with 10, 20, and 50 µg/mL ZnO-NRs. Densitometric analysis is reported below each blot. Experiments were repeated three times. * p < 0.05, ** p < 0.01, and *** p < 0.001. ns, not significant. In all experiments, hypoxia, induced by 200 µM CoCl2, was used as positive control. β-actin was used as loading control.
Figure 9
Figure 9
ZnO-NRs’ effects on autophagy and mitophagy in MCF-7 cells. MCF-7 cells were either untreated or treated with the indicated ZnO-NR concentration for 24 and 48 h. (A) BNIP3, LC3I, and LC3II expression after 24 h treatment with 10, 20, and 50 µg/mL ZnO-NRs. Right side, densitometric analysis of BNIP3 and LC3II protein expression. (B) TEM images of MCF-7 cells treated with 50 µg/mL ZnO-NRs for 24 h showing the presence of mitophagic vacuoles (black arrows). Size bars, 0.5 µm. (C) TEM image of MCF-7 cells treated with 50 µg/mL ZnO-NRs for 24 h showing the presence of autophagic vacuoles (black arrows). Size bars, 0.5 µm. (D) BNIP3, LC3I, and LC3II expression after 48 h treatment with 10, 20, and 50 µg/mL ZnO-NRs. Right side, densitometric analysis of BNIP3 and LC3II protein expression. (E,F) PARP1 and cleaved PARP expression after 24 and 48 h treatment with 10, 20, and 50 µg/mL ZnO-NRs. Densitometric analysis is reported below each blot. Experiments were repeated three times. * p < 0.05, ** p < 0.01, and *** p < 0.001. ns, not significant. In all experiments, hypoxia, induced by 200 µM CoCl2, was used as positive control. β-actin was used as loading control.
Figure 9
Figure 9
ZnO-NRs’ effects on autophagy and mitophagy in MCF-7 cells. MCF-7 cells were either untreated or treated with the indicated ZnO-NR concentration for 24 and 48 h. (A) BNIP3, LC3I, and LC3II expression after 24 h treatment with 10, 20, and 50 µg/mL ZnO-NRs. Right side, densitometric analysis of BNIP3 and LC3II protein expression. (B) TEM images of MCF-7 cells treated with 50 µg/mL ZnO-NRs for 24 h showing the presence of mitophagic vacuoles (black arrows). Size bars, 0.5 µm. (C) TEM image of MCF-7 cells treated with 50 µg/mL ZnO-NRs for 24 h showing the presence of autophagic vacuoles (black arrows). Size bars, 0.5 µm. (D) BNIP3, LC3I, and LC3II expression after 48 h treatment with 10, 20, and 50 µg/mL ZnO-NRs. Right side, densitometric analysis of BNIP3 and LC3II protein expression. (E,F) PARP1 and cleaved PARP expression after 24 and 48 h treatment with 10, 20, and 50 µg/mL ZnO-NRs. Densitometric analysis is reported below each blot. Experiments were repeated three times. * p < 0.05, ** p < 0.01, and *** p < 0.001. ns, not significant. In all experiments, hypoxia, induced by 200 µM CoCl2, was used as positive control. β-actin was used as loading control.

References

    1. Mo R., Jiang T., Gu Z. Recent progress in multidrug delivery to cancer cells by liposomes. Nanomedicine. 2014;9:1117–1120. doi: 10.2217/nnm.14.62. - DOI - PubMed
    1. Ravi S., Bajpai V. Recent advances in ZnO nanostructures and their future perspective. Adv. Nano Res. 2021;11:37–54. doi: 10.12989/anr.2021.11.1.037. - DOI
    1. Rai R.S., P G.J., Bajpai V., Khan M.I., Elboughdiri N., Shanableh A., Luque R. An eco-friendly approach on green synthesis, bio-engineering applications, and future outlook of ZnO nanomaterial: A critical review. Environ. Res. 2023;221:114807. doi: 10.1016/j.envres.2022.114807. - DOI - PubMed
    1. Król A., Pomastowski P., Rafińska K., Railean-Plugaru V., Buszewski B. Zinc oxide nanoparticles: Synthesis, antiseptic activity and toxicity mechanism. Adv. Colloid Interface Sci. 2017;249:37–52. doi: 10.1016/j.cis.2017.07.033. - DOI - PubMed
    1. Fouda A., Hassan E.-D., Salem S.S., Shaheen T.I. In-Vitro cytotoxicity, antibacterial, and UV protection properties of the biosynthesized Zinc oxide nanoparticles for medical textile applications. Microb. Pathog. 2018;125:252–261. doi: 10.1016/j.micpath.2018.09.030. - DOI - PubMed