. 2023 Apr 10;24(8):6997.
doi: 10.3390/ijms24086997.

Tumor Necrosis Factor Superfamily 14 (LIGHT) Restricts Neovascularization by Decreasing Circulating Endothelial Progenitor Cells and Function

Affiliations

Tumor Necrosis Factor Superfamily 14 (LIGHT) Restricts Neovascularization by Decreasing Circulating Endothelial Progenitor Cells and Function

Chien-Yi Hsu et al. Int J Mol Sci. .

Abstract

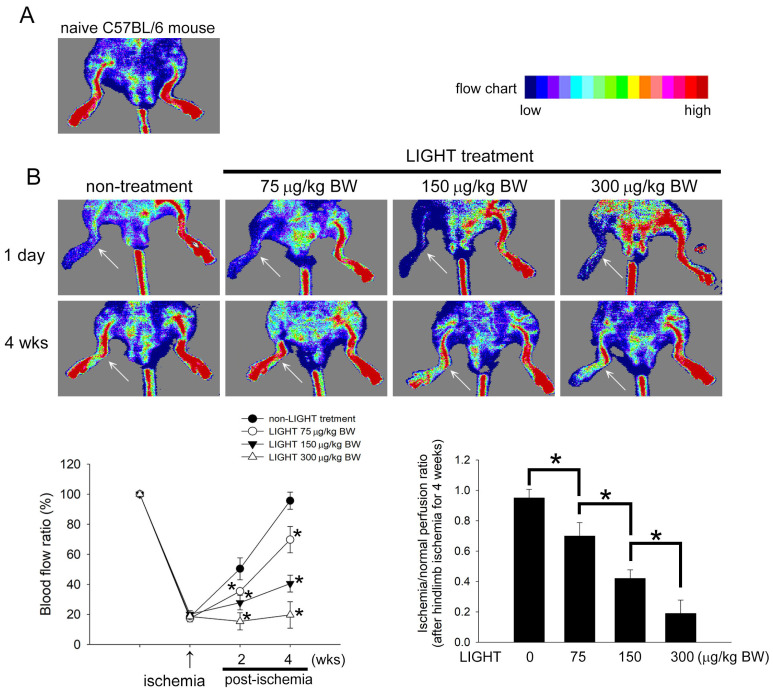
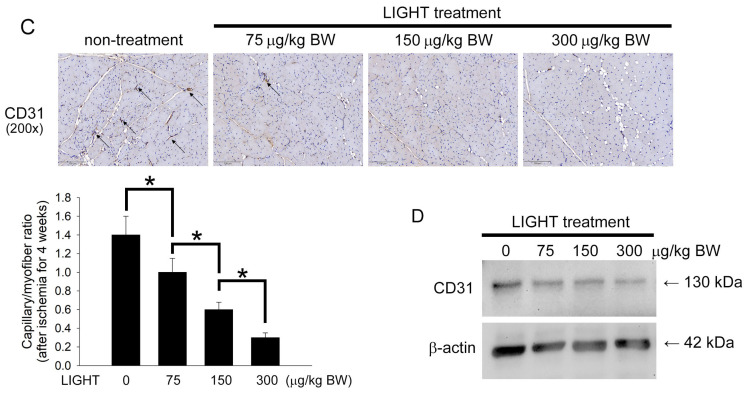
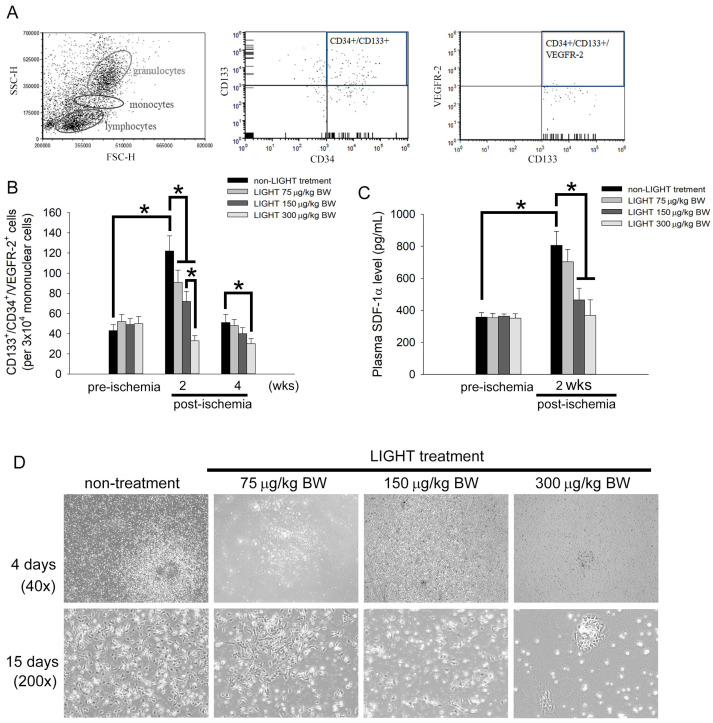
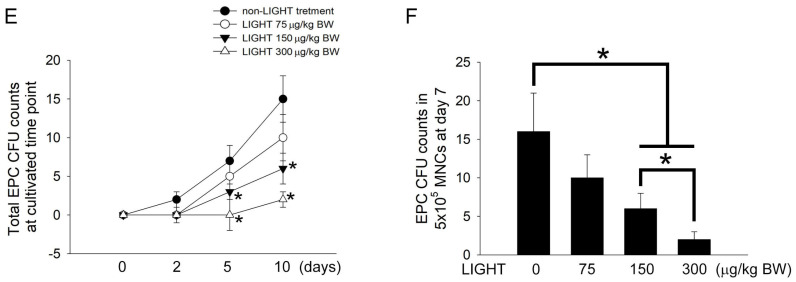
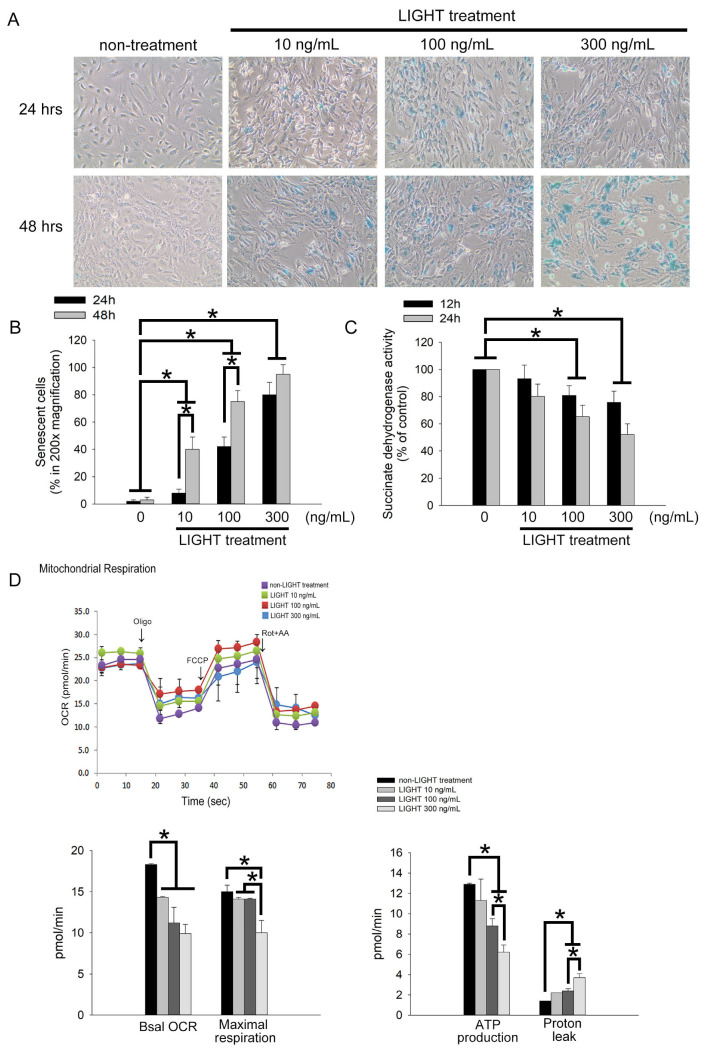
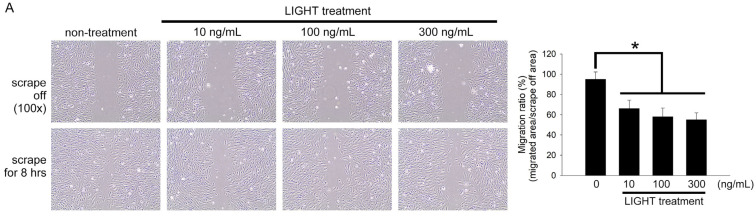
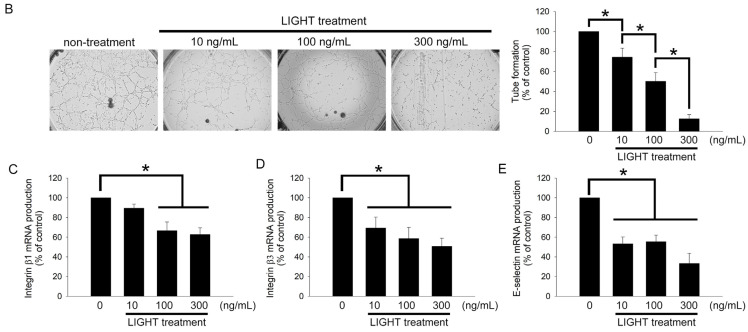
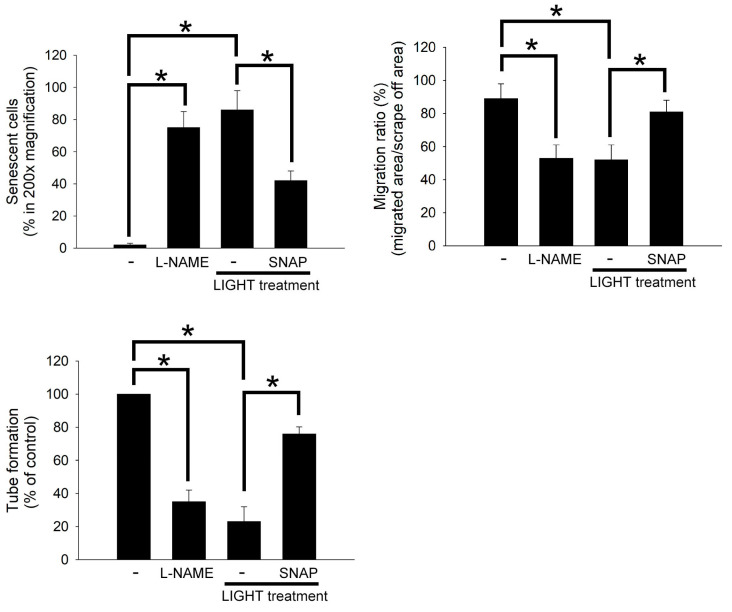
Tumor necrosis factor superfamily 14 (TNFSF14) is also known as the LT-related inducible ligand (LIGHT). It can bind to the herpesvirus invasion mediator and lymphotoxin-β receptor to perform its biological activity. LIGHT has multiple physiological functions, including strengthening the synthesis of nitric oxide, reactive oxygen species, and cytokines. LIGHT also stimulates angiogenesis in tumors and induces the synthesis of high endothelial venules; degrades the extracellular matrix in thoracic aortic dissection, and induces the expression of interleukin-8, cyclooxygenase-2, and cell adhesion molecules in endothelial cells. While LIGHT induces tissue inflammation, its effects on angiogenesis after tissue ischemia are unclear. Thus, we analyzed these effects in the current study. In this study, the animal model of hind limb ischemia surgery in C57BL/6 mice was performed. Doppler ultrasound, immunohistochemical staining, and Western blotting were employed to analyze the situation of angiogenesis. In addition, human endothelial progenitor cells (EPCs) were used for in vitro studies to analyze the possible mechanisms. The results in the animal study showed that LIGHT injection inhibited angiogenesis in ischemic limbs. For the in vitro studies, LIGHT inhibited the expression of integrins and E-selectin; decreased migration and tube formation capabilities, mitochondrial respiration, and succinate dehydrogenase activity; and promoted senescence in EPCs. Western blotting revealed that the impairment of EPC function by LIGHT may be due to its effects on the proper functioning of the intracellular Akt signaling pathway, endothelial nitrite oxide synthase (eNOS), and mitochondrial respiration. In conclusion, LIGHT inhibits angiogenesis after tissue ischemia. This may be related to the clamped EPC function.

Keywords: LIGHT; endothelial progenitor cells; tumor necrosis factor superfamily 14.


Conflict of interest statement

The authors declare no conflict of interest. The funders had no role in the design of the study or in the collection, analysis or interpretation of the data.

Figures

Figure 1
Figure 1
LIGHT decreases the recovery of capillary density in hind limb ischemia C57BL/6 mice. (A) Representative preoperative laser Doppler hind limb blood flow results in mice. (B) The upper panel shows representative lower limb blood flow results using laser Doppler measurements at 1 day and 4 weeks after hind limb ischemia surgery in mice from various groups. The color scale shows blood flow from lowest to highest values. The white arrow indicates the ischemic limb after hind limb ischemia surgery. The lower left panel shows changes in blood flow ratio (ischemia/non-ischemia) with time in various groups after surgery. Results are expressed as the mean ± standard deviation (SD). * p < 0.05 was considered statistically significant compared to the non-LIGHT treatment group at the same time point. The lower right panel presents a bar graph. The data demonstrate the significantly lower ischemia/normal perfusion ratio of the LIGHT treatment groups compared to that of the nontreatment group 4 weeks after hind limb ischemia surgery, regardless of whether 75, 150, or 300 μg/kg BW LIGHT was injected. (C) Immunohistochemical staining was performed 4 weeks after surgery to observe the vascular endothelial cell marker expressing cells in muscle tissues below the ligated blood vessel. The black arrow shows CD31 expression in the blood vessel. Tissues are presented at 200× magnification in the light microscopy image. The bar graph shows the statistical results of capillary density (capillary/myofiber ratio) for each group of animals (n = 5). Results are expressed as the mean ± SD. * p < 0.05 was considered significant. (D) Representative Western blotting results show the CD31 level in muscle tissues extracted 4 weeks after surgery in mice.
Figure 1
Figure 1
LIGHT decreases the recovery of capillary density in hind limb ischemia C57BL/6 mice. (A) Representative preoperative laser Doppler hind limb blood flow results in mice. (B) The upper panel shows representative lower limb blood flow results using laser Doppler measurements at 1 day and 4 weeks after hind limb ischemia surgery in mice from various groups. The color scale shows blood flow from lowest to highest values. The white arrow indicates the ischemic limb after hind limb ischemia surgery. The lower left panel shows changes in blood flow ratio (ischemia/non-ischemia) with time in various groups after surgery. Results are expressed as the mean ± standard deviation (SD). * p < 0.05 was considered statistically significant compared to the non-LIGHT treatment group at the same time point. The lower right panel presents a bar graph. The data demonstrate the significantly lower ischemia/normal perfusion ratio of the LIGHT treatment groups compared to that of the nontreatment group 4 weeks after hind limb ischemia surgery, regardless of whether 75, 150, or 300 μg/kg BW LIGHT was injected. (C) Immunohistochemical staining was performed 4 weeks after surgery to observe the vascular endothelial cell marker expressing cells in muscle tissues below the ligated blood vessel. The black arrow shows CD31 expression in the blood vessel. Tissues are presented at 200× magnification in the light microscopy image. The bar graph shows the statistical results of capillary density (capillary/myofiber ratio) for each group of animals (n = 5). Results are expressed as the mean ± SD. * p < 0.05 was considered significant. (D) Representative Western blotting results show the CD31 level in muscle tissues extracted 4 weeks after surgery in mice.
Figure 2
Figure 2
LIGHT inhibits the mobilization and differentiation of circulating EPCs in hind limb ischemia C57BL/6 mice. (A) Flow cytometry analysis of the levels of circulating EPCs in C57BL/6 mice. Circulating EPCs are defined as CD133+/CD34+/VEGFR-2+ cells. (B) Level of CD133+/CD34+/VEGFR-2+ cells in untreated and LIGHT-treated C57BL/6 mice before surgery and 2 and 4 weeks after surgery. (C) ELISA data of the blood SDF-1α concentration in mice before and 2 weeks after surgery. (D) At the end of the experiment (4 weeks), mice were sacrificed, and MNCs were extracted and cultured in EGM-2 culture medium. From day 2 of the culture onward, the cells were observed using microscopy once every day. Magnified images (200×) of cell cultures at days 4–15 are shown. The arrows show EPC colony formation. (E) EPC colony formation on days 2, 5, and 10 of cell cultures. The unit is colony-forming units. (F) Bar graph of the number of EPC colonies formed on day 7 of the culture (5 × 10⁵ MNCs/per well in a 6-well plate). All results are expressed as the mean ± standard deviation (n = 5). * p < 0.05 was considered significant.
Figure 2
Figure 2
LIGHT inhibits the mobilization and differentiation of circulating EPCs in hind limb ischemia C57BL/6 mice. (A) Flow cytometry analysis of the levels of circulating EPCs in C57BL/6 mice. Circulating EPCs are defined as CD133+/CD34+/VEGFR-2+ cells. (B) Level of CD133+/CD34+/VEGFR-2+ cells in untreated and LIGHT-treated C57BL/6 mice before surgery and 2 and 4 weeks after surgery. (C) ELISA data of the blood SDF-1α concentration in mice before and 2 weeks after surgery. (D) At the end of the experiment (4 weeks), mice were sacrificed, and MNCs were extracted and cultured in EGM-2 culture medium. From day 2 of the culture onward, the cells were observed using microscopy once every day. Magnified images (200×) of cell cultures at days 4–15 are shown. The arrows show EPC colony formation. (E) EPC colony formation on days 2, 5, and 10 of cell cultures. The unit is colony-forming units. (F) Bar graph of the number of EPC colonies formed on day 7 of the culture (5 × 10⁵ MNCs/per well in a 6-well plate). All results are expressed as the mean ± standard deviation (n = 5). * p < 0.05 was considered significant.
Figure 3
Figure 3
LIGHT stimulates human EPC senescence by destroying mitochondria function and succinate dehydrogenase (SDH) activity. (A) EPCs were treated with 10, 100, or 300 ng/mL recombinant LIGHT for 24 or 48 h. Cell senescence was analyzed; the photographs present representative results. Senescent EPCs display accumulated blue β-galactosidase in 100× magnification. (B) Quantification of senescent EPCs. (C) EPCs were treated with 10, 100, or 300 ng/mL recombinant LIGHT for 12 or 24 h. The intracellular activity of SDH was analyzed. (D) The Seahorse XFp platform was used to analyze the changes in the cell oxygen consumption rate (OCR) with time for different experimental groups (pmol/min). The arrows show the time when oligomycin (oligo), FCCP, or rotenone+antimycin (Rot+AA) was added. Four replicate wells were used for each time point. Basal OCR, maximal respiration, ATP production, and proton leak were calculated based on the Seahorse XFp analysis theory and software. Three independent experiments were carried out in every group, and different cell generations were used for every independent experiment. All results are expressed as the mean ± standard deviation (n = 5). * p < 0.05 was considered significant.
Figure 4
Figure 4
LIGHT reduces the migration and tube-forming capabilities in human EPCs by reducing the expression of adhesion molecules. (A) Migration assay was used to analyze the effects of LIGHT on EPC migration. The upper row shows the scratches (dotted lines). The lower row shows cell migration 8 h after scratching. Migration ratio (migrated area/scrape off area) was calculated using 100× magnification. (B) An angiogenesis assay kit was used to analyze the tube-forming capability results of EPCs. The numbers in three tubes in every group were calculated. The results are presented in the right figure. (CE) Real-time PCR was used to analyze integrin β1, integrin β3, and E-selectin mRNA expression in EPCs from the different experimental groups. All data are expressed as the mean ± standard deviation of three independent experiments. Statistical evaluations were performed using the Student’s t-test, followed by Dunnett’s test. * p < 0.05 was considered significant.
Figure 4
Figure 4
LIGHT reduces the migration and tube-forming capabilities in human EPCs by reducing the expression of adhesion molecules. (A) Migration assay was used to analyze the effects of LIGHT on EPC migration. The upper row shows the scratches (dotted lines). The lower row shows cell migration 8 h after scratching. Migration ratio (migrated area/scrape off area) was calculated using 100× magnification. (B) An angiogenesis assay kit was used to analyze the tube-forming capability results of EPCs. The numbers in three tubes in every group were calculated. The results are presented in the right figure. (CE) Real-time PCR was used to analyze integrin β1, integrin β3, and E-selectin mRNA expression in EPCs from the different experimental groups. All data are expressed as the mean ± standard deviation of three independent experiments. Statistical evaluations were performed using the Student’s t-test, followed by Dunnett’s test. * p < 0.05 was considered significant.
Figure 5
Figure 5
Senescence and dysfunction caused by LIGHT in human EPCs may be via the Akt-eNOS axis pathway. (A) LIGHT was used to stimulate human EPCs for 12 or 24 h before the total protein was extracted for Western blotting. (B) Akt inhibitor A-443654 was used to treat human EPCs for 6 h, followed by 300 ng/mL LIGHT treatment for 24 h. Total protein was extracted for Western blotting. Total-Akt and β-actin expression levels were used as control for the amount of protein loaded. (C) L-NAME (10 μM) was used to treat human EPCs for 48 h, or LIGHT was used to treat human EPCs for 48 h without or with a 1-h pretreatment with 10 μM SNAP. Data on senescence, migration, and tube formation capabilities in human EPCs are presented. The lower three figures show the senescence, migration, and tube formation quantitation results. All data are expressed as the mean ± standard deviation of three independent experiments. Statistical evaluations were performed using the Student’s t-test, followed by Dunnett’s test. * p < 0.05 was considered significant.
Figure 5
Figure 5
Senescence and dysfunction caused by LIGHT in human EPCs may be via the Akt-eNOS axis pathway. (A) LIGHT was used to stimulate human EPCs for 12 or 24 h before the total protein was extracted for Western blotting. (B) Akt inhibitor A-443654 was used to treat human EPCs for 6 h, followed by 300 ng/mL LIGHT treatment for 24 h. Total protein was extracted for Western blotting. Total-Akt and β-actin expression levels were used as control for the amount of protein loaded. (C) L-NAME (10 μM) was used to treat human EPCs for 48 h, or LIGHT was used to treat human EPCs for 48 h without or with a 1-h pretreatment with 10 μM SNAP. Data on senescence, migration, and tube formation capabilities in human EPCs are presented. The lower three figures show the senescence, migration, and tube formation quantitation results. All data are expressed as the mean ± standard deviation of three independent experiments. Statistical evaluations were performed using the Student’s t-test, followed by Dunnett’s test. * p < 0.05 was considered significant.

Similar articles

References

    1. Cannon B. Cardiovascular disease: Biochemistry to behaviour. Nature. 2013;493:S2–S3. doi: 10.1038/493S2a. - DOI - PubMed
    1. Hage F.G., Venkataraman R., Zoghbi G.J., Perry G.J., DeMattos A.M., Iskandrian A.E. The scope of coronary heart disease in patients with chronic kidney disease. J. Am. Coll. Cardiol. 2009;53:2129–2140. doi: 10.1016/j.jacc.2009.02.047. - DOI - PubMed
    1. Zhu M., Lei L., Zhu Z., Li Q., Guo D., Xu J., Chen J., Sha H., Zhang X., Yang X., et al. Excess TNF-alpha in the blood activates monocytes with the potential to directly form cholesteryl ester-laden cells. Acta Biochim. Biophys. Sin. 2015;47:899–907. doi: 10.1093/abbs/gmv092. - DOI - PubMed
    1. Dostert C., Grusdat M., Letellier E., Brenner D. The TNF Family of Ligands and Receptors: Communication Modules in the Immune System and Beyond. Physiol. Rev. 2019;99:115–160. doi: 10.1152/physrev.00045.2017. - DOI - PubMed
    1. Schneider K., Potter K.G., Ware C.F. Lymphotoxin and LIGHT signaling pathways and target genes. Immunol. Rev. 2004;202:49–66. doi: 10.1111/j.0105-2896.2004.00206.x. - DOI - PubMed

MeSH terms

Substances

LinkOut - more resources