. 2023 Apr 11;24(8):7048.
doi: 10.3390/ijms24087048.

Patients with Chronic Spinal Cord Injury and a Long Period of Evolution Exhibit an Altered Cytokine Production by CD4 and CD8 T Cell Populations

Affiliations

Patients with Chronic Spinal Cord Injury and a Long Period of Evolution Exhibit an Altered Cytokine Production by CD4 and CD8 T Cell Populations

Sergio Haro Girón et al. Int J Mol Sci. .

Abstract

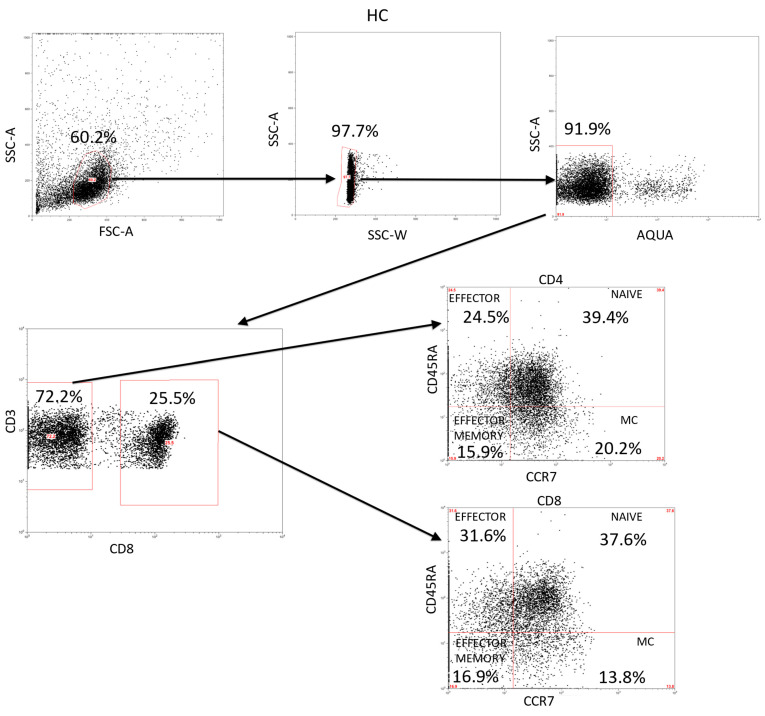
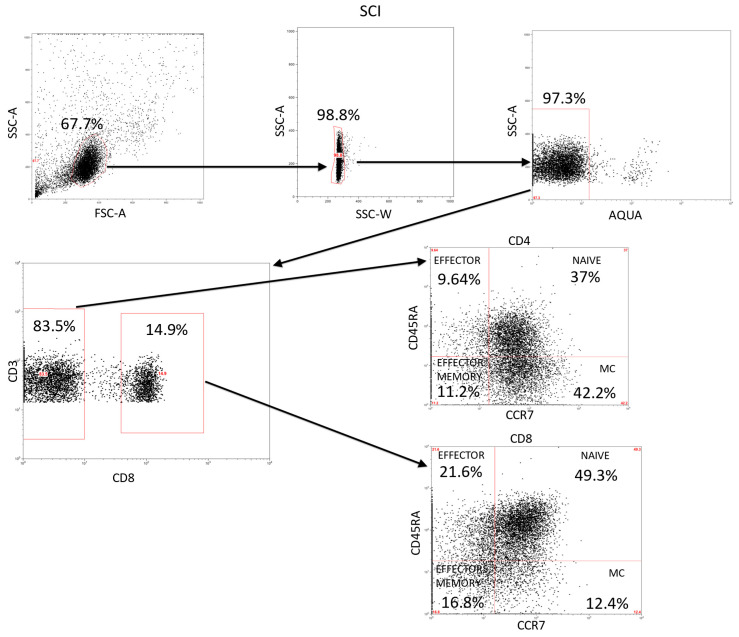
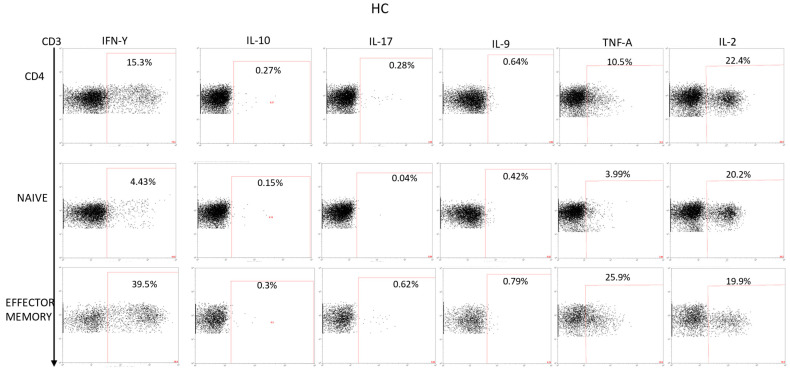
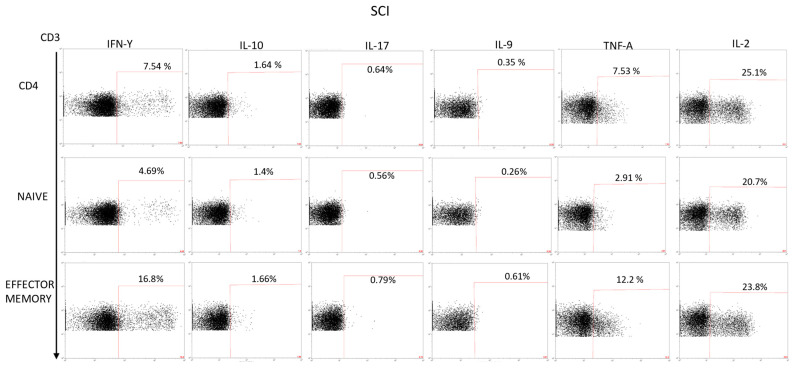
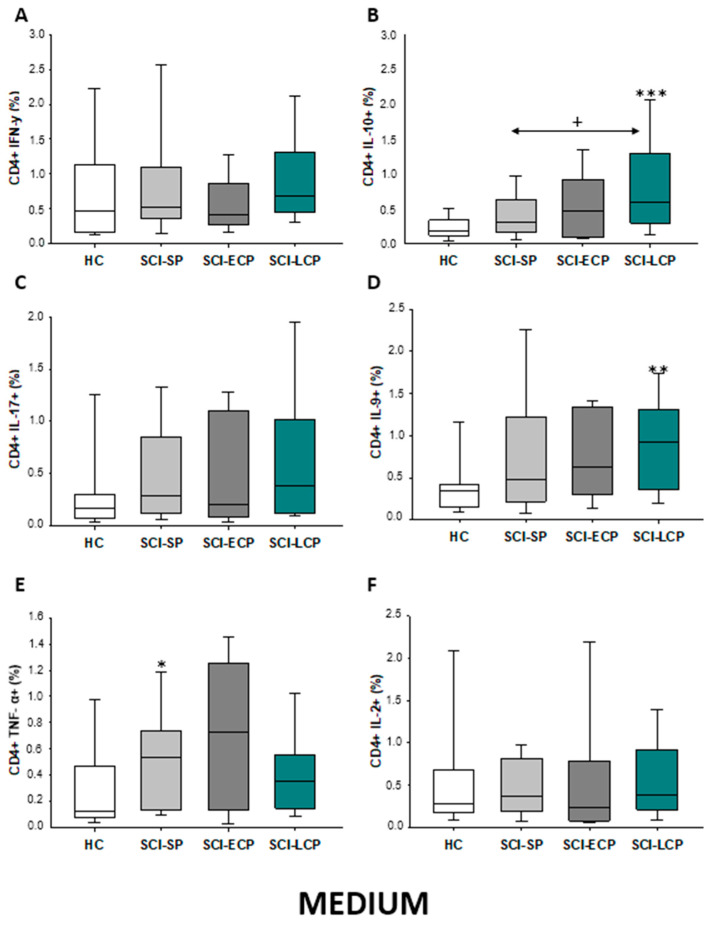
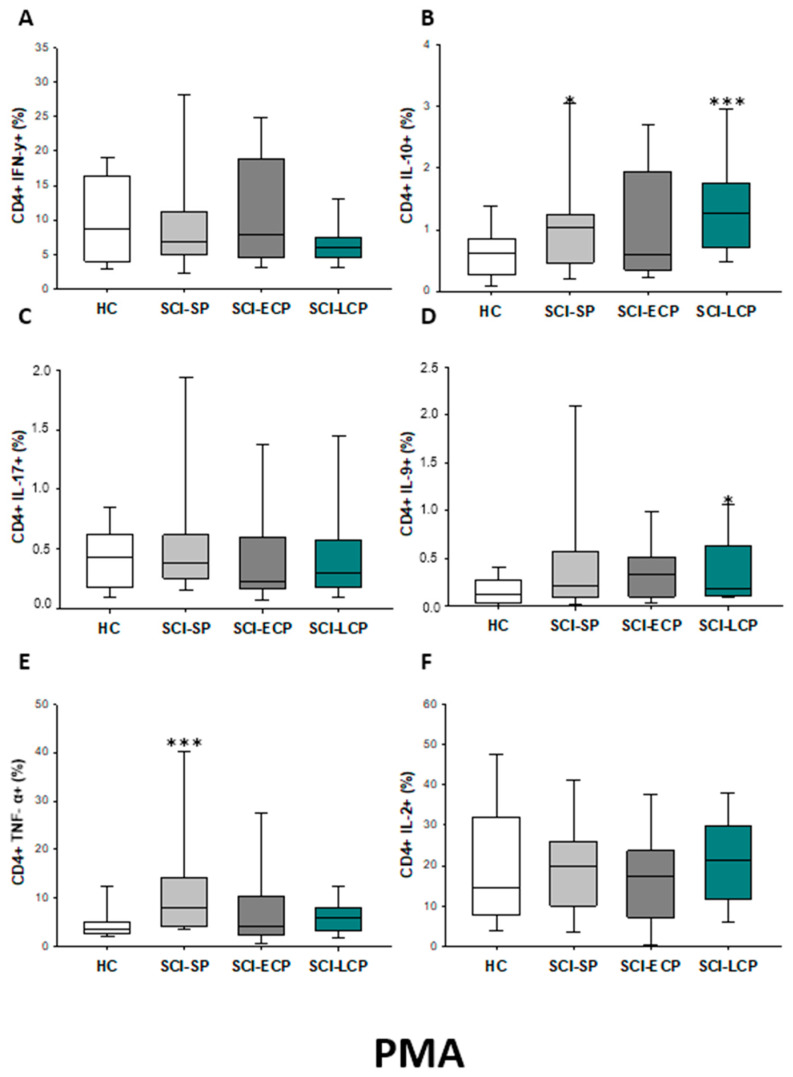
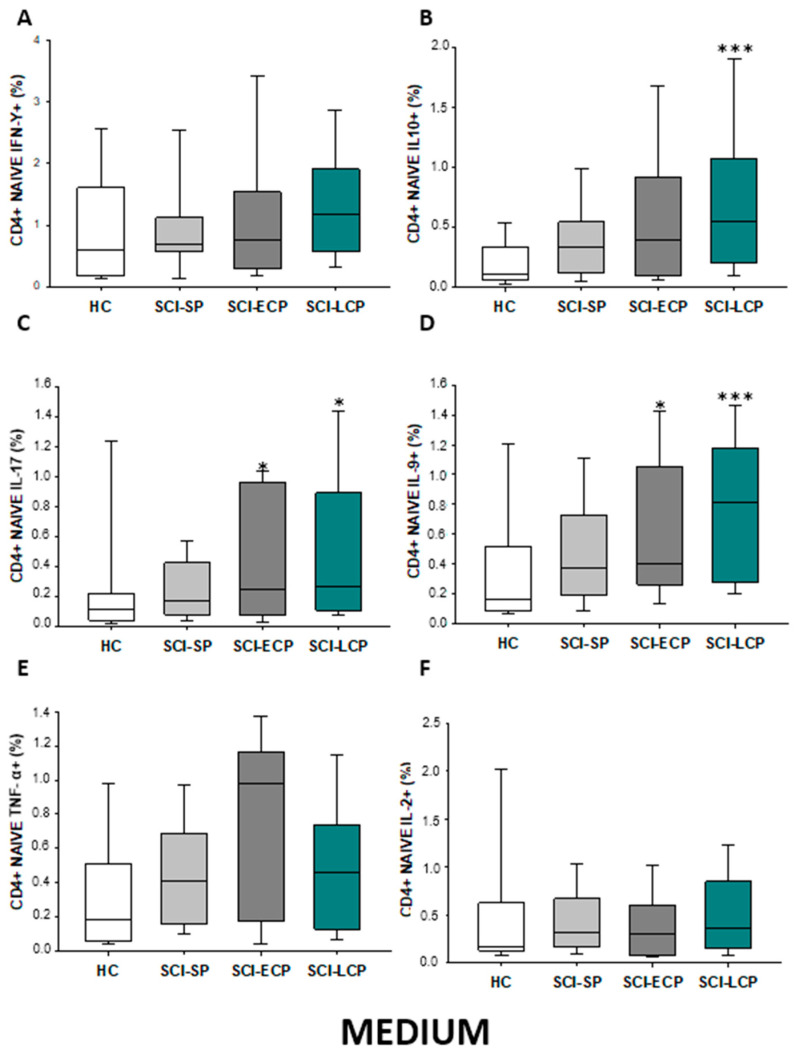
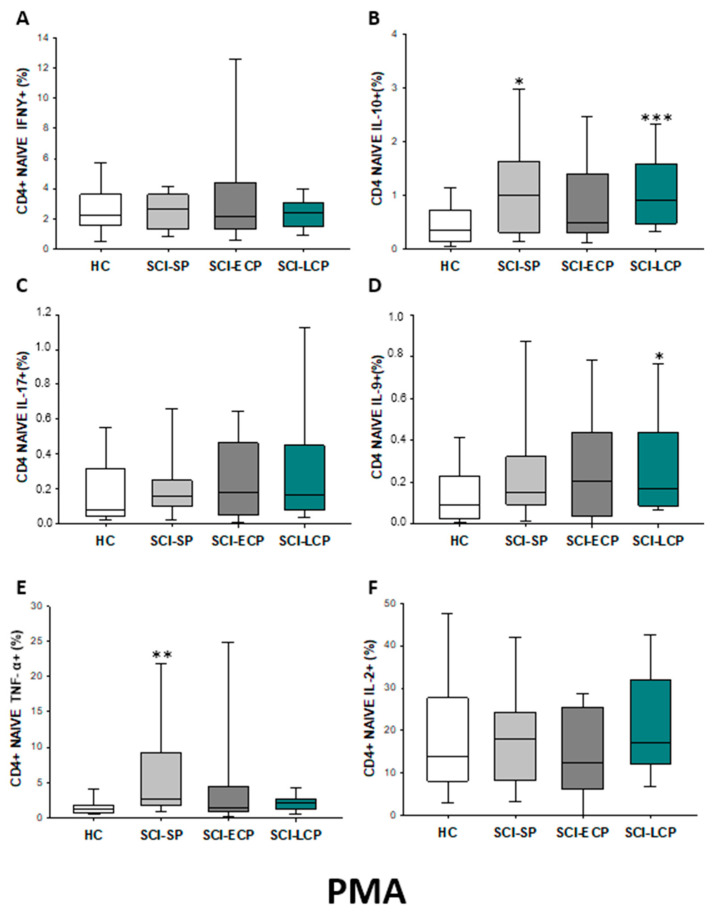
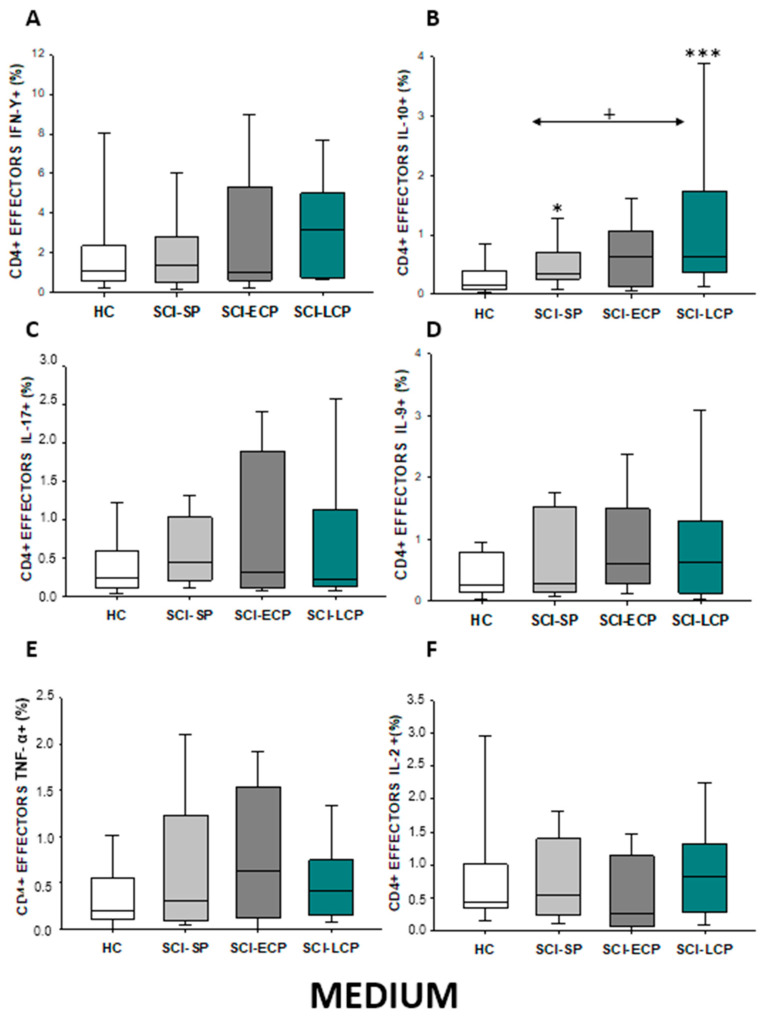
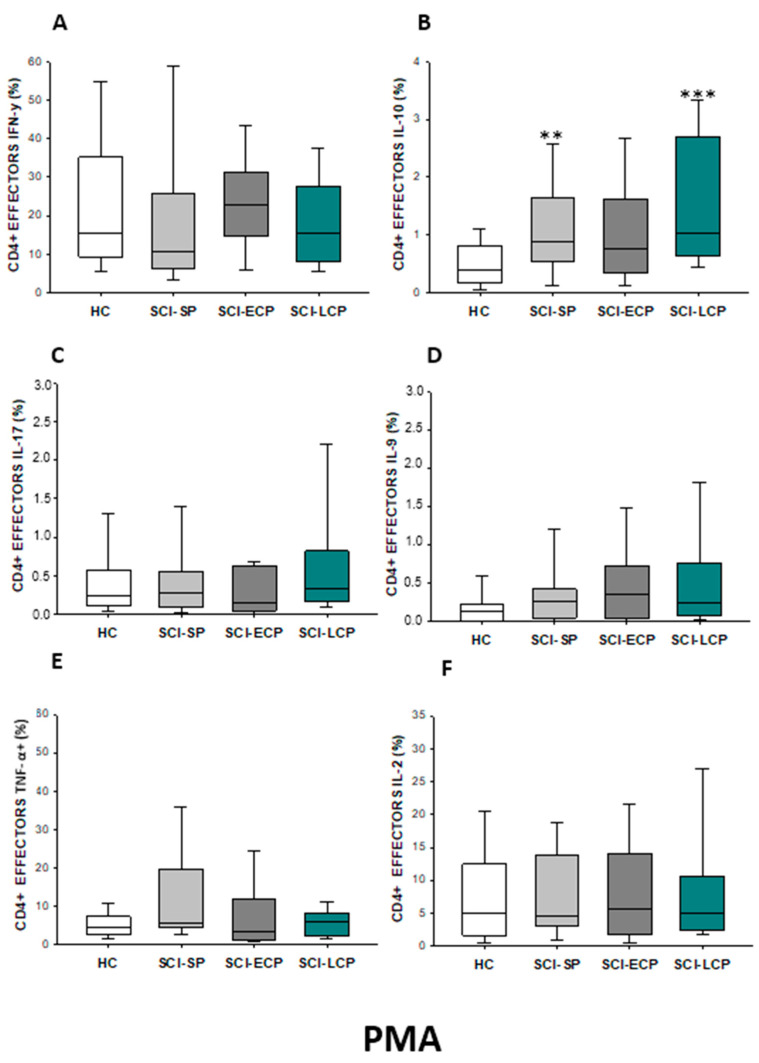
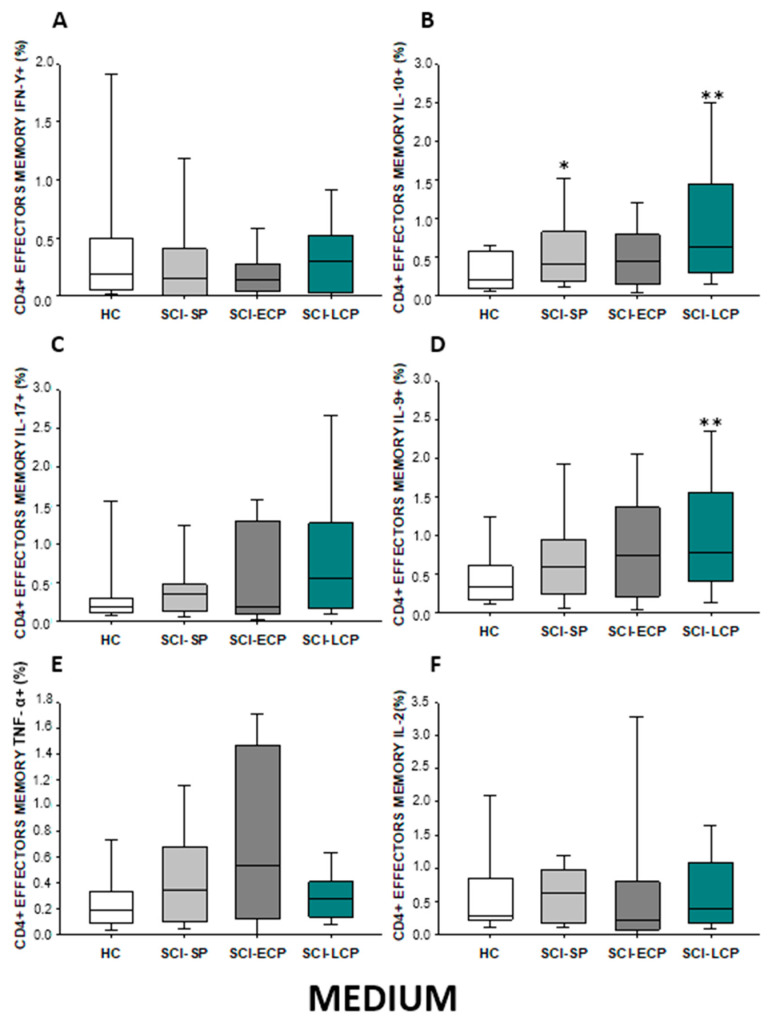
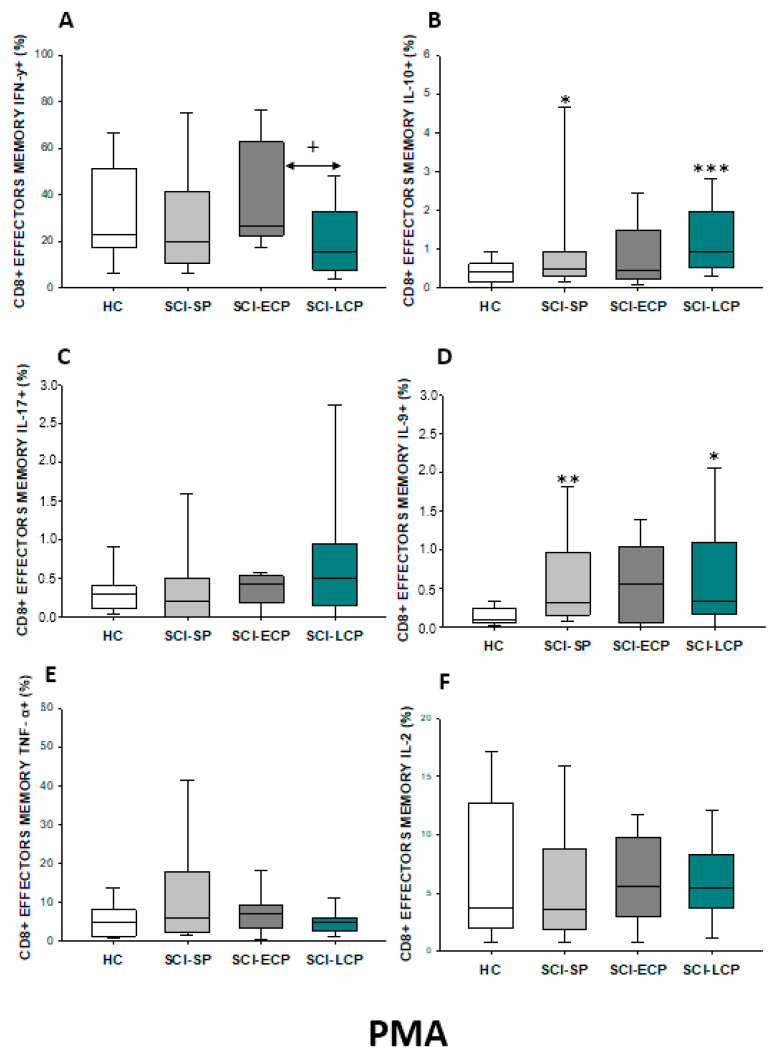
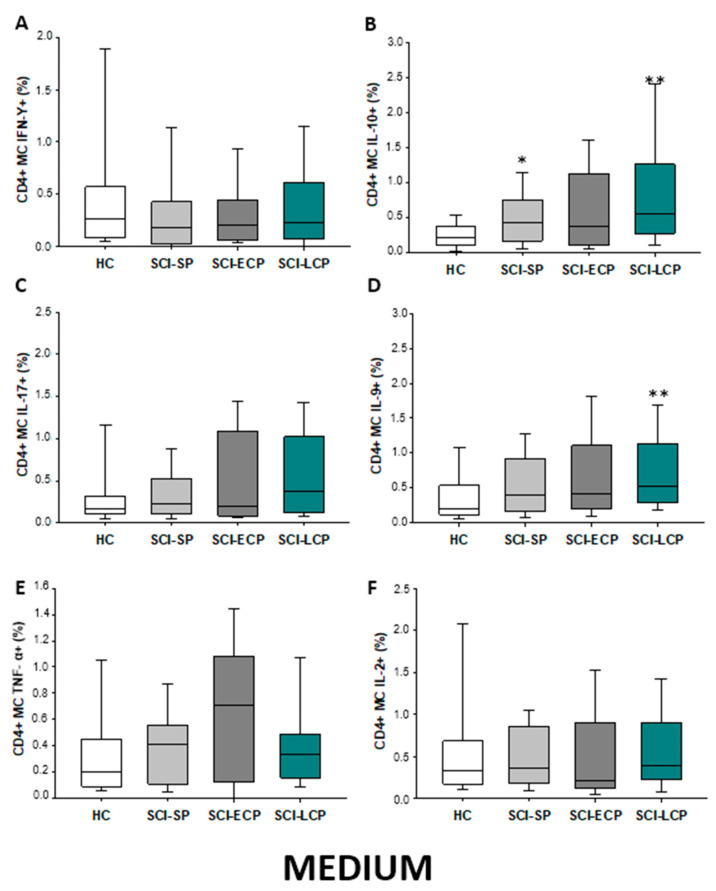
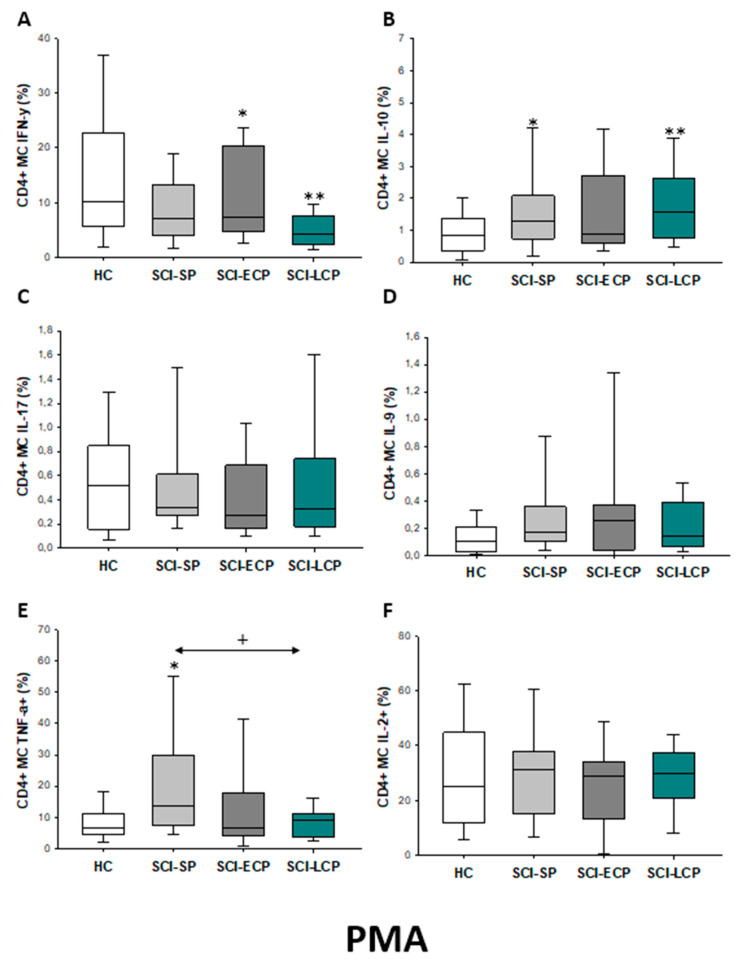
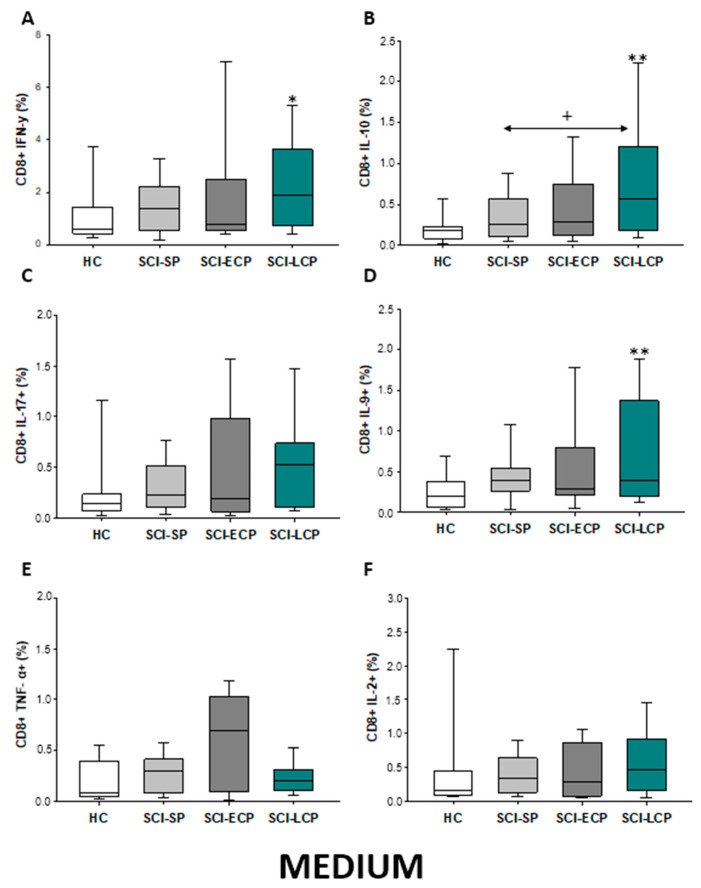
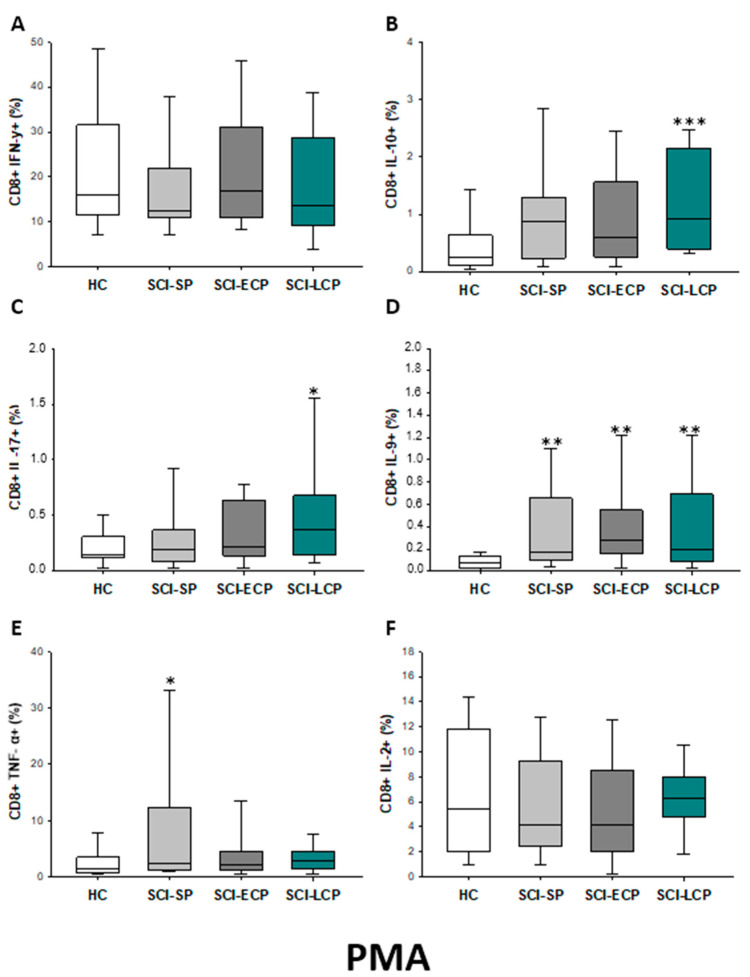
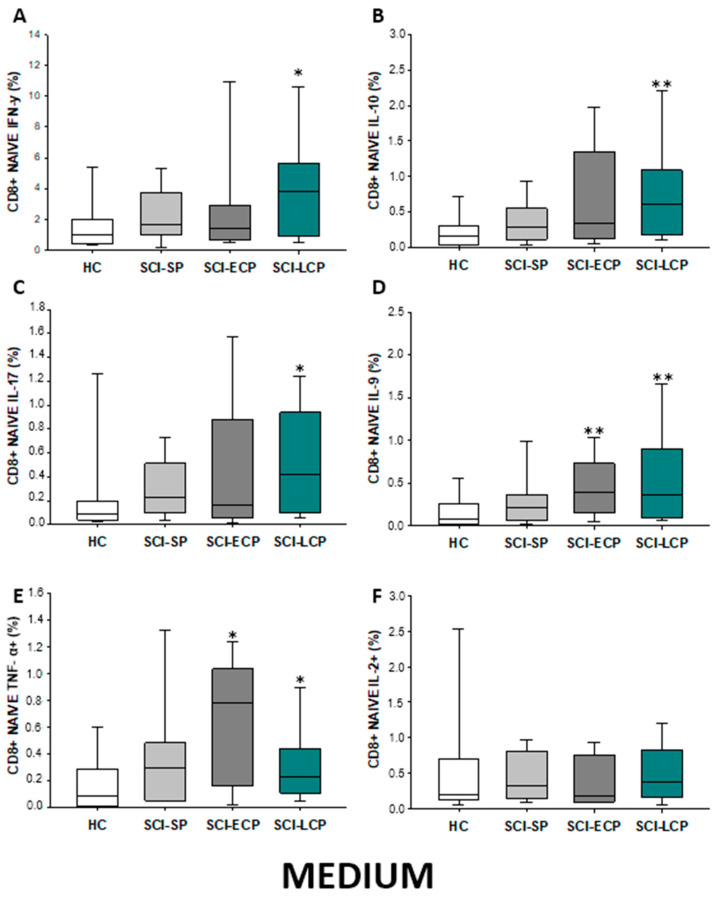
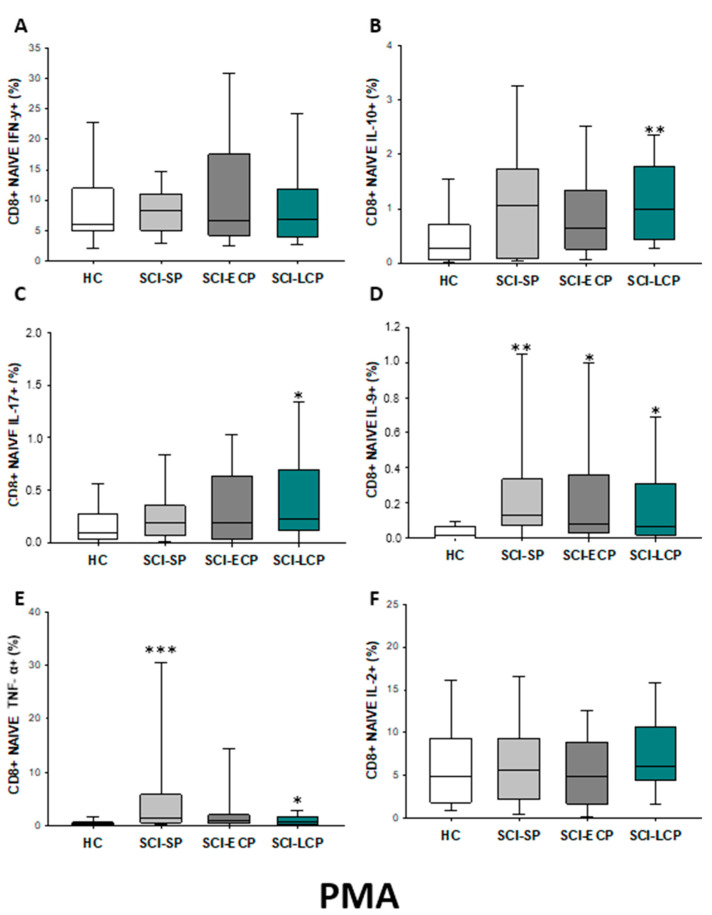
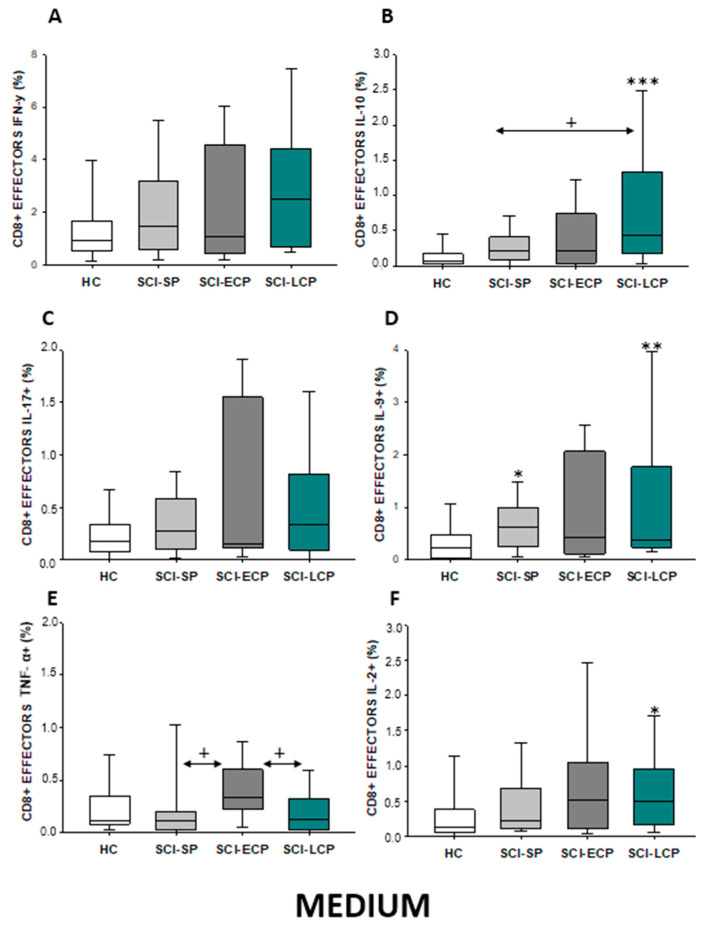
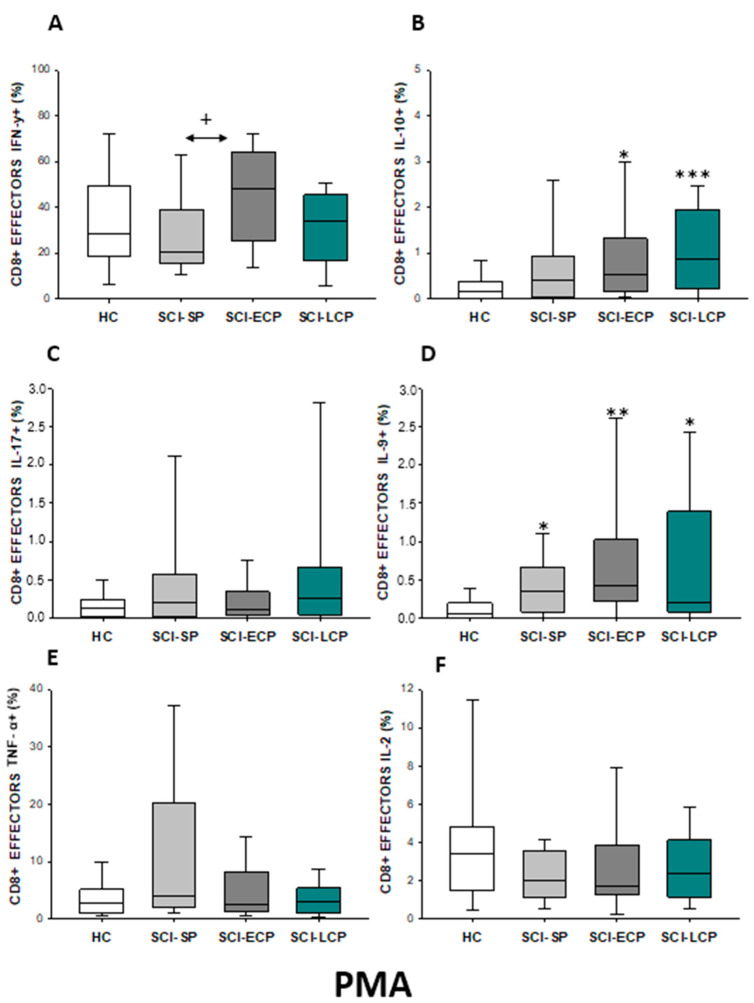
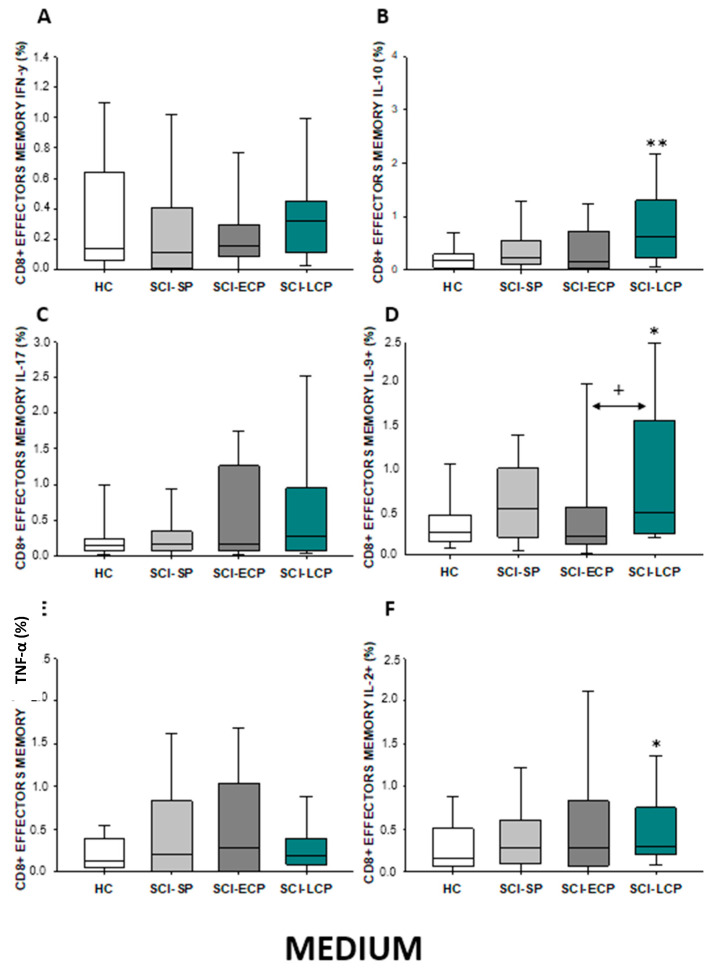
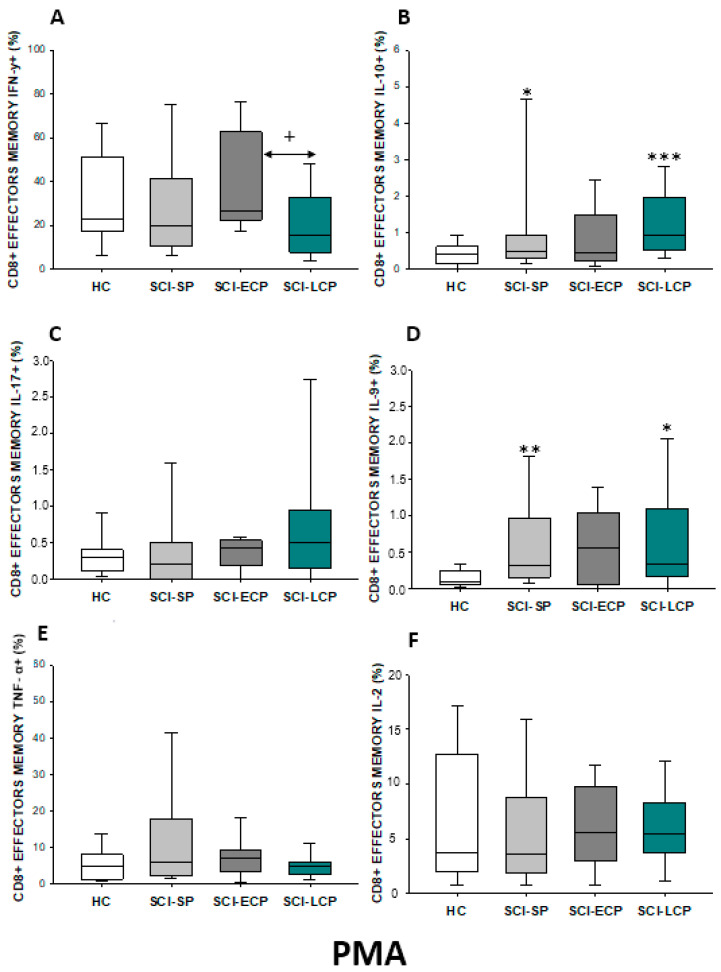
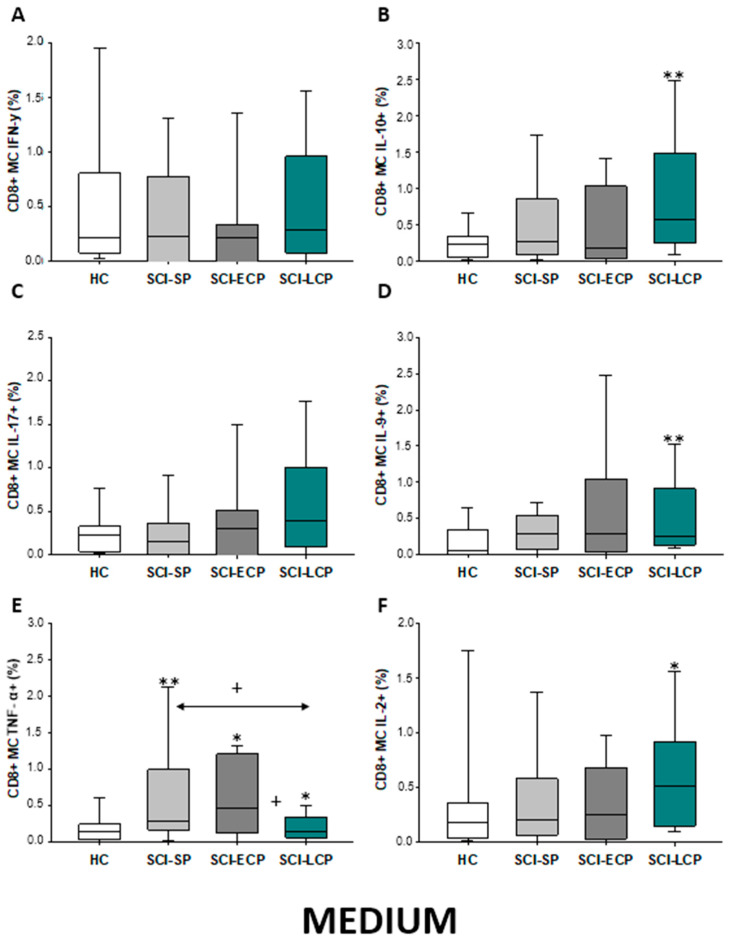
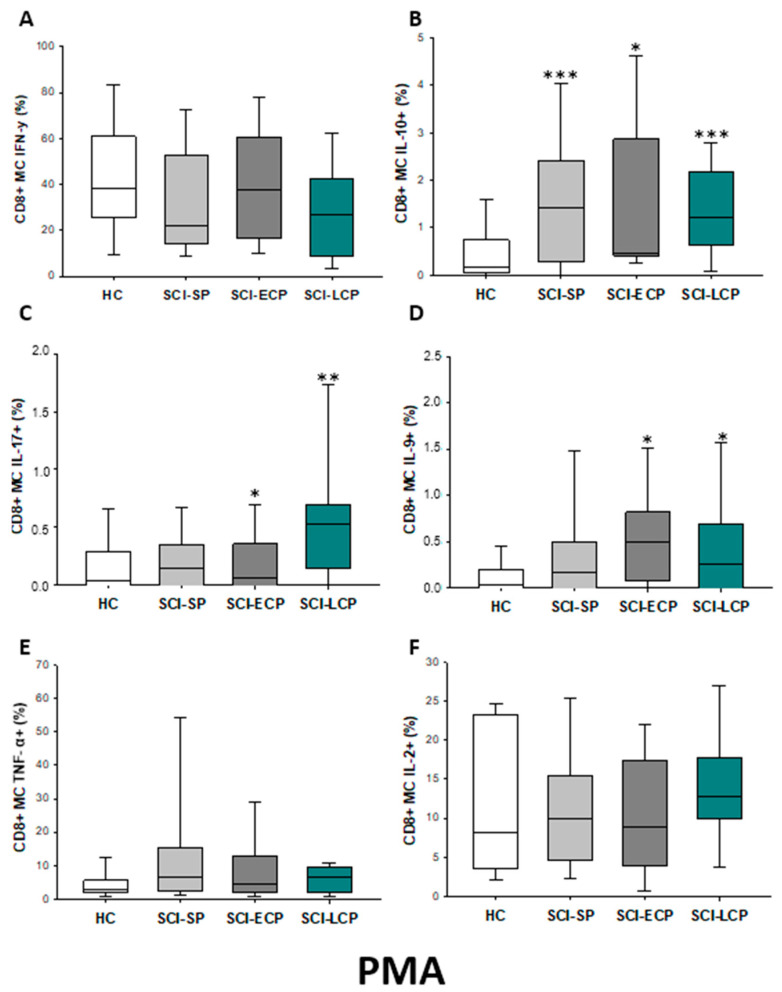
Spinal cord injury (SCI) is a disabling neurological condition coursing with serious multisystem affections and morbidities. Changes in immune cell compartments have been consistently reported in previous works, representing a critical point of study for understanding the pathophysiology and progression of SCI from acute to chronic stages. Some relevant variations in circulating T cells have been noticed in patients with chronic SCI, although the number, distribution, and function of these populations remain to be fully elucidated. Likewise, the characterization of specific T cell subpopulations and their related cytokine production can aid in understanding the immunopathological role of T cells in SCI progression. In this sense, the objective of the present study was to analyze and quantify the total number of different cytokine-producers T cells in the serum of patients with chronic SCI (n = 105) in comparison to healthy controls (n = 38) by polychromatic flow cytometry. Having this goal, we studied CD4 and CD8 lymphocytes as well as naïve, effector, and effector/central memory subpopulations. SCI patients were classified according to the duration of the lesion in chronic SCI with a short period of evolution (SCI-SP) (comprised between 1 and 5 years since initial injury), early chronic phase (SCI-ECP) (between 5 and 15 years since initial injury) and late-chronic phase (SCI-LCP) (>15 years since initial injury). Our results show that patients with chronic SCI exhibited an altered immune profile of cytokine-producer T cells, including CD4/CD8 naïve, effector, and memory subpopulations in comparison to HC. In particular, IL-10 and IL-9 production seems to be importantly altered, especially in patients with SCI-LCP, whereas changes in IL-17, TNF-α, and IFN-γ T cell populations have also been reported in this and other chronic SCI groups. In conclusion, our study demonstrates an altered profile of cytokine-producer T cells in patients with chronic SCI, with marked changes throughout the course of the disease. In more detail, we have observed significant variations in cytokine production by circulating naive, effector, and effector/central memory CD4 and CD8 T cells. Future studies should be directed to explore the possible clinical consequences of these changes or develop additional translational approaches in these groups of patients.

Keywords: T lymphocytes; chronic spinal cord injury (SCI); interleukin 10 (IL-10); interleukin 9.


Conflict of interest statement

The authors declare no conflict of interest.

Figures

Figure A1
Figure A1
Analysis of CD3+ lymphocytes and their activation/differentiation stages in HC. This is a representation of the gating strategy used for the study of the different subsets in the CD3+ lymphocytes population.
Figure A2
Figure A2
Analysis of CD3+ lymphocytes and their activation/differentiation stages in SCI. This is a representation of the global gating strategy we used for the analysis of the CD4+ and CD8+ populations and the different subsets.
Figure A3
Figure A3
Production of cytokines studied in CD4+, T naive, and T effectors memory populations in HC PBMCs stimulated with PMA + ionomycin. Dot plots represent an example of the gating strategy used to analyze the cytokines production in all the populations in the study.
Figure A4
Figure A4
Analysis of the cytokines production of PBMCs stimulated with PMA + ionomycin in the CD4+, naive, and effector memory population. This is an example of the gating strategy we used for all the populations studied in the article.
Figure 1
Figure 1
(AF) Spontaneous cytokine expression by CD4 lymphocytes from SCI patients and HC. Percentage of CD4 cells producing IFN-γ, IL-10, IL-17, IL-9, TNF-α, and IL-2 in healthy controls (HC); chronic SCI patients with short periods of evolution (<5 years) (SCI-SP); chronic SCI patients in early chronic phase (5 to 15 years) (SCI-ECP); and chronic SCI patients in late-chronic phase (>15 years) (SCI-LCP). We use ‘*’ to distinguish between chronic SCI patients and HC, whereas ‘+’ is used to compare chronic SCI patients. p < 0.05 (*/+), p < 0.01 (**), and p < 0.001 (***).
Figure 2
Figure 2
(AF) Cytokine expression by PMA stimulated CD4 lymphocytes from SCI patients and HC. Percentage of CD4 cells producing IFN-γ, IL-10, IL-17, IL-9, TNF-α, and IL-2 in healthy controls (HC) after PMA stimulation; chronic SCI patients with short periods of evolution (<5 years) (SCI-SP); chronic SCI patients in early chronic phase (5 to 15 years) (SCI-ECP); and chronic SCI patients in late-chronic phase (>15 years) (SCI-LCP). We use ‘*’ to distinguish between chronic SCI patients and HC. p < 0.05 (*) and p < 0.001 (***).
Figure 3
Figure 3
(AF) Percentage of CD4 naïve cells producing IFN-γ, IL-10, IL-17, IL-9, TNF-α, and IL-2 in healthy controls (HC); chronic SCI patients with short periods of evolution (<5 years) (SCI-SP); chronic SCI patients in early chronic phase (5 to 15 years) (SCI-ECP); and chronic SCI patients in late-chronic phase (>15 years) (SCI-LCP). We use ‘*’ to distinguish between chronic SCI patients and HC. p < 0.05 (*) and p < 0.001 (***).
Figure 4
Figure 4
(AF) Percentage of CD4 naïve cells producing IFN-γ, IL-10, IL-17, IL-9, TNF-α, and IL-2 in healthy controls (HC) after PMA stimulation; chronic SCI patients with short periods of evolution (<5 years) (SCI-SP); chronic SCI patients in early chronic phase (5 to 15 years) (SCI-ECP); and chronic SCI patients in late-chronic phase (>15 years) (SCI-LCP). We use ‘*’ to distinguish between chronic SCI patients and HC. p < 0.05 (*), p < 0.01 (**), and p < 0.001 (***).
Figure 5
Figure 5
(AF) Percentage of CD4 effector cells producing IFN-γ, IL-10, IL-17, IL-9, TNF-α, and IL-2 in healthy controls (HC); chronic SCI patients with short periods of evolution (<5 years) (SCI-SP); chronic SCI patients in early chronic phase (5 to 15 years) (SCI-ECP); and chronic SCI patients in late-chronic phase (>15 years) (SCI-LCP). We use ‘*’ to distinguish between chronic SCI patients and HC, whereas ‘+’ is used to compare chronic SCI patients. p < 0.05 (*/+) and p < 0.001 (***).
Figure 6
Figure 6
(AF) Percentage of CD4 effector cells producing IFN-γ, IL-10, IL-17, IL-9, TNF-α, and IL-2 after PMA stimulation in healthy controls (HC); chronic SCI patients with short periods of evolution (<5 years) (SCI-SP); chronic SCI patients in early chronic phase (5 to 15 years) (SCI-ECP); and chronic SCI patients in late-chronic phase (>15 years) (SCI-LCP). We use ‘*’ to distinguish between chronic SCI patients and HC. p < 0.01 (**), and p < 0.001 (***).
Figure 7
Figure 7
(AF) Percentage of CD4 effector memory cells producing IFN-γ, IL-10, IL-17, IL-9, TNF-α, and IL-2 in healthy controls (HC); chronic SCI patients with short periods of evolution (<5 years) (SCI-SP); chronic SCI patients in early chronic phase (5 to 15 years) (SCI-ECP); and chronic SCI patients in late-chronic phase (>15 years) (SCI-LCP). We use ‘*’ to distinguish between chronic SCI patients and HC. p < 0.05 (*), p < 0.01 (**).
Figure 8
Figure 8
(AF) Percentage of CD4 effector memory cells producing IFN-γ, IL-10, IL-17, IL-9, TNF-α, and IL-2 after PMA stimulation in healthy controls (HC); chronic SCI patients with short periods of evolution (<5 years) (SCI-SP); chronic SCI patients in early chronic phase (5 to 15 years) (SCI-ECP); and chronic SCI patients in late-chronic phase (>15 years) (SCI-LCP). We use ‘*’ to distinguish between chronic SCI patients and HC, whereas ‘+’ is used to compare chronic SCI patients. p < 0.05 (*/+), p < 0.01 (**), and p < 0.001 (***).
Figure 9
Figure 9
(AF) Percentage of CD4 central memory cells producing IFN-γ, IL-10, IL-17, IL-9, TNF-α, and IL-2 in healthy controls (HC); chronic SCI patients with short periods of evolution (<5 years) (SCI-SP); chronic SCI patients in early chronic phase (5 to 15 years) (SCI-ECP); and chronic SCI patients in late-chronic phase (>15 years) (SCI-LCP). We use ‘*’ to distinguish between chronic SCI patients and HC. p < 0.05 (*), p < 0.01 (**).
Figure 10
Figure 10
(AF) Percentage of CD4 central memory cells producing IFN-γ, IL-10, IL-17, IL-9, TNF-α, and IL-2 after PMA stimulation in healthy controls (HC); chronic SCI patients with short periods of evolution (<5 years) (SCI-SP); chronic SCI patients in early chronic phase (5 to 15 years) (SCI-ECP); and chronic SCI patients in late-chronic phase (>15 years) (SCI-LCP). We use ‘*’ to distinguish between chronic SCI patients and HC, whereas ‘+’ is used to compare chronic SCI patients. p < 0.05 (*/+), p < 0.01 (**).
Figure 11
Figure 11
(AF) Spontaneous cytokine expression by CD8 lymphocytes from SCI patients and HC. Percentage of CD8 cells producing IFN-γ, IL-10, IL-17, IL-9, TNF-α, and IL-2 in healthy controls (HC); chronic SCI patients with short periods of evolution (<5 years (SCI-SP); chronic SCI patients in early chronic phase (5 to 15 years) (SCI-ECP); and chronic SCI patients in late-chronic phase (>15 years) (SCI-LCP). We use ‘*’ to distinguish between chronic SCI patients and HC. p < 0.05 (*/+), p < 0.01 (**).
Figure 12
Figure 12
(AF) Percentage of CD8 cells producing IFN-γ, IL-10, IL-17, IL-9, TNF-α, and IL-2 in healthy controls (HC) after PMA stimulation; chronic SCI patients with short periods of evolution (<5 years) (SCI-SP); chronic SCI patients in early chronic phase (5 to 15 years) (SCI-ECP); and chronic SCI patients in late-chronic phase (>15 years) (SCI-LCP). We use ‘*’ to distinguish between chronic SCI patients and HC. p < 0.05 (*), p < 0.01 (**), and p < 0.001 (***).
Figure 13
Figure 13
(AF) Percentage of CD8 naïve cells producing IFN-γ, IL-10, IL-17, IL-9, TNF-α, and IL-2 in healthy controls (HC); chronic SCI patients with short periods of evolution (<5 years) (SCI-SP); chronic SCI patients in early chronic phase (5 to 15 years) (SCI-ECP); and chronic SCI patients in late-chronic phase (>15 years) (SCI-LCP). We use ‘*’ to distinguish between chronic SCI patients and HC. p < 0.05 (*), p < 0.01 (**).
Figure 14
Figure 14
(AF) Percentage of CD8 naïve cells producing IFN-γ, IL-10, IL-17, IL-9, TNF-α, and IL-2 in healthy controls (HC) after PMA stimulation; chronic SCI patients with short periods of evolution (<5 years) (SCI-SP); chronic SCI patients in early chronic phase (5 to 15 years) (SCI-ECP); and chronic SCI patients in late-chronic phase (>15 years) (SCI-LCP). We use ‘*’ to distinguish between chronic SCI patients and HC. p < 0.05 (*), p < 0.01 (**), and p < 0.001 (***).
Figure 15
Figure 15
(AF) Percentage of CD8 effector cells producing IFN-γ, IL-10, IL-17, IL-9, TNF-α, and IL-2 in healthy controls (HC); chronic SCI patients with short periods of evolution (<5 years) (SCI-SP); chronic SCI patients in early chronic phase (5 to 15 years) (SCI-ECP); and chronic SCI patients in late-chronic phase >15 years) (SCI-LCP). We use ‘*’ to distinguish between chronic SCI patients and HC, whereas ‘+’ is used to compare chronic SCI patients. p < 0.05 (*/+), p < 0.01 (**), and p < 0.001 (***).
Figure 16
Figure 16
(AF) Percentage of CD8 effector cells producing IFN-γ, IL-10, IL-17, IL-9, TNF-α, and IL-2 after PMA stimulation in healthy controls (HC); chronic SCI patients with short periods of evolution (<5 years) (SCI-SP); chronic SCI patients in early chronic phase (5 to 15 years) (SCI-ECP); and chronic SCI patients in late-chronic phase (>15 years) (SCI-LCP). We use ‘*’ to distinguish between chronic SCI patients and HC, whereas ‘+’ is used to compare chronic SCI patients. p < 0.05 (*/+), p < 0.01 (**), and p < 0.001 (***).
Figure 17
Figure 17
(AF) Percentage of CD8 effector memory cells producing IFN-γ, IL-10, IL-17, IL-9, TNF-α, and IL-2 in healthy controls (HC); chronic SCI patients with short periods of evolution (<5 years) (SCI-SP); chronic SCI patients in early chronic phase (5 to 15 years) (SCI-ECP); and chronic SCI patients in late-chronic phase (>15 years) (SCI-LCP). We use ‘*’ to distinguish between chronic SCI patients and HC, whereas ‘+’ is used to compare chronic SCI patients. p < 0.05 (*/+), p < 0.01 (**).
Figure 18
Figure 18
(AF) Percentage of CD8 effector memory cells producing IFN-γ, IL-10, IL-17, IL-9, TNF-α, and IL-2 after PMA stimulation in healthy controls (HC); chronic SCI patients with short periods of evolution (<5 years) (SCI-SP); chronic SCI patients in early chronic phase (5 to 15 years) (SCI-ECP); and chronic SCI patients in late-chronic phase (>15 years) (SCI-LCP). We use ‘*’ to distinguish between chronic SCI patients and HC, whereas ‘+’ is used to compare chronic SCI patients. p < 0.05 (*/+), p < 0.01 (**), and p < 0.001 (***).
Figure 19
Figure 19
(AF) Percentage of CD8 memory central cells producing IFN-γ, IL-10, IL-17, IL-9, TNF-α, and IL-2 in healthy controls (HC); chronic SCI patients with short periods of evolution (<5 years) (SCI-SP); chronic SCI patients in early chronic phase (5 to 15 years) (SCI-ECP) and chronic SCI patients in late-chronic phase (>15 years) (SCI-LCP). We use ‘*’ to distinguish between chronic SCI patients and HC, whereas ‘+’ is used to compare chronic SCI patients. p < 0.05 (*/+) and p < 0.01 (**).
Figure 20
Figure 20
(AF) Percentage of CD8 memory central cells producing IFN-γ, IL-10, IL-17, IL-9, TNF-α, and IL-2 after PMA stimulation in healthy controls (HC); chronic SCI patients with short periods of evolution (<5 years) (SCI-SP); chronic SCI patients in early chronic phase (5 to 15 years) (SCI-ECP); and chronic SCI patients in late-chronic phase (>15 years) (SCI-LCP). We use ‘*’ to distinguish between chronic SCI patients and HC, whereas ‘+’ is used to compare chronic SCI patients. p < 0.05 (*), p < 0.01 (**), and p < 0.001 (***).

Similar articles

Cited by

References

    1. Ali Z.S., Whitmore R.G. Surgical Intensive Care Medicine. 3rd ed. Springer; Berlin/Heidelberg, Germany: 2021. Spinal Cord Injuries; pp. 181–193. - DOI
    1. Chen Y., Tang Y., Vogel L.C., DeVivo M.J. Causes of Spinal Cord Injury. Top. Spinal Cord Inj. Rehabil. 2013;19:7. doi: 10.1310/sci1901-1. - DOI - PMC - PubMed
    1. Rowland J.W., Hawryluk G.W.J., Kwon B., Fehlings M.G. Current status of acute spinal cord injury pathophysiology and emerging therapies: Promise on the horizon. Neurosurg. Focus. 2008;25:E2. doi: 10.3171/FOC.2008.25.11.E2. - DOI - PubMed
    1. Anjum A., Yazid M., Daud M.F., Idris J., Hwei Ng A., Naicker A.S., Ismail O., Kumar R.A., Lokanathan Y. Spinal Cord Injury: Pathophysiology, Multimolecular Interactions, and Underlying Recovery Mechanisms. Int. J. Mol. Sci. 2020;21:7533. doi: 10.3390/ijms21207533. - DOI - PMC - PubMed
    1. Ong B., Wilson J.R., Henzel M.K. Management of the Patient with Chronic Spinal Cord Injury. Med. Clin. N. Am. 2020;104:263–278. doi: 10.1016/j.mcna.2019.10.006. - DOI - PubMed