. 2023 Apr 11;24(8):7059.
doi: 10.3390/ijms24087059.

The Forms of the Lectin Tff2 Differ in the Murine Stomach and Pancreas: Indications for Different Molecular Functions

Affiliations

The Forms of the Lectin Tff2 Differ in the Murine Stomach and Pancreas: Indications for Different Molecular Functions

Eva B Znalesniak et al. Int J Mol Sci. .

Abstract

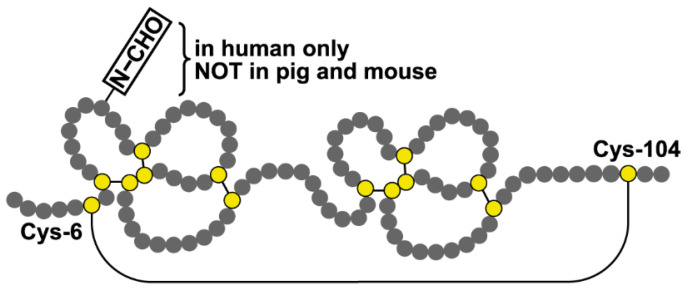
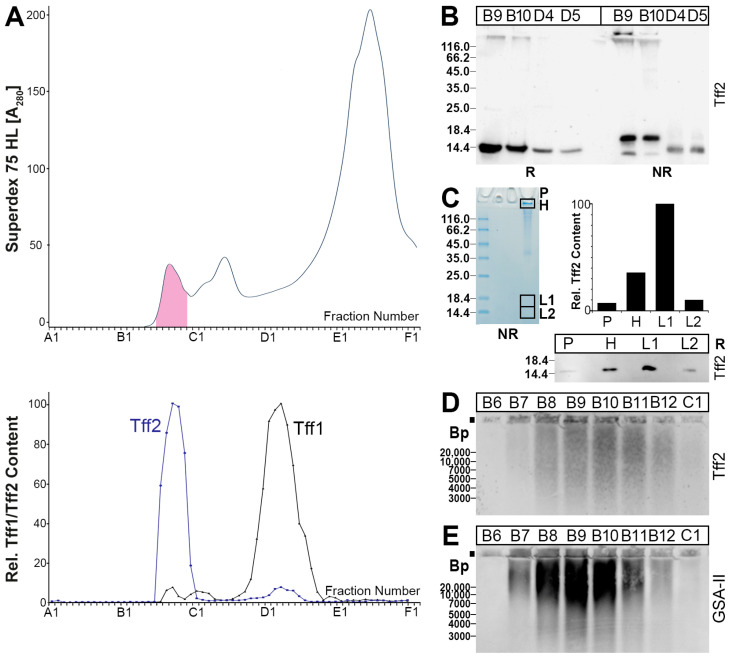
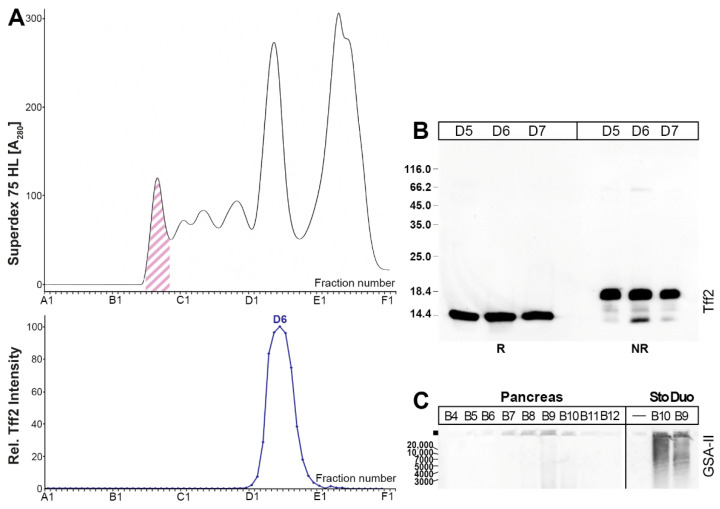
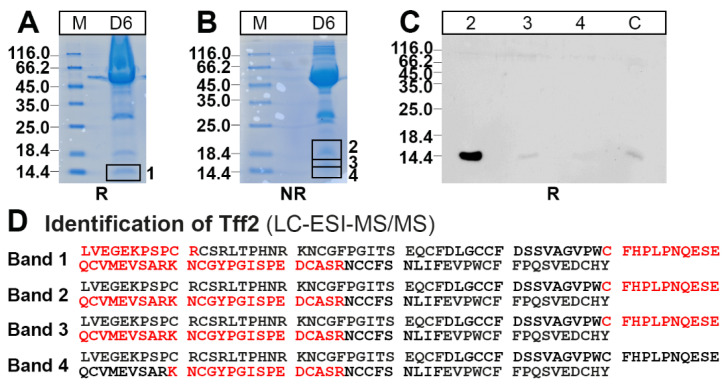
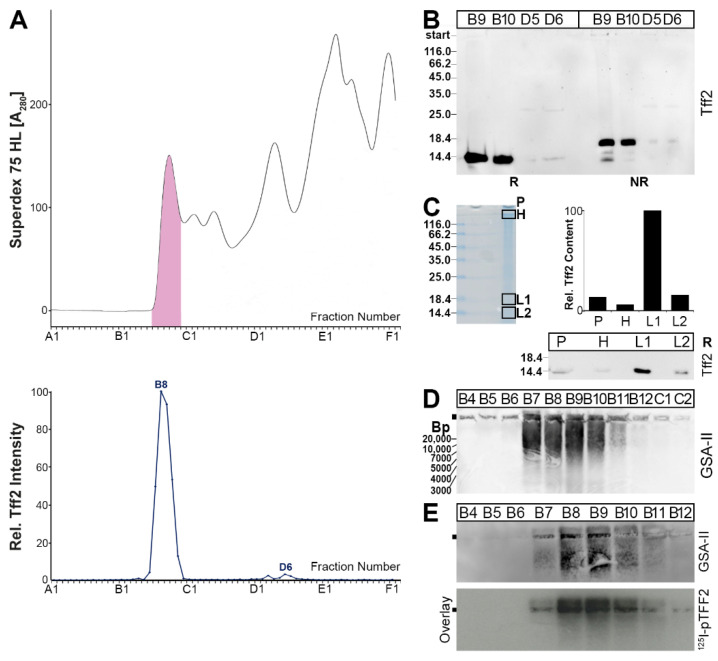
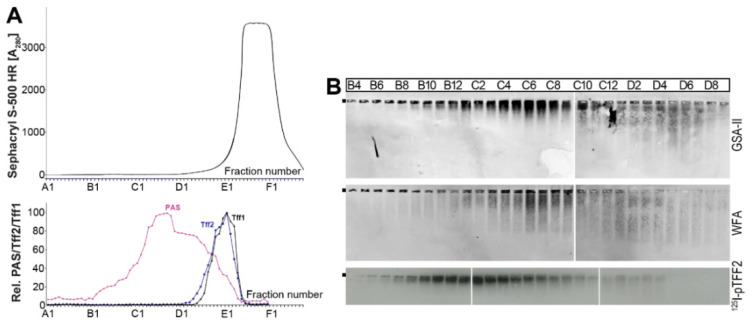
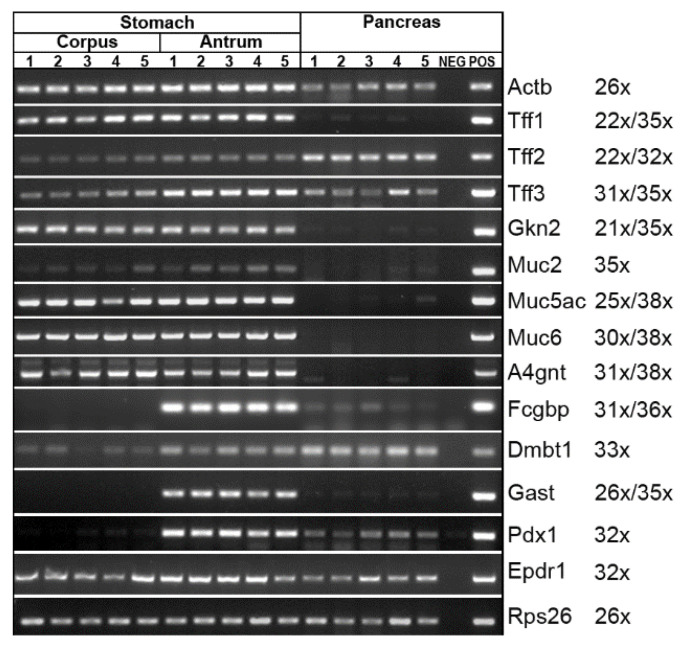
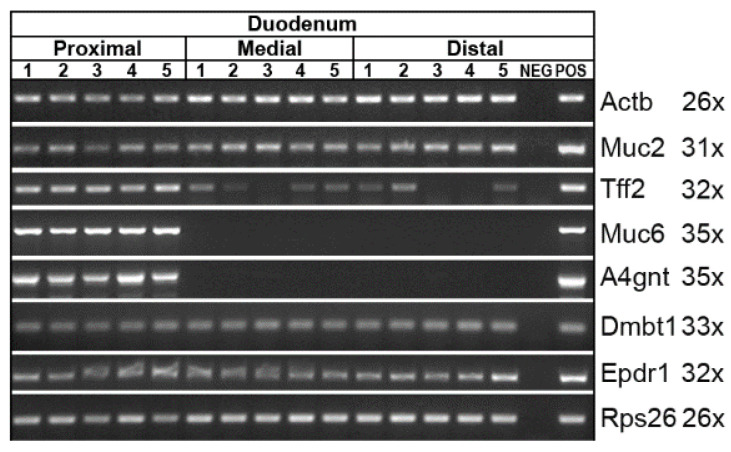
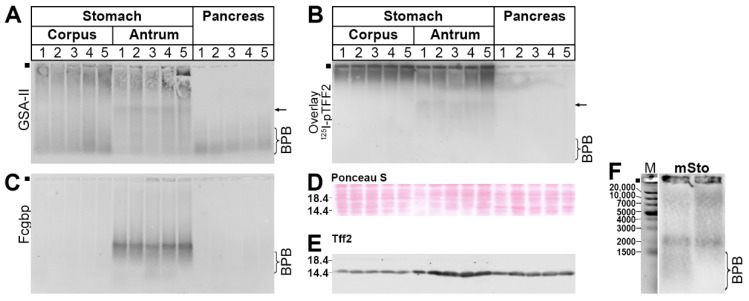
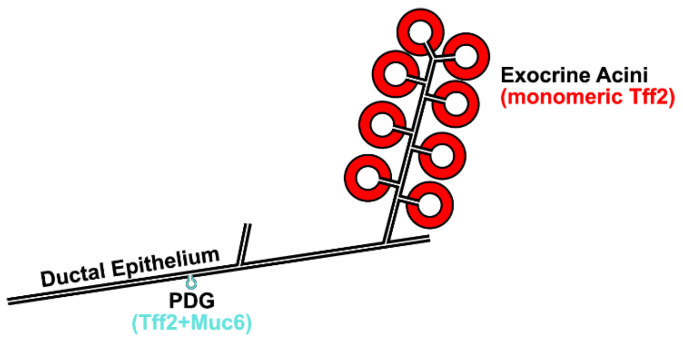
The lectin TFF2 belongs to the trefoil factor family (TFF). This polypeptide is typically co-secreted with the mucin MUC6 from gastric mucous neck cells, antral gland cells, and duodenal Brunner glands. Here, TFF2 fulfills a protective function by forming a high-molecular-mass complex with the MUC6, physically stabilizing the mucus barrier. In pigs and mice, and slightly in humans, TFF2 is also synthesized in the pancreas. Here, we investigated the murine stomach, pancreas, and duodenum by fast protein liquid chromatography (FPLC) and proteomics and identified different forms of Tff2. In both the stomach and duodenum, the predominant form is a high-molecular-mass complex with Muc6, whereas, in the pancreas, only low-molecular-mass monomeric Tff2 was detectable. We also investigated the expression of Tff2 and other selected genes in the stomach, pancreas, and the proximal, medial, and distal duodenum (RT-PCR analysis). The absence of the Tff2/Muc6 complex in the pancreas is due to a lack of Muc6. Based on its known motogenic, anti-apoptotic, and anti-inflammatory effects, we propose a protective receptor-mediated function of monomeric Tff2 for the pancreatic ductal epithelium. This view is supported by a report that a loss of Tff2 promotes the formation of pancreatic intraductal mucinous neoplasms.

Keywords: MUC6; TFF2; branching morphogenesis; lectin; mucin; pancreas; pancreatic cancer; pancreatic organogenesis; stomach; trefoil factor.


Conflict of interest statement

The authors declare no conflict of interest.

Figures

Figure 1
Figure 1
Disulfide-linked schematic structure of TFF2. Cysteine residues are shown in yellow. The N-linked carbohydrate moiety typical of human TFF2 is indicated.
Figure 2
Figure 2
Analysis of a murine gastric extract (5 animals). (A) Elution profile after SEC (Superdex 75 HL) as determined by absorbance at 280 nm (PAS-positive mucin fractions: pink). Underneath: Distribution of the relative Tff1 (black) and Tff2 contents (blue) as determined by Western blot analysis under reducing conditions and semi-quantitative analysis of the monomeric band intensities. (B) 15% SDS-PAGE under reducing (R) and non-reducing (NR) conditions, respectively, and Western blot analysis of the high-molecular-mass fractions B9 and B10, as well as the low-molecular-mass fractions D4 and D5 concerning Tff2. (C) Non-reducing 15% SDS-PAGE of fraction B10 and Coomassie staining. The high- (H) and low-molecular-mass regions (L1, L2) were excised, proteins eluted, and subjected to reducing SDS-PAGE. The samples not entering the gel were removed from the gel pocket (P) and subjected to reducing SDS-PAGE. Western blot analysis concerning Tff2 of P, H, L1, and L2 and relative Tff2 content. (D,E) 1% AgGE and Western blot analysis of fractions B6–C1 concerning Tff2 (D) or Muc6 (lectin GSA-II, (E)). Relative standard: DNA ladder (base pairs).
Figure 3
Figure 3
Analysis of a murine pancreatic extract (3 animals). (A) Elution profile after SEC on a Superdex 75 HL column as determined by absorbance at 280 nm (faint PAS-positive mucin fractions: pink-hashed). Underneath: Distribution of the relative Tff2 content as determined by Western blot analysis under reducing conditions and semi-quantitative analysis of the monomeric band intensities. (B) 15% SDS-PAGE under reducing (R) and non-reducing (NR) conditions, respectively, and Western blot analysis of the low-molecular-mass fractions D5–D7 concerning Tff2. (C) 1% AgGE and Western blot analysis of high-molecular-mass fractions B4–B12 concerning Muc6 (lectin GSA-II). As positive controls, equivalent samples from the stomach (Sto) and duodenum (Duo), respectively, were analyzed. Relative standard: DNA ladder (base pairs).
Figure 4
Figure 4
Proteome analysis of the low-molecular-mass form of Tff2 in a pancreatic extract (fraction D6 from Figure 3). (A) SDS-PAGE under reducing (R) conditions and Coomassie staining. Band 1 was excised. (B) NR SDS-PAGE and Coomassie staining. Bands 2, 3, and 4 were excised, proteins eluted, and subjected to reducing SDS-PAGE. (C) Western blot analysis concerning Tff2 (bands 2–4; C positive control). (D) Results of the proteome analyses after tryptic in-gel digestion of bands 1–4. Identified regions in Tff2 are shown in red.
Figure 5
Figure 5
Analysis of a murine duodenal extract (complete duodena from 4 animals). (A) Elution profile after SEC on a Superdex 75 HL column as determined by absorbance at 280 nm (PAS-positive mucin fractions: pink). Underneath: Distribution of the relative Tff2 content as determined by Western blot analysis under reducing conditions and semi-quantitative analysis of the monomeric band intensities. (B) 15% SDS-PAGE under reducing (R) and non-reducing (NR) conditions, respectively, and Western blot analysis of the high-molecular-mass fractions B9 and B10, as well as the low-molecular-mass fractions D6 and D7 concerning Tff2. (C) Non-reducing 15% SDS-PAGE of fraction B8 and Coomassie staining. The high- (H) and low-molecular-mass regions (L1, L2) were cut out, the proteins were eluted, and subjected to reducing SDS-PAGE. Also, the remaining high-molecular-mass sample not entering the gel was removed from the gel pocket (P) and subjected to reducing SDS-PAGE. Western blot analysis concerning Tff2 of P, H, L1, and L2 and relative Tff2 content. (D) 1% AgGE and Western blot analysis of the fractions B4–C2 concerning Muc6 (lectin GSA-II). Relative standard: DNA ladder (base pairs). (E) 1% AgGE and Western blot analysis of high-molecular-mass fractions B3–B12 of a parallel SEC concerning Muc6 (lectin GSA-II). Shown are also the hybridization signals (autoradiography) obtained after incubating the blot with 125I-labeled porcine pancreatic TFF2 (pTFF2; overlay assay).
Figure 6
Figure 6
Analysis of a murine gastric extract (9 animals) after reduction in boiling β-mercaptoethanol. (A) Elution profile after SEC on a Sephacryl S-500 High Resolution column as determined by absorbance at 280 nm. Underneath: Distribution of the relative Tff1 (black) and Tff2 contents (blue). For comparison, the fractions were analyzed for their mucin content using the PAS reaction (pink). (B) 1% AgGE and subsequent Western blot analysis of the mucin-containing fractions B4–D9 concerning Muc6 (lectin GSA-II) and Muc5ac (lectin WFA), respectively. The hybridization signals (autoradiography) obtained after incubating the blot with 125I-labeled porcine pancreatic TFF2 (pTFF2; overlay assay) are also shown. The start is marked with a dot on the left.
Figure 7
Figure 7
RT-PCR analysis. Tff1, Tff2, Tff3, Gkn2, Muc2, Muc5ac, Muc6, A4gnt, Fcgbp, Dmbt1, Gast, Pdx1, and Epdr1 expression in the gastric corpus and antrum, respectively, as well as in the pancreas. The number of amplification cycles is given in parentheses (if different for stomach and pancreas). As controls, expression of Actb and Rps26, respectively, was monitored.
Figure 8
Figure 8
RT-PCR analysis. Muc2, Tff2, Muc6, A4gnt, Dmbt1, and Epdr1 expression in the proximal, medial, and distal portions of the murine duodenum. The number of amplification cycles is given in parentheses. As controls, the expression of Actb and Rps26, respectively, was monitored.
Figure 9
Figure 9
Western blot analysis and in vitro binding study. 1% AgGE and Western blot analysis of TRIzol extracts from 5 different samples (30 µg protein per lane) of the murine gastric corpus, gastric antrum, and pancreas, respectively (AC). (A) Analysis concerning Muc6 (lectin GSA-II); arrow: antrum-specific signals. (B) Overlay assay with 125I-pTFF2; arrow: antrum-specific signals. (C) Analysis concerning Fcgbp. (D,E) Loading controls of the same samples after reducing SDS-PAGE: protein staining with Ponceau S (D) and Western blot concerning Tff2 (E), respectively. (F) Controls: Relative standard: DNA ladder (base pairs), murine gastric extracts (before SEC and fraction B9 from Figure 2; analysis concerning Fcgbp). The start (dot) and the dye bromophenol blue (BPB) are marked.
Figure 10
Figure 10
Schematic structure of the exocrine pancreas (not drawn to scale). Ductules from a group of acini converge to an intralobular duct, which is connected to interlobular and collecting ducts. Shown is the predominant synthesis of Tff2 in the acini (red), and its trace amount co-expression, together with Muc6, in the pancreatic duct glands (PDGs, turquoise). Of note, the total mass of PDGs is much smaller when compared with that of the exocrine acini.

Similar articles

Cited by

References

    1. Jorgensen K.H., Thim L., Jacobsen H.E. Pancreatic spasmolytic polypeptide (PSP): I. preparation and initial chemical characterization of a new polypeptide from porcine pancreas. Regul. Pept. 1982;3:207–219. doi: 10.1016/0167-0115(82)90126-4. - DOI - PubMed
    1. Thim L. Trefoil peptides: From structure to function. Cell. Mol. Life Sci. 1997;53:888–903. doi: 10.1007/s000180050108. - DOI - PMC - PubMed
    1. Kjellev S. The trefoil factor family—Small peptides with multiple functionalities. Cell. Mol. Life Sci. 2009;66:1350–1369. doi: 10.1007/s00018-008-8646-5. - DOI - PMC - PubMed
    1. Hoffmann W. Trefoil Factor Family (TFF) Peptides and Their Diverse Molecular Functions in Mucus Barrier Protection and More: Changing the Paradigm. Int. J. Mol. Sci. 2020;21:4535. doi: 10.3390/ijms21124535. - DOI - PMC - PubMed
    1. Lefebvre O., Wolf C., Kédinger M., Chenard M.P., Tomasetto C., Chambon P., Rio M.C. The mouse one P-domain (pS2) and two P-domain (mSP) genes exhibit distinct patterns of expression. J. Cell Biol. 1993;122:191–198. doi: 10.1083/jcb.122.1.191. - DOI - PMC - PubMed

LinkOut - more resources