. 2023 Apr 11;24(8):7063.
doi: 10.3390/ijms24087063.

Long-Term Transcriptomic Changes and Cardiomyocyte Hyperpolyploidy after Lactose Intolerance in Neonatal Rats

Affiliations

Long-Term Transcriptomic Changes and Cardiomyocyte Hyperpolyploidy after Lactose Intolerance in Neonatal Rats

Olga V Anatskaya et al. Int J Mol Sci. .

Abstract

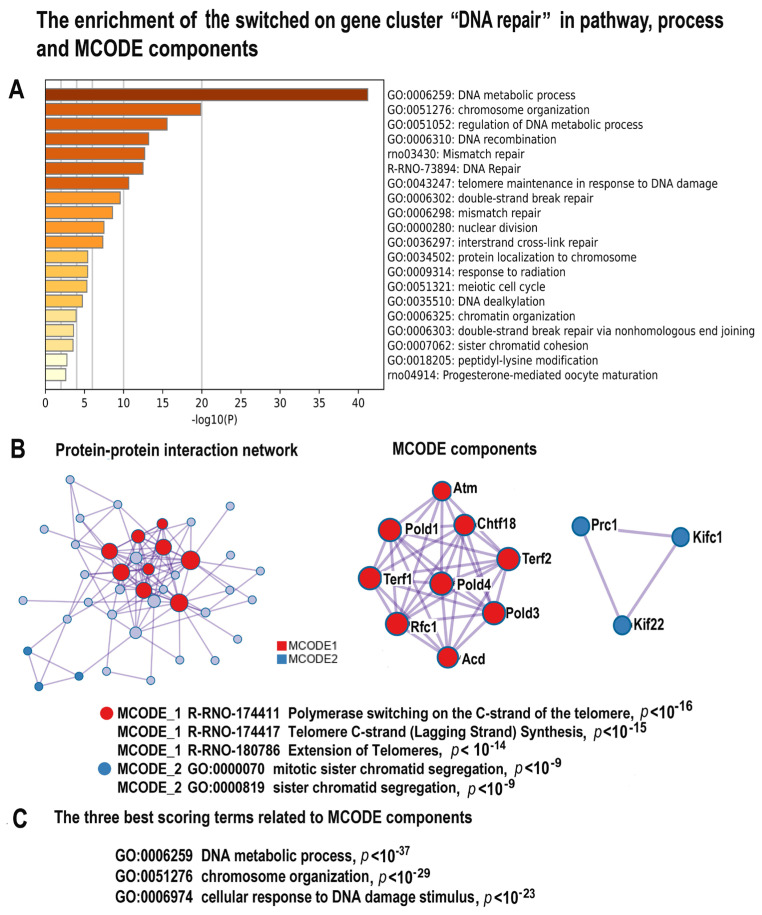
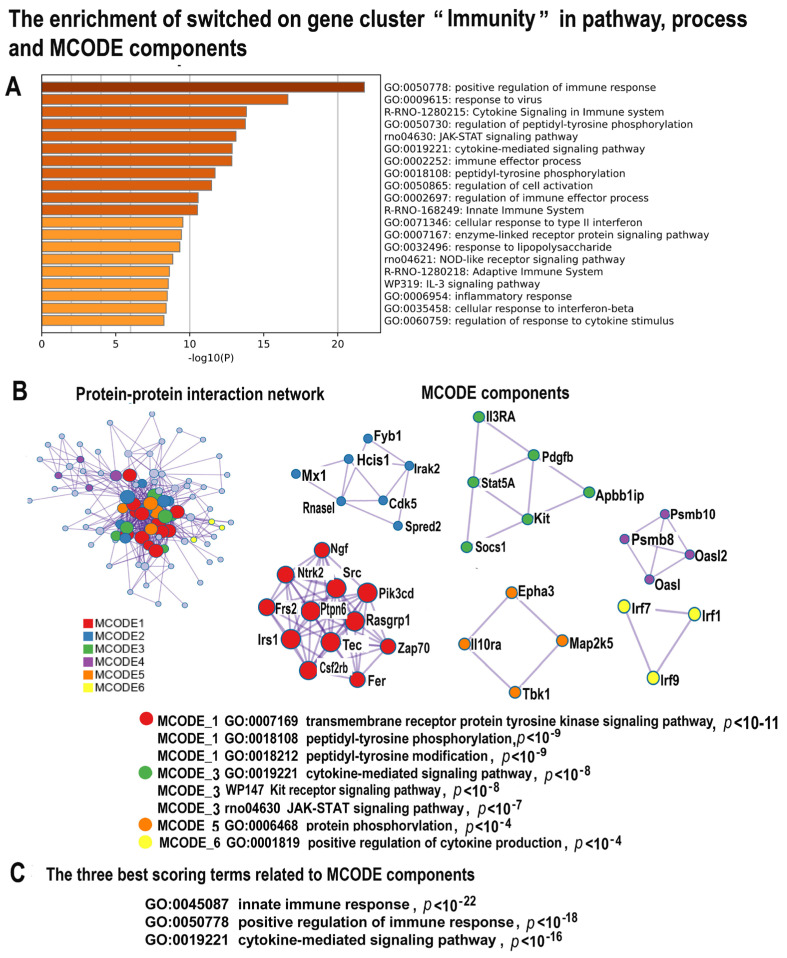
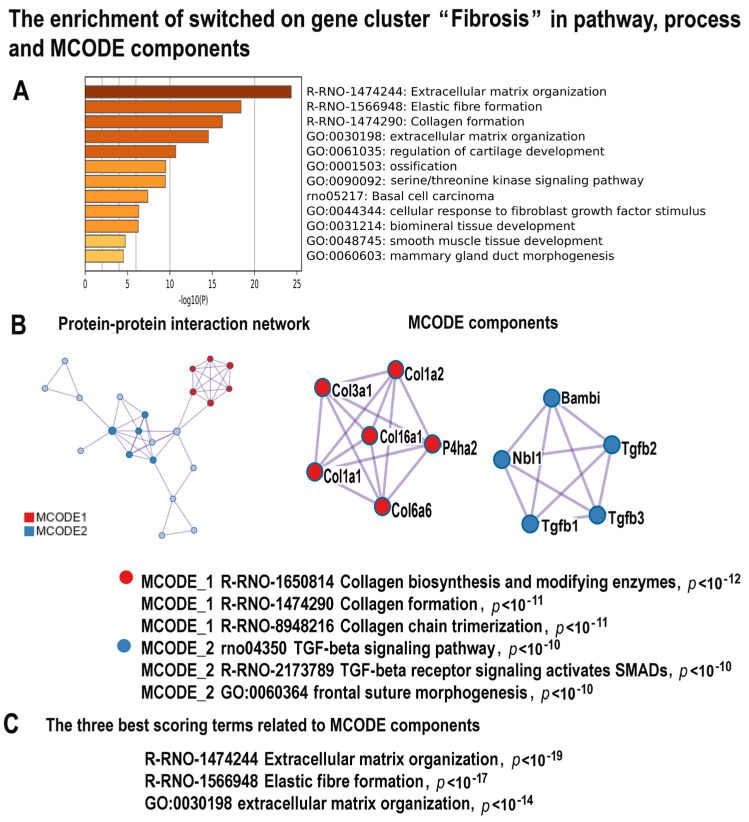
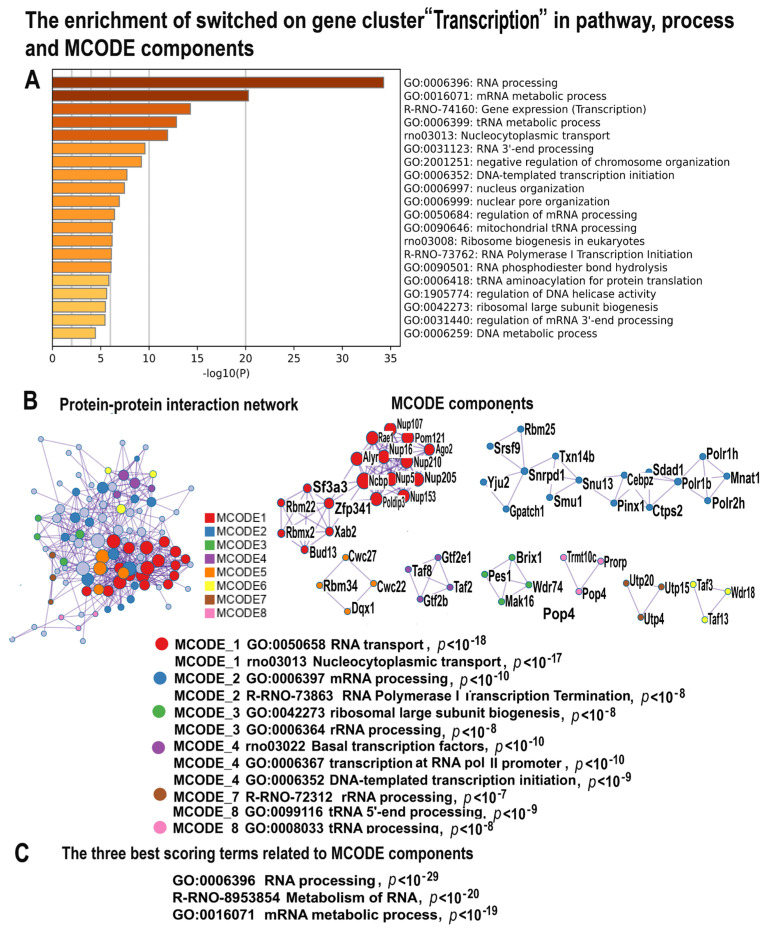
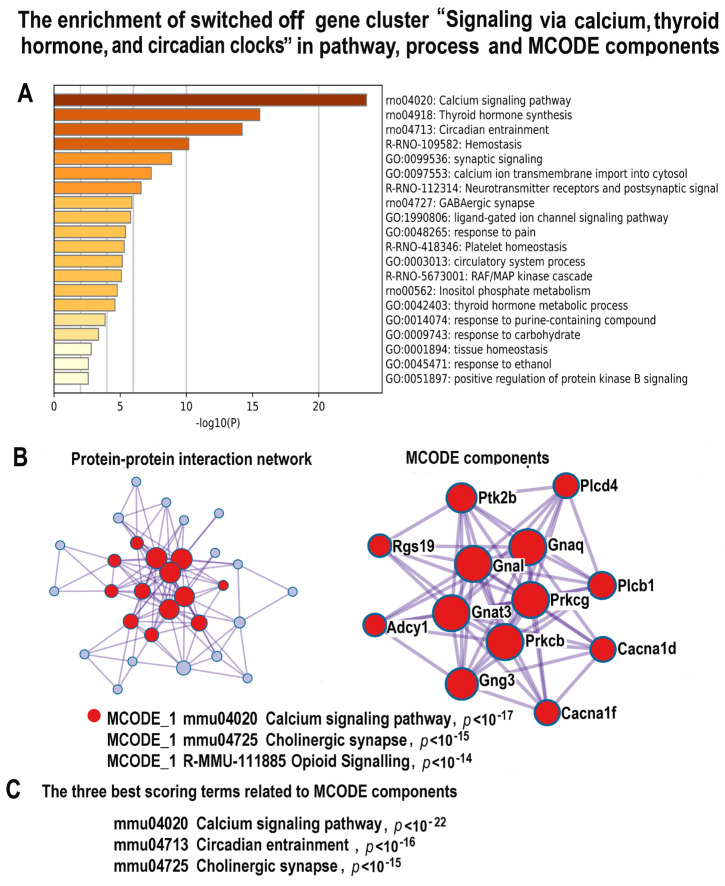
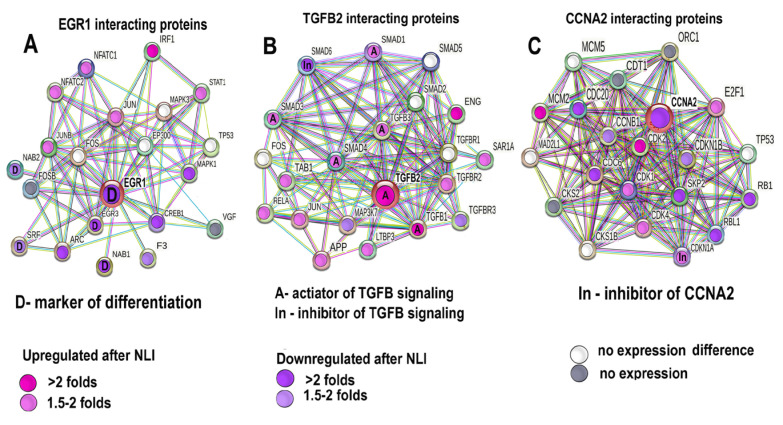
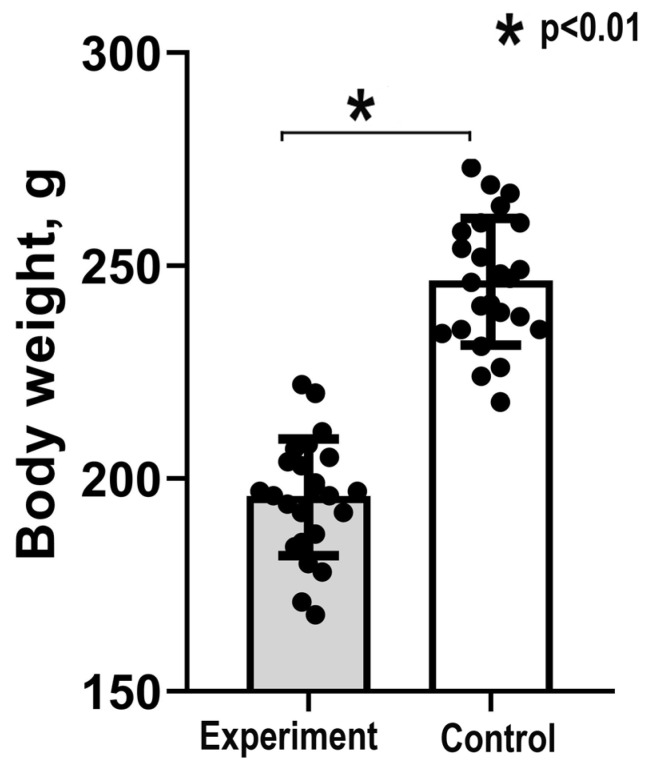
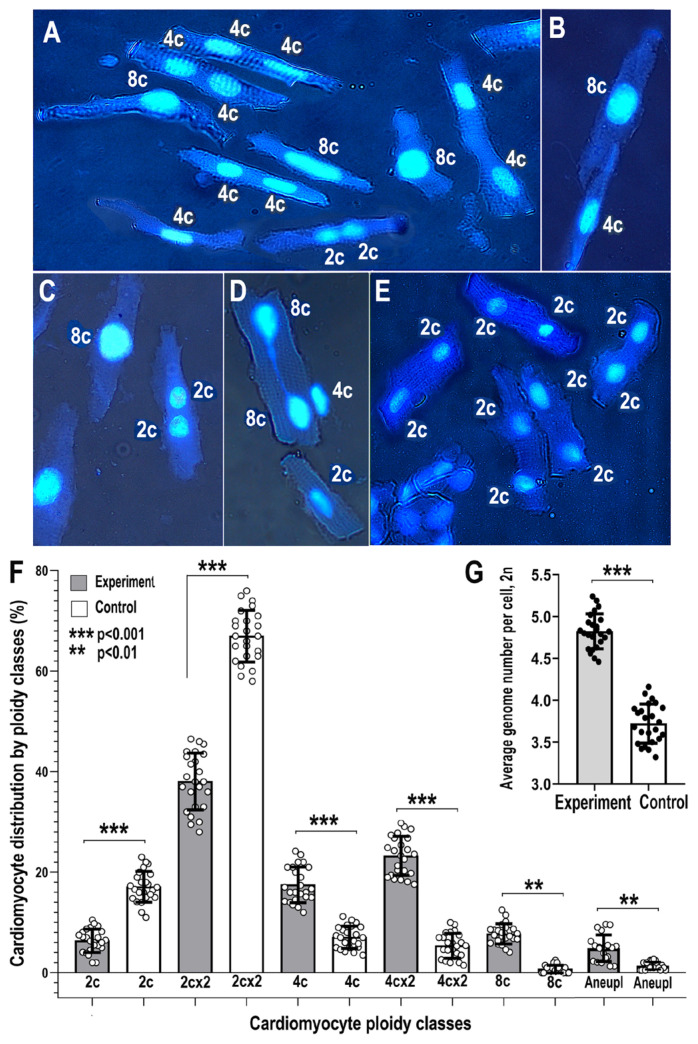
Many cardiovascular diseases originate from growth retardation, inflammation, and malnutrition during early postnatal development. The nature of this phenomenon is not completely understood. Here we aimed to verify the hypothesis that systemic inflammation triggered by neonatal lactose intolerance (NLI) may exert long-term pathologic effects on cardiac developmental programs and cardiomyocyte transcriptome regulation. Using the rat model of NLI triggered by lactase overloading with lactose and the methods of cytophotometry, image analysis, and mRNA-seq, we evaluated cardiomyocyte ploidy, signs of DNA damage, and NLI-associated long-term transcriptomic changes of genes and gene modules that differed qualitatively (i.e., were switched on or switched off) in the experiment vs. the control. Our data indicated that NLI triggers the long-term animal growth retardation, cardiomyocyte hyperpolyploidy, and extensive transcriptomic rearrangements. Many of these rearrangements are known as manifestations of heart pathologies, including DNA and telomere instability, inflammation, fibrosis, and reactivation of fetal gene program. Moreover, bioinformatic analysis identified possible causes of these pathologic traits, including the impaired signaling via thyroid hormone, calcium, and glutathione. We also found transcriptomic manifestations of increased cardiomyocyte polyploidy, such as the induction of gene modules related to open chromatin, e.g., "negative regulation of chromosome organization", "transcription" and "ribosome biogenesis". These findings suggest that ploidy-related epigenetic alterations acquired in the neonatal period permanently rewire gene regulatory networks and alter cardiomyocyte transcriptome. Here we provided first evidence indicating that NLI can be an important trigger of developmental programming of adult cardiovascular disease. The obtained results can help to develop preventive strategies for reducing the NLI-associated adverse effects of inflammation on the developing cardiovascular system.

Keywords: DNA instability; cardiomyocyte; developmental programming of adult heart diseases; fibrosis; glutathione deficiency; inflammation; neonatal lactose intolerance; polyploidy; qualitative transcriptome analysis; thyroid deficiency.


Conflict of interest statement

The authors declare no potential conflict of interest. The authors confirm that the data supporting the findings of this study are available within the paper and its Supplementary Materials.

Figures

Figure 4
Figure 4
The enrichment of NLI-induced genes related to the cluster “DNA Repair” in gene pathways and in processes and molecular complexes. (A)—Bar graph of enriched terms related to gene modules and processes across the gene cluster related to DNA repair. The statistical significance of enrichment is shown at the X-axis (−log10 ((p))). (B)—Protein–protein interaction network and MCODE components (or densely connected network components) that were identified in the gene list. The network and MCODE components were constructed on the base of physical interactions taken from String server (physical score > 0.4). The coding by color squares reflects the MCODE components. The coding by color circles indicates the results of MCODE component pathway and process enrichment analysis. (C)—The three best-scoring terms related to MCODE components.
Figure 5
Figure 5
The enrichment of NLI-induced genes related to the cluster “Immunity” in gene pathways, processes, and molecular complexes. (A)—Bar graph of enriched terms related to gene pathways and processes across the gene cluster related to immunity. The statistical significance of enrichment is shown in X-axis (−log10(p)). (B)—Protein–protein interaction network and MCODE complexes that were identified in the gene list. The network and MCODE components were constructed on the base of physical interactions taken from the String server (physical score > 0.4). The coding by color square reflects the MCODE components. The coding by color circles indicates the results of MCODE component pathway and process enrichment analysis. (C)—The three best-scoring terms related to MCODE.
Figure 6
Figure 6
The enrichment of NLI−induced genes related to the cluster “Fibrosis” in gene pathway and process and in molecular complexes. (A)—Bar graph of enriched terms related to gene pathways and processes across the gene cluster related to fibrosis. The statistical significance of enrichment is shown in X-axis (−log10(p)). (B)—Protein–protein interaction network and MCODE components (or densely connected network components) were identified in the gene list. The network and MCODE components were constructed on the base of physical interactions taken from the String server (physical score > 0.4). The coding by color square reflects the MCODE components. The coding by color circles indicates the results of MCODE component pathway and process enrichment analysis. (C)—The three best-scoring terms related to MCODE components.
Figure 7
Figure 7
The enrichment of NLI−induced genes related to the cluster “Transcription” in gene pathway and process and in molecular complexes. (A)—Bar graph of enriched terms related to gene pathways and processes across the gene cluster related to transcription. The statistical significance of enrichment is shown in X-axis (−log10(p)). (B)—Protein–protein interaction network and MCODE components (or densely connected network components) were identified in the gene list. The network and MCODE components were constructed on the base of physical interactions taken from the String server (physical score > 0.4). The coding by color square reflects the MCODE components. The coding by color circles indicates the results of the MCODE component pathway and process enrichment analysis. (C)—The three best-scoring terms related to MCODE components.
Figure 8
Figure 8
The enrichment of NLI−inhibited genes related to the cluster “Signaling via calcium, thyroid and circadian clocks” in gene pathway and process and in molecular complexes. (A)—Bar graph of enriched terms related to gene pathways and processes across the gene cluster related to signaling via calcium, thyroid hormone, and circadian clocks. The statistical significance of enrichment is shown in X-axis (−log10(p)). (B)—Protein–protein interaction network and MCODE components (or densely connected network components) were identified in the gene list. The network and MCODE components were constructed on the base of physical interactions taken from the String server (physical score > 0.4). The coding by color square reflects the MCODE components. The coding by color circles indicates the results of the MCODE component pathway and process enrichment analysis. (C)—The three best-scoring terms related to MCODE components.
Figure 9
Figure 9
Validation of mRNA−seq data by qRT−PCR for Egr1, Tgfb2 and Ccna2. The bars represent mean values; the error bars show confidence intervals (CI), p = 0.95; the points represent separate values. The figure illustrates concordance between the data on the experiment vs. the control gene expression difference obtained with the mRNA−seq and qRT−PCR. The significance level for differences is p < 0.05 at least (Mann−Whitney and t−test).
Figure 10
Figure 10
Protein interaction networks for proteins encoding for Egr1, Tgfb2, Ccna2, and their closest interactants matched with the data on the expression difference for the experiment vs. the control defined by mRNA–seq. (A)—Protein interaction networks for Egr1. It can be seen that EGR1 decreases expression together with its direct regulators and markers of differentiation Nab1, Nab2, Egr1, and Srf [105,106,107]. (B)—Protein interaction networks for TGFB2 indicates that Tgfb2 is upregulated together with the upregulation of its activators Tgfb1, 3 and Smad 3, 4, and the downregulation of its inhibitor Smad 6 [108]. (C)—Protein interaction network for Ccna2 demonstrates that Ccna2 is downregulated together with the upregulation of its inhibitor Cdkn1a [71,109]. The network is constructed for the 20 closest interactants of Egr1, Tgfb2, and Ccna2.
Figure 11
Figure 11
The enrichment of NLI−inhibited genes related to the cluster “Detoxication” in gene pathway and process and molecular complexes. (A)—Bar graph of enriched terms related to gene pathways and processes across the gene cluster related to detoxification, colored by different p-values. (B)—Protein–protein interaction network and MCODE components (or densely connected network components) were identified in the gene list. The network and MCODE components were constructed on the base of physical interactions taken from String server (physical score > 0.4). The coding by color square reflects the MCODE components. The coding by color circles indicates the results of MCODE component pathway and process enrichment analysis. (C)—The three best-scoring terms related to MCODE components.
Figure 1
Figure 1
Body weight in the experimental and control animals. The figure illustrates the decreased body weight in the experimental animals compared with the control even after 4 months of recovery from NLI (Mann–Whitney and t-test, p < 0.01). The bars represent mean values; the error bars show confidence intervals (CI), p = 0.95; the points represent separate values.
Figure 2
Figure 2
Increased cardiomyocyte ploidy and genetic instability in the experimental animals compared to the control. (AC)—cardiomyocytes with polyploid nuclei containing 4 or 8 genomes from the NLI survived rats. (D)—cardiomyocytes of the experimental animal with two octaploid nuclei with a bridge between them pointing to DNA instability. This image illustrates DNA instability after NLI. (E)—cardiomyocytes of the control animals with diploid nuclei. This image demonstrates the lower cardiomyocyte ploidy of the control animals compared to the experiment. Nuclei are stained with Hoechst 33258, double lightning, transmitted light and luminescence, phase contrast. Total magnification is ×200. (F)—distribution of cardiomyocytes by ploidy classes in the control and experimental animals. Figure illustrates the increased percentages of tetraploid, octaploid, and aneuploid cells in the experiment compared to the control. (G)—average cardiomyocyte ploidy levels. The figure illustrates the increase in the average cardiomyocyte genome number per cell in the experiment compared to the control. The values are presented as mean ± confidence intervals (CI), p = 0.95. The statistical significance of differences is indicated in the Figure (Mann–Whitney).
Figure 3
Figure 3
Two dimensional histograms of gene expression levels in the experiment (NLI) vs. the control. (A)—2D representation. The four peaks of gene expression density are visible: the lower left (no expression both in experiment and the control), the upper left (expression only in the experiment, i.e., switched on), the lower right (expression only in the control, i.e., switched off), and the upper right (expression both in experiment and the control). The cutoff values are shown by the horizontal and vertical black lines. The genes from the upper left (switched on) and the lower right (switched off) rectangles were analyzed. The significance of pairwise differences between any peaks are p < 10−24 at least (both Mann–Whitney and t-test). (B)—3D representation (the color scale of gene density is seen).

References

    1. Harikrishnan S., Jeemon P., Mini G.K., Thankappan K.R., Sylaja P. GBD 2017 Causes of Death Collaborators Global, Regional, and National Age-Sex-Specific Mortality for 282 Causes of Death in 195 Countries and Territories, 1980–2017: A Systematic Analysis for the Global Burden of Disease Study 2017. Lancet. 2018;392:1736–1788. doi: 10.1016/s0140-6736(18)32203-7. - DOI - PMC - PubMed
    1. Mokdad A.H., Marks J.S., Stroup D.F., Gerberding J.L. Actual Causes of Death in the United States, 2000. JAMA. 2004;291:1238–1245. doi: 10.1001/jama.291.10.1238. - DOI - PubMed
    1. Segovia S.A., Vickers M.H., Harrison C.J., Patel R., Gray C., Reynolds C.M. Maternal High-Fat and High-Salt Diets Have Differential Programming Effects on Metabolism in Adult Male Rat Offspring. Front. Nutr. 2018;5:1. doi: 10.3389/fnut.2018.00001. - DOI - PMC - PubMed
    1. Lurbe E., Ingelfinger J. Developmental and Early Life Origins of Cardiometabolic Risk Factors: Novel Findings and Implications. Hypertension. 2021;77:308–318. doi: 10.1161/HYPERTENSIONAHA.120.14592. - DOI - PubMed
    1. Vrselja A., Pillow J.J., Black M.J. Effect of Preterm Birth on Cardiac and Cardiomyocyte Growth and the Consequences of Antenatal and Postnatal Glucocorticoid Treatment. J. Clin. Med. 2021;10:3896. doi: 10.3390/jcm10173896. - DOI - PMC - PubMed