. 2023 Apr 11;24(8):7073.
doi: 10.3390/ijms24087073.

In Vitro and In Vivo Effects of the Combination of Polypurine Reverse Hoogsteen Hairpins against HER-2 and Trastuzumab in Breast Cancer Cells

Affiliations

In Vitro and In Vivo Effects of the Combination of Polypurine Reverse Hoogsteen Hairpins against HER-2 and Trastuzumab in Breast Cancer Cells

Ester López-Aguilar et al. Int J Mol Sci. .

Abstract

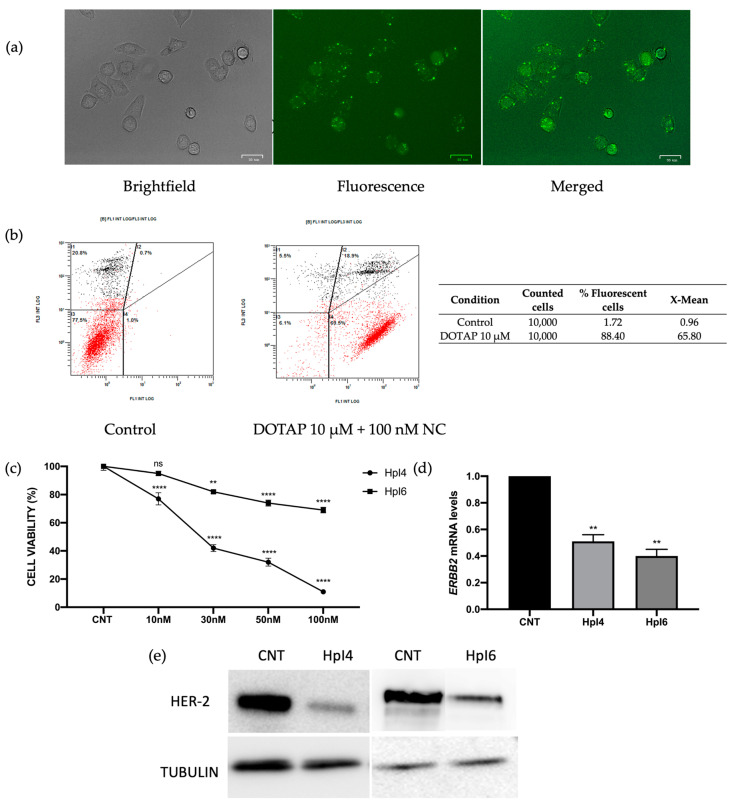
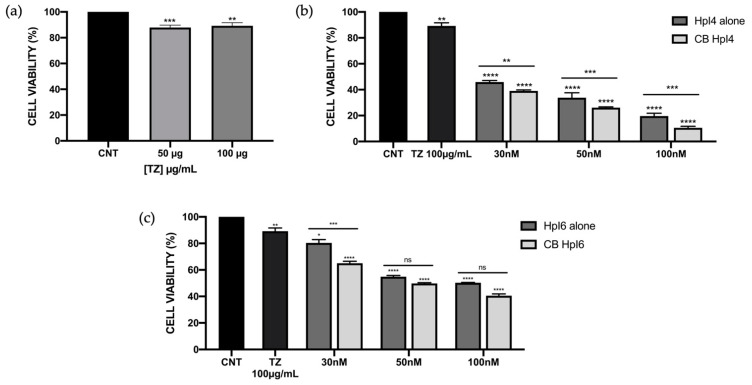
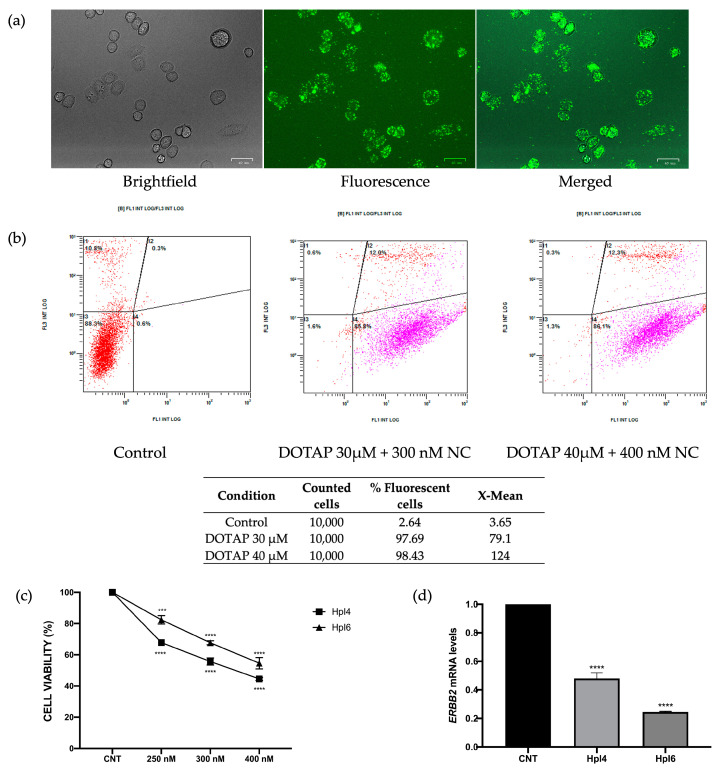
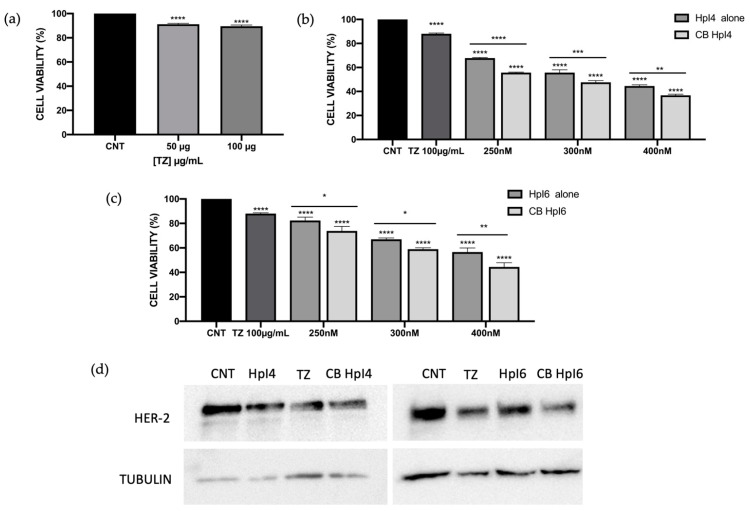
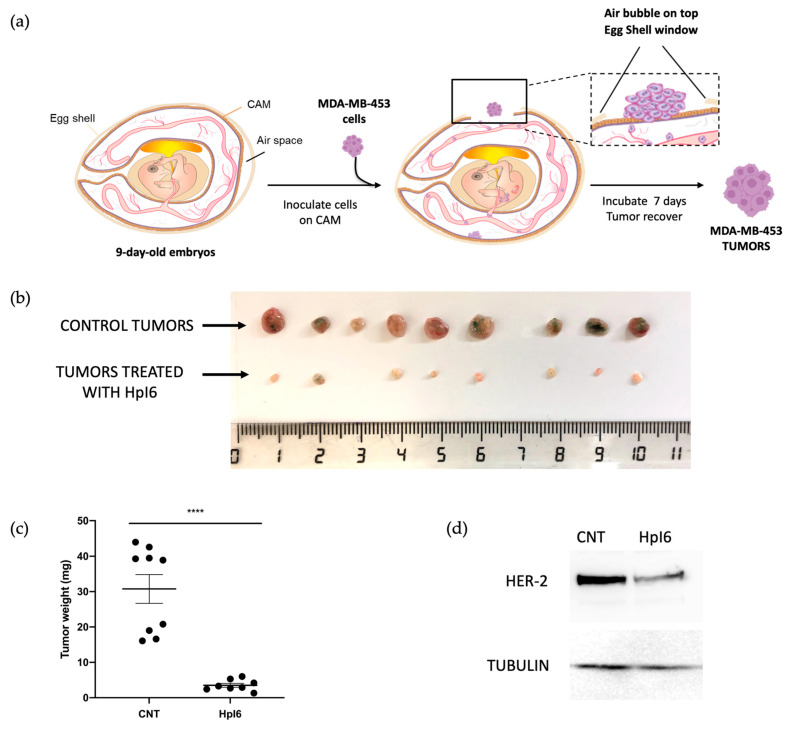
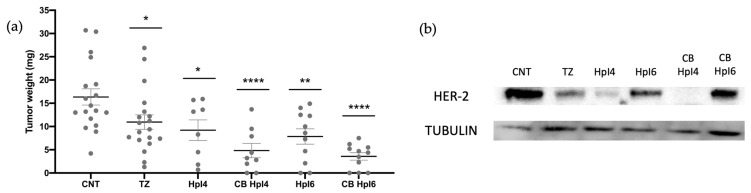
Therapeutic oligonucleotides are powerful tools for the inhibition of potential targets involved in cancer. We describe the effect of two Polypurine Reverse Hoogsteen (PPRH) hairpins directed against the ERBB2 gene, which is overexpressed in positive HER-2 breast tumors. The inhibition of their target was analyzed by cell viability and at the mRNA and protein levels. The combination of these specific PPRHs with trastuzumab was also explored in breast cancer cell lines, both in vitro and in vivo. PPRHs designed against two intronic sequences of the ERBB2 gene decreased the viability of SKBR-3 and MDA-MB-453 breast cancer cells. The decrease in cell viability was associated with a reduction in ERBB2 mRNA and protein levels. In combination with trastuzumab, PPRHs showed a synergic effect in vitro and reduced tumor growth in vivo. These results represent the preclinical proof of concept of PPRHs as a therapeutic tool for breast cancer.

Keywords: HER-2; PPRH; breast cancer; gene silencing; trastuzumab.


Conflict of interest statement

The authors declare no conflict of interest. The funders had no role in the design of the study, in the collection, analysis, or interpretation of data, in the writing of the manuscript, or in the decision to publish the results.

Figures

Figure 1
Figure 1
Uptake of the PPRHs in SKBR-3 cells was analyzed by fluorescent microscopy (a) and flow cytometry (b). 90,000 cells/well were plated and analyzed 24 h after transfection with a negative control of PPRH labeled with fluorescein (FAM). In (b), the intensity of green fluorescence (FL1) corresponding to transfected cells vs. the intensity of orange fluorescence corresponding to dead cells (FL3) is shown, and the results represent data from three independent determinations. (c) Dose-response to HpI4 and HpI6 in SKBR-3 cells (30,000 cells/well). The cell viability assay was performed 4 days after transfection. Results are expressed as a % of the control cells transfected with the negative control (NC). Results are expressed as a % of viability compared to cells transfected with DOTAP only, which corresponds to the control (CNT). (d) ERBB2 mRNA levels determined by RT-qPCR in SKBR-3 cells upon transfection of 100 nM of HpI4 or HpI6 for 24 h. In (c,d), results represent the mean +/− SEM from at least three experiments. Statistical significance was determined using a one-way ANOVA with Dunnett’s multiple comparison test (** p < 0.01, **** p < 0.0001, ns non-significant). (e) Representative image of HER-2 receptor protein levels analyzed by Western blot in SKBR-3 protein extracts from control cells or after 48 h of transfection with 100 nM of HpI4 or HpI6. The signal corresponding to tubulin was used to normalize the results. The determination was performed three times with consistent results.
Figure 2
Figure 2
Effect on SKBR-3 cell viability of HpI4, HpI6, trastuzumab, and their combinations at different concentrations. (a) Effects of 50 and 100 µg/mL of TZ compared to control cells (non-treated). (b,c) Effect on cell viability of HpI4 (b) or HpI6 (c) at 30, 50, and 100 nM alone and in combination with 100 µg/mL of TZ. Cell viability assays were conducted with 60,000 plated cells 3 days after transfection. The data represents the mean +/− SEM from three or four experiments. Statistical significance was determined using a one-way ANOVA with Dunnett’s multiple comparison test (* p < 0.05, ** p < 0.01, *** p < 0.001, **** p < 0.0001, ns non-significant).
Figure 3
Figure 3
Cellular uptake of a fluorescent negative control PPRH (NC) in MDA-MB-453 cells (330,000 cells/well) was analyzed by fluorescent microscopy (a) and flow cytometry (b), 24 h after transfection with either 300 or 400 nM of the PPRH labeled with fluorescein (FAM) and 30 or 40 µM of DOTAP, respectively. In (b), the intensity of green fluorescence corresponding to transfected cells (FL1) vs the intensity of orange fluorescence corresponding to dead cells (FL3) is shown, and the results represent data from three independent determinations. (c) The dose-response effect of both intron-targeting PPRHs transfected at the indicated concentrations on MDA-MB-453 cell viability (330,000 cells/well) was determined 3 days after transfection. For each PPRH concentration, viability was calculated with respect to cells transfected only with DOTAP, which was considered the control. (d) Effect on ERBB2 mRNA levels upon PPRHs transfection in MDA-MB-453 cells (330,000 cells/well) for 24 h. Data from (c,d) represent the mean +/− SEM from three experiments. Statistical significance was determined using a one-way ANOVA with Dunnett’s multiple comparison test (*** p < 0.001, **** p < 0.0001).
Figure 4
Figure 4
Effect on cell viability of HpI4, HpI6, trastuzumab, and their combinations at different concentrations in MDA-MB-453 cells. (a) Effect of 50 and 100 µg/mL of TZ compared to control cells (non-treated). (b,c) Effects of HpI4 (b) and HpI6 (c), either alone or in combination with 100 µg/mL of TZ, on MDA-MB-453 (330,000 cells/well) cell viability. All analyses were performed 3 days after transfection. Data represents the mean +/− SEM from at least three replicates. Statistical significance was determined using a one-way ANOVA with Dunnett’s multiple comparison test (* p < 0.05, ** p< 0.01, *** p < 0.001, **** p < 0.0001). (d) A representative image of the effect of HpI4 and HpI6 and their combinations with TZ on HER-2 protein levels. Protein extracts from MDA-MB-453 cells (330,000/well) were obtained after 48 h of transfection with 300 nM of PPRHs, either in the absence or in the presence of 100 µg/mL of TZ and analyzed by Western blot. The signal detected for tubulin was used to normalize the results. The determination was performed three times with consistent results.
Figure 5
Figure 5
In vivo effects of HpI6. A sample of 330,000 MDA-MB-453 cells/well was seeded in 6-well dishes and transfected the following day with 400 nM of HpI6. Forty-eight hours after transfection, cells were inoculated in the CAM of chicken embryonated eggs. One week later, tumors were extracted and weighed. (a) Main steps in the CAM assay since the inoculation of MDA-MB-453 cells in the chick chorioallantoic membrane until the obtention of tumors. (b) The size of the control tumors (upper row) and those derived from cells transfected with HpI6 (lower row) is shown. (c) Distribution of tumor weight between control and transfected samples. (d) Representative blots of HER-2 levels determined by Western blot in total protein extracts prepared from pools of control (n = 9) and transfected tumors (n = 8). The signal corresponding to tubulin was used to normalize the results. Statistical significance was determined using an unpaired t-test (**** p < 0.0001).
Figure 6
Figure 6
(a) Effect of HpI4, HpI6, trastuzumab, and their combinations on tumor weight. MDA-MB-453 cells were transfected with 300 nM of HpI4 or HpI6, either in the absence or presence of 100 µg/mL of TZ. Forty-eight hours after transfection, cells were inoculated in the CAM of chicken embryonated eggs, and one week later, tumors were extracted and weighed. The distribution of tumor weights between control, antibody-treated, and transfected samples is shown. (b) HER-2 levels determined by Western blot in total protein extracts prepared from tumor pools derived from control (n = 18), antibody-treated (n = 19), and PPRH-transfected cells, either in the absence (n = 8 for HpI4 and n = 11 for HpI6) or in the presence of TZ (n = 9 for CB HpI4 and n = 11 for CB HpI6). The tubulin signal was used to normalize the results. Statistical significance was determined using a one-way ANOVA with Dunnett’s multiple comparison test (* p < 0.05, ** p< 0.01, **** p < 0.0001).

Similar articles

Cited by

References

    1. Ciudad C.J., Rodríguez L., Villalobos X., Félix A.J., Noé V. Polypurine Reverse Hoogsteen Hairpins as a Gene Silencing Tool for Cancer. Curr. Med. Chem. 2017;24:2809–2826. doi: 10.2174/0929867324666170301114127. - DOI - PubMed
    1. De Almagro M.C., Mencia N., Noé V., Ciudad C.J. Coding polypurine hairpins cause target-induced cell death in breast cancer cells. Hum. Gene Ther. 2011;22:451–463. doi: 10.1089/hum.2010.102. - DOI - PubMed
    1. De Almagro M.C., Coma S., Noé V., Ciudad C.J. Polypurine hairpins directed against the template strand of DNA knock down the expression of mammalian genes. J. Biol. Chem. 2009;284:11579–11589. doi: 10.1074/jbc.M900981200. - DOI - PMC - PubMed
    1. Villalobos X., Rodríguez L., Prévot J., Oleaga C., Ciudad C.J., Noé V. Stability and immunogenicity properties of the gene-silencing polypurine reverse hoogsteen hairpins. Mol. Pharm. 2014;11:254–264. doi: 10.1021/mp400431f. - DOI - PubMed
    1. Rodríguez L., Villalobos X., Dakhel S., Padilla L., Hervas R., Luis Hernández J., Ciudad C.J., Noe V. Polypurine reverse Hoogsteen hairpins as a gene therapy tool against survivin in human prostate cancer PC3 cells in vitro and in vivo n.d. Biochem. Pharmacol. 2013;86:1541–1554. doi: 10.1016/j.bcp.2013.09.013. - DOI - PubMed