. 2023 Apr 11;24(8):7080.
doi: 10.3390/ijms24087080.

Ca2+ Dependent Formation/Collapse of Cylindrical Ca2+-ATPase Crystals in Scallop Sarcoplasmic Reticulum (SR) Vesicles: A Possible Dynamic Role of SR in Regulation of Muscle Contraction

Affiliations

Ca2+ Dependent Formation/Collapse of Cylindrical Ca2+-ATPase Crystals in Scallop Sarcoplasmic Reticulum (SR) Vesicles: A Possible Dynamic Role of SR in Regulation of Muscle Contraction

Jun Nakamura et al. Int J Mol Sci. .

Abstract

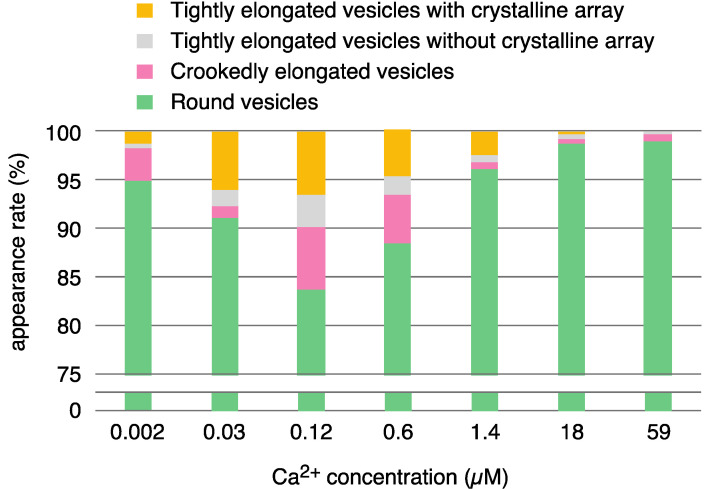
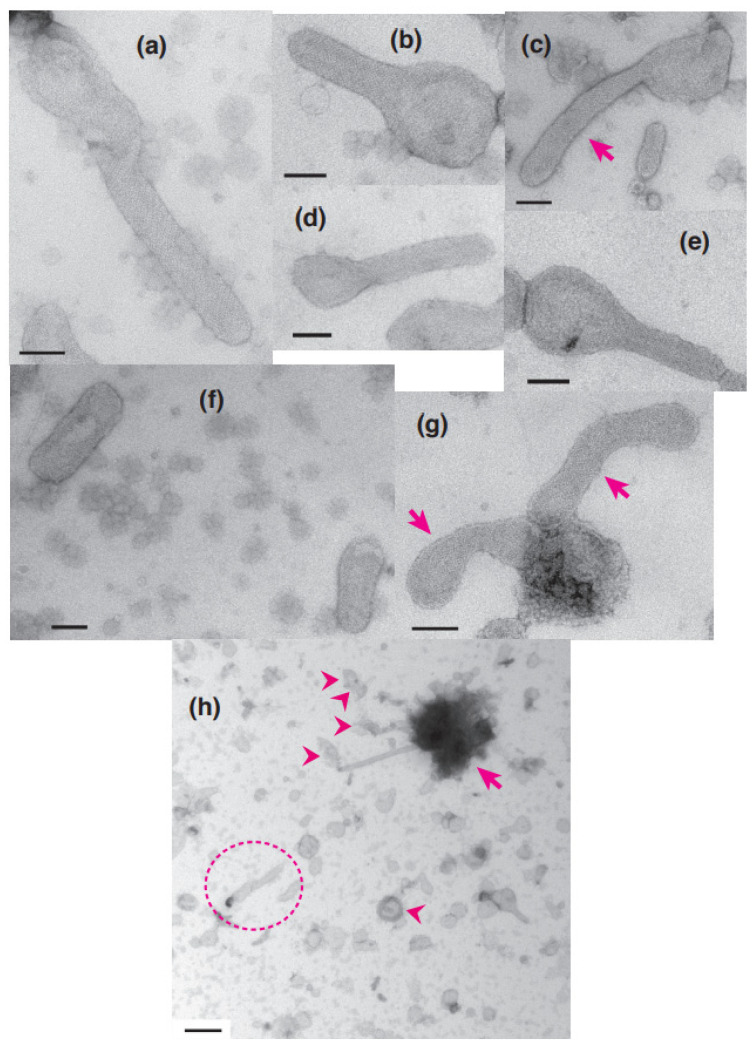
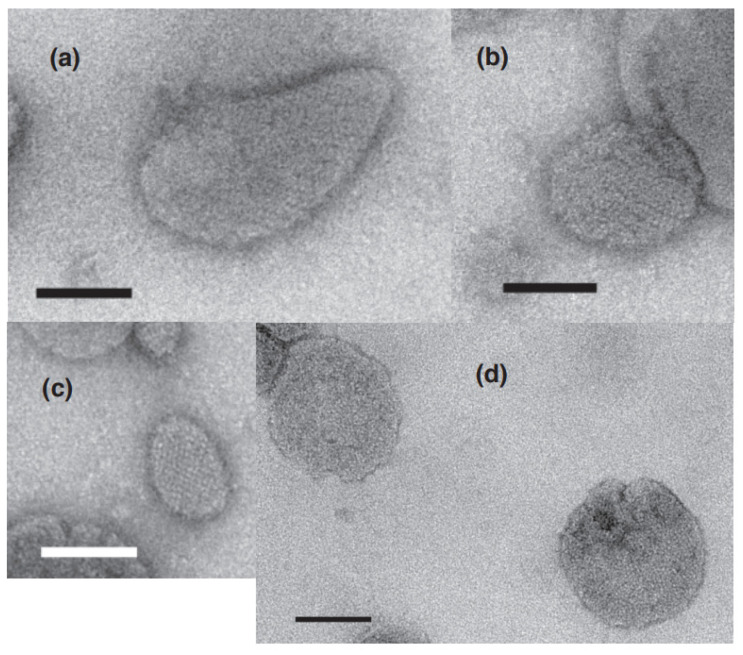
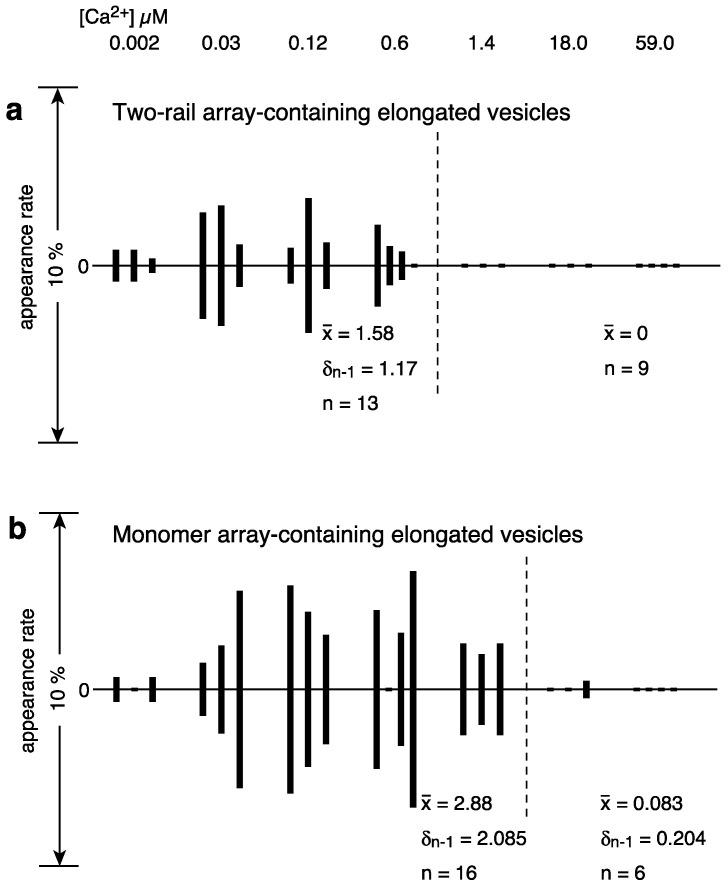
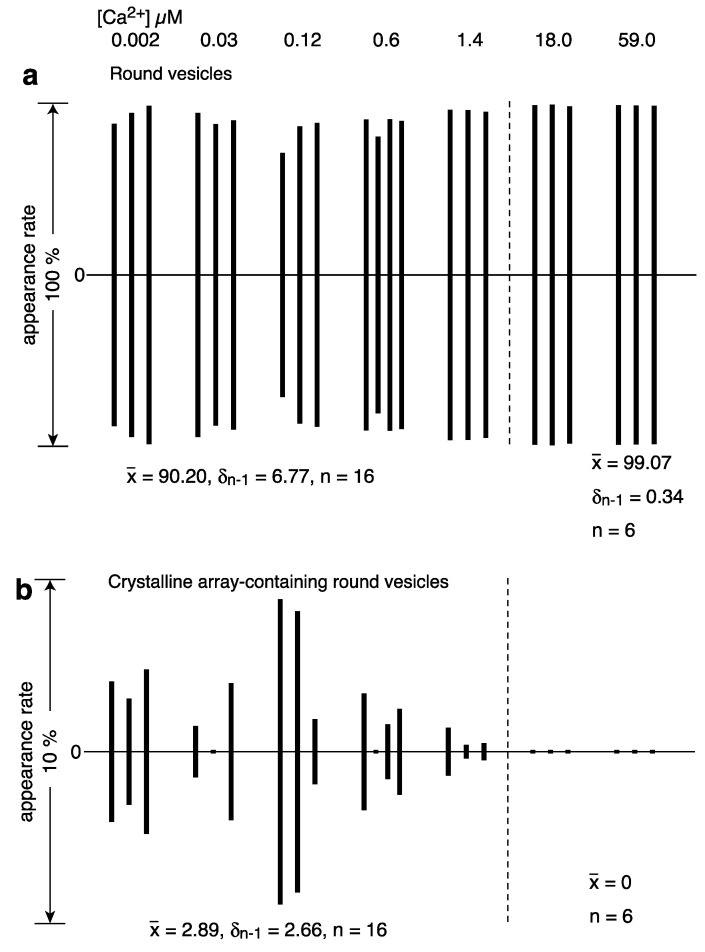
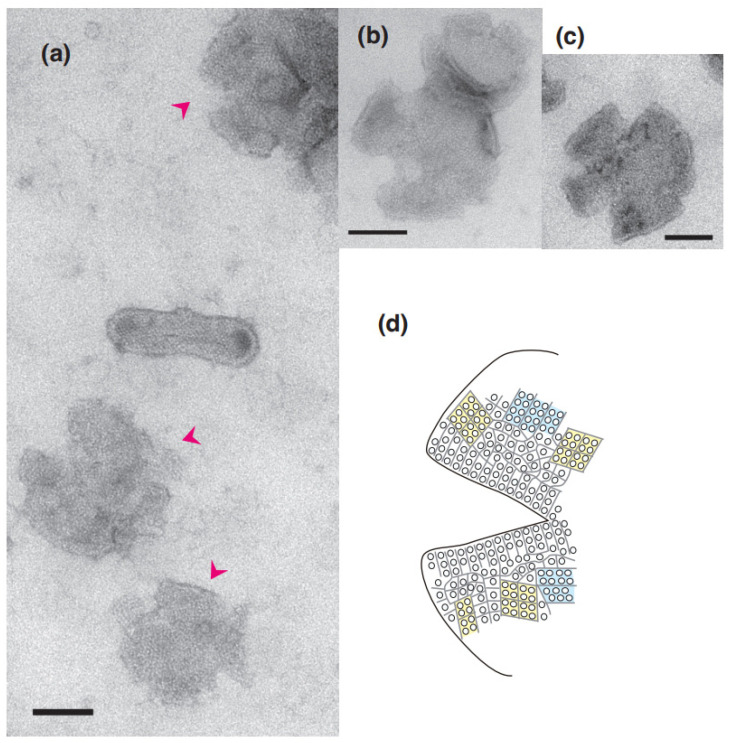
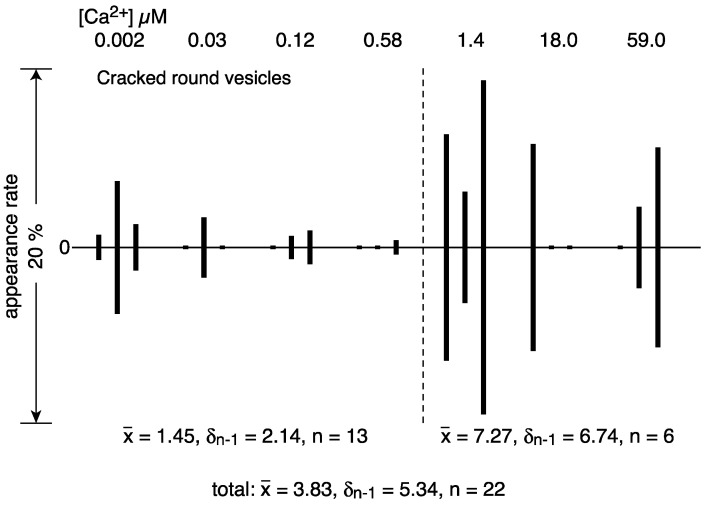
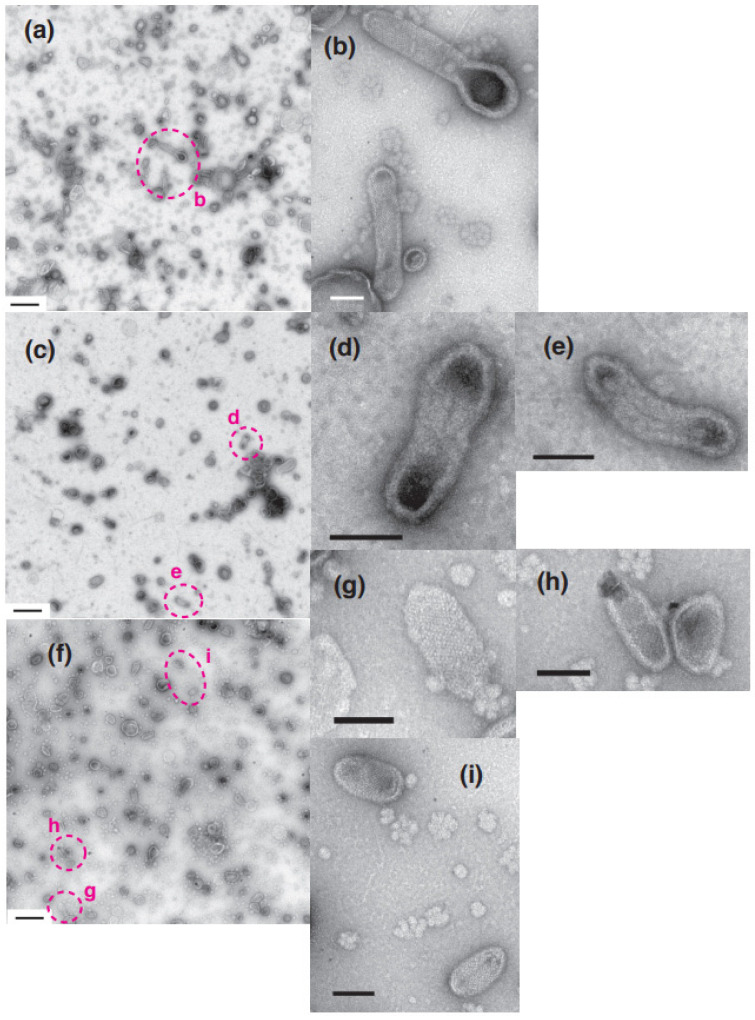
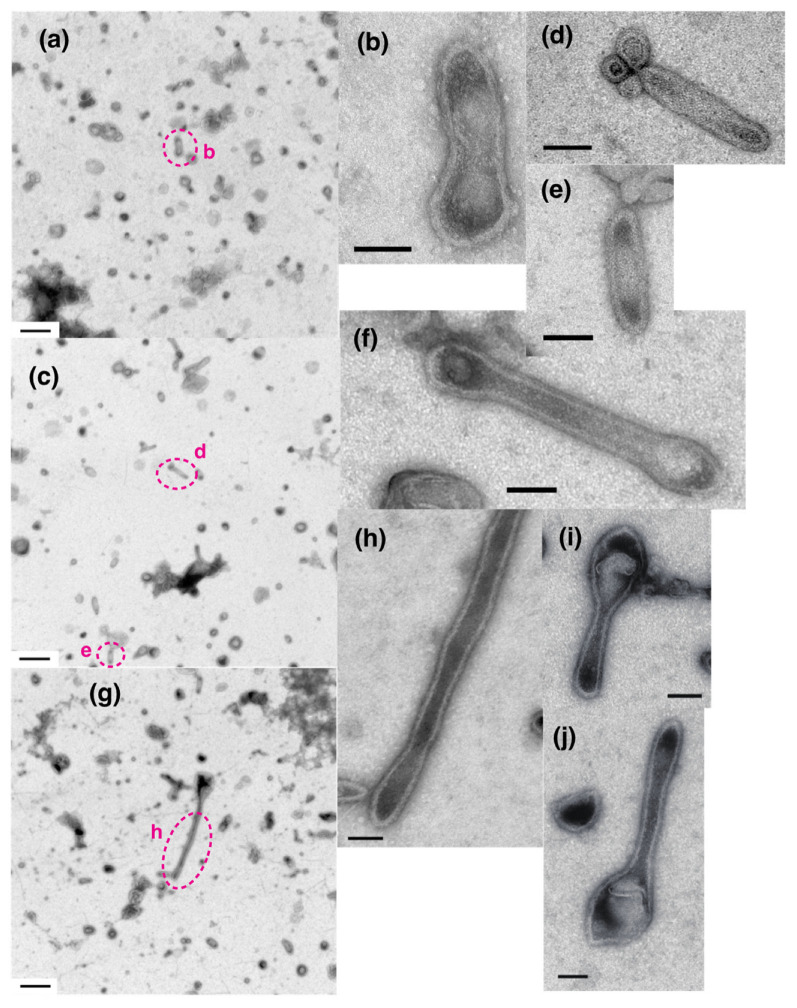
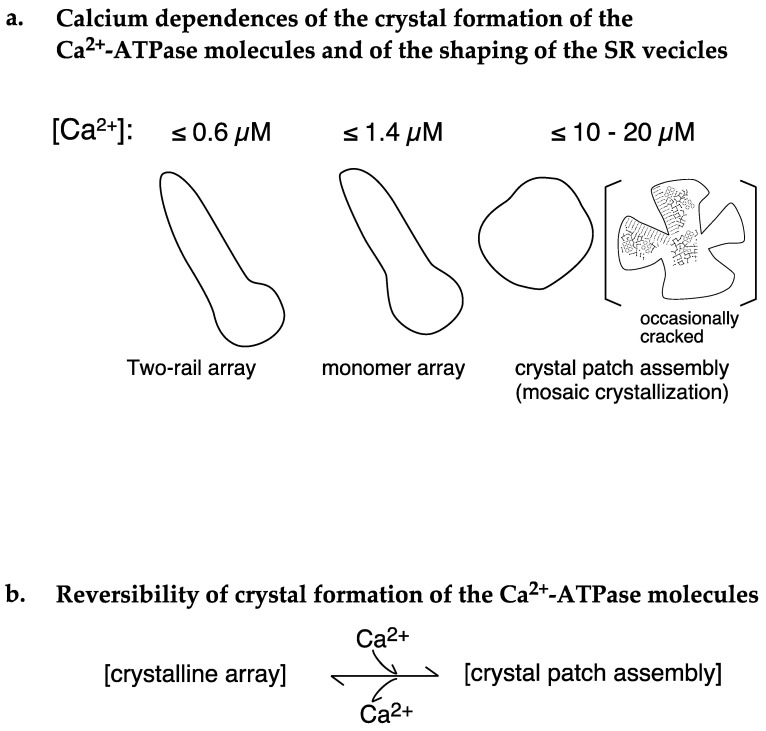
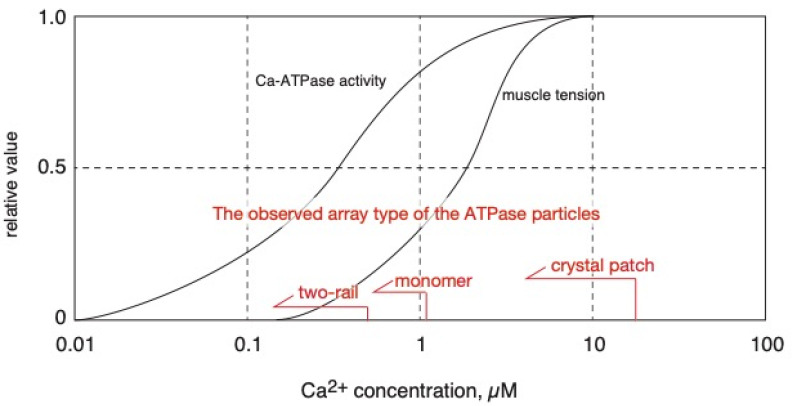
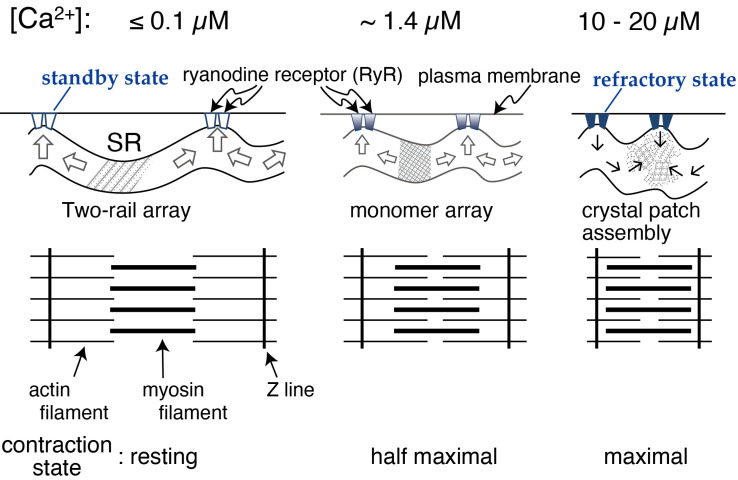
[Ca2+]-dependent crystallization of the Ca2+-ATPase molecules in sarcoplasmic reticulum (SR) vesicles isolated from scallop striated muscle elongated the vesicles in the absence of ATP, and ATP stabilized the crystals. Here, to determine the [Ca2+]-dependence of vesicle elongation in the presence of ATP, SR vesicles in various [Ca2+] environments were imaged using negative stain electron microscopy. The images obtained revealed the following phenomena. (i) Crystal-containing elongated vesicles appeared at ≤1.4 µM Ca2+ and almost disappeared at ≥18 µM Ca2+, where ATPase activity reaches its maximum. (ii) At ≥18 µM Ca2+, almost all SR vesicles were in the round form and covered by tightly clustered ATPase crystal patches. (iii) Round vesicles dried on electron microscopy grids occasionally had cracks, probably because surface tension crushed the solid three-dimensional spheres. (iv) [Ca2+]-dependent ATPase crystallization was rapid (<1 min) and reversible. These data prompt the hypothesis that SR vesicles autonomously elongate or contract with the help of a calcium-sensitive ATPase network/endoskeleton and that ATPase crystallization may modulate physical properties of the SR architecture, including the ryanodine receptors that control muscle contraction.

Keywords: Ca2+-ATPase; SR contraction; SR elongation; calcium; cell dynamics; cell morphology; ryanodine receptor; sarcoplasmic reticulum (SR); scallop; transmission microscopy.


Conflict of interest statement

The authors declare no conflict of interest.

Figures

Figure 1
Figure 1
Overview of the appearance rates (%) of various types of SR vesicles relative to the total number of vesicles at ~0.002–59.0 µM Ca2+ in the presence of 5 mM ATP. The vesicle classification in Table 1 was simplified to four types: tightly elongated vesicles with one or more crystalline arrays (yellow), tightly elongated vesicles without crystalline arrays (including vesicles with a crystal patch assembly and/or unclear arrays) (gray), crookedly elongated vesicles (pink) and round vesicles (green).
Figure 2
Figure 2
Typical images of elongated SR vesicles with crystalline dispositions and/or crystal patch assemblies of Ca2+-ATPase molecules in the presence of 5 mM ATP. (ac) Tightly elongated vesicles with a crystalline disposition mainly comprised of two-rail array (marked by arrow). (d,e) Tightly elongated vesicles with crystalline disposition mainly comprised of monomer array. (f) Tightly elongated vesicles with a crystal patch assembly. (g) Crookedly elongated vesicles with a crystal patch assembly marked by arrows. (h) Overview of vesicles within an electron microscopic view of 5.3 µm by 5.3 µm. Some vesicles contain one or more crystalline arrays; aggregated/conglomerated (arrowheads) and aggregated vesicles (arrow) are indicated. (a) is the high magnification image of the vesicle marked with dotted circle in (h); the image has been rotated by 90° in the clockwise direction. Scale bars in (ag): 100 nm. Scale bar in (h): 0.5 µm.
Figure 3
Figure 3
Typical images of the round vesicles with crystalline disposition and crystal patch assembly of Ca2+-ATPase molecules in the presence of 5 mM ATP. (a,b) Round vesicles with crystalline dispositions mainly comprised of two-rail array. (c) Round vesicles with crystalline dispositions mainly comprised of monomer array. (d) Round vesicles with crystal patch assembly. Scale bars: 100 nm.
Figure 4
Figure 4
Calcium dependence of appearance rate of tightly elongated vesicles containing two-rail crystal array (a) and monomer-crystal array (b) in the presence of ATP. Percentages of the number of tightly elongated vesicles with crystalline disposition relative to the total number of vesicles (along the y-axis) were plotted versus calcium concentration (along the x-axis) (see text for details). (a) Elongated vesicles mainly containing two-rail crystalline arrays. (b) Elongated vesicles mainly containing monomer crystalline array.
Figure 5
Figure 5
Calcium dependence of appearance rates of round vesicles in the presence of ATP. (a) Percentages of the number of round vesicles relative to the total number of vesicles are plotted versus calcium concentration (see text for details). Each bar represents the sum of round vesicles with and without clear crystalline array. (b) Round vesicles with two-rail and/or monomer crystalline array.
Figure 6
Figure 6
Cracked round vesicles in the presence of ATP. (a) Cracked vesicles (marked by arrowheads) at ~0.002 µM Ca2+. (b,c) Cracked vesicles at ~1.4 µM Ca2+. (d) Illustration of the ATPase disposition inside the crack. Scale bars: 100 nm.
Figure 7
Figure 7
Calcium dependence of the appearance rate of cracked round vesicles in the presence of ATP. Percentages of the number of cracked round vesicles to the total number of vesicles plotted versus calcium concentration (see text for details).
Figure 8
Figure 8
Effect of [Ca2+] jump-up on SR vesicles in the presence of ATP. SR preparation (0.3 mg protein/mL) was incubated in buffer solution containing ~0.002 µM Ca2+ and 5 mM ATP at 12 °C for 1 min (see “Materials and Methods”). After the incubation, 1/10 volume of water (a,b) or 28.5 (ce) or 20.0 (fi) mM CaCl2 was added to increase the calcium concentration to ~0.002, ~9.8 (in ce) and ~1.1 (in (fi)) µM, respectively; the pH of the buffer solutions of (ce) and (fi) decreased by about 0.2 and 0.1, respectively. The addition of water was carried out as a control for the [Ca2+] jump-up experiments. 1 min after the addition of CaCl2 or water, a part of the incubation mixture was applied to the electron microscopy grid. (b) is the high magnification image of the area (b) in (a). (d,e) are the high magnifications of the area (d,e) in (c). (gi) are the magnifications of the area (gi) in (f). Scales bars in (a,c,f): 0.5 µm. Scale bars in (b,d,e,gi): 100 nm.
Figure 9
Figure 9
SR vesicles after [Ca2+] jump down in the presence of ATP. SR preparation (0.3 mg protein/mL) was incubated in the buffer solution containing ~16.0 µM Ca2+ and 5 mM ATP at 12 °C for 1 min (see “Materials and Methods”). After the incubation, 1/10 volume of water (a,b) or 30.0 mM EGTA (ch) was added to the incubation mixture (250 µL). With the addition of the EGTA, the calcium concentration of the reaction mixture jumped down from ~16.0 to ~0.003 µM. The water addition was carried out as a control of the jump-down experiment. 1 min after the addition of water or EGTA, a part of the incubation mixture was applied to the electron microscopy grid. (b) is a higher magnification image of the dotted circle (b) in (a). The images (ch) (in (g,h) is marked with dotted circle) were obtained from the three different areas (see the footnote in Supplementary Table S2 for details). The images (i,j) were obtained from another jump-down experiment from ~16.0 to ~0.003 µM. Scale bars in (a,c,g): 0.5 µm. Scale bars in (b,df,h): 100 nm.
Figure 10
Figure 10
Schematic representation of Ca2+-ATPase dispositions on SR vesicles at different [Ca2+] in the presence of 5 mM ATP.
Figure 11
Figure 11
Calcium dependences of Ca2+-ATPase activity [2], striated muscle tension development [19] and ATPase disposition (this paper) of scallop in the presence of ATP are schematically represented.
Figure 12
Figure 12
A model linking the transformation of the Ca2+-ATPase crystalline array to the contraction of SR in the scallop muscle cell.

Similar articles

References

    1. Nakamura J., Maruyama Y., Tajima G., Komeiji Y., Suwa M., Sato C. Ca2+-ATPase molecules as a calcium-sensitive membrane-endoskeleton of sarcoplasmic reticulum. Int. J. Mol. Sci. 2021;22:2624. doi: 10.3390/ijms22052624. - DOI - PMC - PubMed
    1. Abe M., Shirakata Y., Sato D., Konishi K., Watanabe T., Nakamura J. Isolation and characteristics of scallop sarcoplasmic reticulum with calcium transport activity. J. Biochem. 1992;112:822–827. doi: 10.1093/oxfordjournals.jbchem.a123983. - DOI - PubMed
    1. Nakamura J., Maruyama Y., Tajima G., Suwa M., Sato C. Elongation and contraction of scallop sarcoplasmic reticulum (SR): ATP stabilizes Ca2+-ATPase crystalline array elongation of SR vesicles. Int. J. Mol. Sci. 2022;23:3311. doi: 10.3390/ijms23063311. - DOI - PMC - PubMed
    1. Sagara Y., Wade J.B., Inesi G. A conformational mechanism for formation of a dead-end complex by the sarcoplasmic reticulum ATPase with thapsigargin. J. Biol. Chem. 1992;267:1286–1292. doi: 10.1016/S0021-9258(18)48427-X. - DOI - PubMed
    1. Sanger J.W., Sanger J.M. Sarcoplasmic reticulum in the adductor muscle of a Bermuda scallop: Comparison of smooth versus cross-striated portions. Biol. Bull. 1985;168:447–460. doi: 10.2307/1541524. - DOI