. 2023 Apr 11;24(8):7082.
doi: 10.3390/ijms24087082.

Energy Metabolism Is Altered in Radioresistant Rectal Cancer

Affiliations

Energy Metabolism Is Altered in Radioresistant Rectal Cancer

Croí E Buckley et al. Int J Mol Sci. .

Abstract

Resistance to neoadjuvant chemoradiation therapy is a significant clinical challenge in the management of rectal cancer. There is an unmet need to identify the underlying mechanisms of treatment resistance to enable the development of biomarkers predictive of response and novel treatment strategies to improve therapeutic response. In this study, an in vitro model of inherently radioresistant rectal cancer was identified and characterized to identify mechanisms underlying radioresistance in rectal cancer. Transcriptomic and functional analysis demonstrated significant alterations in multiple molecular pathways, including the cell cycle, DNA repair efficiency and upregulation of oxidative phosphorylation-related genes in radioresistant SW837 rectal cancer cells. Real-time metabolic profiling demonstrated decreased reliance on glycolysis and enhanced mitochondrial spare respiratory capacity in radioresistant SW837 cells when compared to radiosensitive HCT116 cells. Metabolomic profiling of pre-treatment serum samples from rectal cancer patients (n = 52) identified 16 metabolites significantly associated with subsequent pathological response to neoadjuvant chemoradiation therapy. Thirteen of these metabolites were also significantly associated with overall survival. This study demonstrates, for the first time, a role for metabolic reprograming in the radioresistance of rectal cancer in vitro and highlights a potential role for altered metabolites as novel circulating predictive markers of treatment response in rectal cancer patients.

Keywords: glycolysis; metabolism; metabolites; oxidative phosphorylation; radioresistance; rectal cancer.


Conflict of interest statement

The authors declare no conflict of interest.

Figures

Figure 1
Figure 1
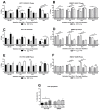
Identification of an in vitro model of inherently radioresistant/radiosensitive CRC. Clonogenic survival of HCT116 and SW837 cells treated with (A) X-ray radiation (2 Gy, 4 Gy or 6 Gy) under normoxia or (B) X-ray radiation (1.8 Gy or 5 Gy) under hypoxia or (C) 5-FU (15 µM, 30 h) or dimethyl sulfoxide (DMSO) vehicle control under normoxic or hypoxic conditions relative to controls, as assessed by the gold-standard clonogenic assay. Data are presented as means ± SEMs for at least three independent experiments. Statistical analysis was performed by t-testing or ANOVA, as appropriate. * p < 0.05, ** p < 0.01, **** p < 0.0001.
Figure 2
Figure 2
Basal proliferation and cell cycle distribution in HCT116 and SW837 cells. (A) Proliferative rates were assessed by BrdU ELISA in HCT116 and SW837 cells. Cell cycle distribution was assessed after 24 h culture under hypoxia (0.5% O2) or normoxia (21% O2). (B) Proportion of HCT116 and SW837 cells in G0/G1 phase under normoxia and hypoxia. (C) Proportion of HCT116 and SW837 cells in S phase under normoxia and hypoxia. (D) Proportion of HCT116 and SW837 cells in G2/M phase under normoxia and hypoxia. Data are presented as means ± SEMs for four independent experiments. Statistical analysis was performed by paired/unpaired t-testing, as appropriate. * p < 0.05, ** p < 0.01, *** p < 0.001, **** p < 0.0001.
Figure 3
Figure 3
Cell cycle distribution and apoptosis following exposure to radiation in HCT116 and SW837 cells. HCT116 and SW837 cells were placed in normoxia or hypoxia for 24 h prior to being mock-irradiated or exposed to 1.8 Gy X-ray radiation. Cell cycle distribution was assessed at 20 min, 6 h, 10 h and 24 h post-radiation by PI staining and flow cytometry. Proportions of (A) HCT116 and (B) SW837 cells in G0/G1 phase following radiation, under normoxia or hypoxia. Proportions of (C) HCT116 and (D) SW837 cells in S phase following radiation, under normoxia or hypoxia. Proportions of (E) HCT116 and (F) SW837 cells in G2/M phase following radiation, under normoxia or hypoxia. (G) The proportions of apoptotic cells among HCT116 and SW837 cells following exposure to 1.8 Gy or 5 Gy radiation were assessed by Annexin V/PI staining and flow cytometry. Data are presented as means ± SEMs for four independent experiments. Statistical analysis was performed by paired ANOVA and post hoc multiple comparison testing. * p < 0.05, ** p < 0.01, *** p < 0.001.
Figure 4
Figure 4
Radiation-induced DNA damage induction and repair in HCT116 and SW837 cells. HCT116 and SW837 cells were irradiated with 1.8 Gy X-ray radiation, and DNA damage was assessed at 20 min, 6 h, 10 h and 24 h post-radiation under normoxia by γH2AX fluorescence and flow cytometry. (A) DNA damage levels in HCT116 cells following radiation, under normoxic conditions, and (B) DNA damage levels in SW837 cells following radiation, under normoxic conditions. HCT116 and SW837 cells were exposed to hypoxia for 24 h prior to irradiation with 1.8 Gy, and DNA damage was assessed at 20 min, 6 h, 10 h and 24 h post-radiation exposure by γH2AX fluorescence and flow cytometry. (C) DNA damage levels in HCT116 following radiation, under hypoxic conditions. (D) DNA damage levels in SW837 cells following radiation, under hypoxic conditions. Data are presented as absolute or relative mean fluorescent intensities (MFIs) ± SEMs for four independent experiments. Statistical analysis was performed by paired t-testing. * p < 0.05, ** p< 0.01.
Figure 5
Figure 5
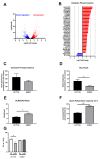
Transcriptomic and metabolic phenotype alterations in radioresistant SW837 cells. (A) Volcano plot demonstrating 2461 genes significantly altered in SW837 cells when compared to HCT116 cells. The y-axis shows the −log10 values (p-adj), and the x-axis shows the log2 values (fold changes). Dots in blue and red represent the significantly downregulated/upregulated genes (2461) in SW837 cells, respectively, when compared to HCT116 cells. Dots in black represent the genes which did not reach statistical significance (p-adj > 0.05). (B) Differentially expressed genes between HCT116 and SW837 cells were analyzed by IPA software, identifying ‘Oxidative Phosphorylation’ as the most significantly upregulated pathway in SW837 cells when compared to HCT116 cells. Live-cell metabolic profiling by Seahorse technology was assessed in SW837 and HCT116 cells, demonstrating (C) oxygen consumption rate, (D) extracellular acidification rate, (E) OCR: ECAR ratio and (F) spare respiratory capacity. (G) HCT116 and SW837 cells were treated with 2-DG (10 mM) or a H2O vehicle control (VC) for 24 h before irradiation with 1.8 Gy. Radiosensitivity was assessed by clonogenic assay. Data are presented as means ± SEMs for at least three independent experiments. Statistical analysis of differential expression of transcriptomic data was performed using the Wald test, with corrections for multiple comparisons performed using Benjamini–Hochberg correction (FDR). Statistical analysis in metabolic functional analyses and clonogenic assays was performed by t-testing. * p < 0.05, ** p < 0.01.
Figure 6
Figure 6
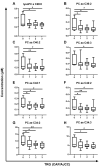
Pre-treatment serum metabolite levels are significantly altered across TRG in rectal cancer patients. Metabolite levels in pre-treatment sera from rectal adenocarcinoma patients (n = 52) were assessed by liquid chromatography mass spectrometry (LC-MS) and correlated with subsequent pathological response to neoCRT. (A) lysoPC a C28:0, (B) PC aa C36:2, (C) PC aa C40:2, (D) PC aa C40:3, (E) PC aa C42:1, (F) PC aa C42:2, (G) PC ae C34:2 and (H) PC ae C34:3 levels were significantly decreased with increasing TRG and worse therapeutic response. TRG 0, n = 4; TRG 1, n = 14; TRG 2, n = 22; TRG 3, n = 12. Data are presented as medians ± minima/maxima. Statistical analysis was performed by post hoc unpaired GLM analysis. * p < 0.05, ** p < 0.01.
Figure 7
Figure 7
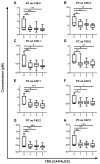
Pre-treatment serum metabolite levels were significantly altered across TRG in rectal cancer patients. Metabolite levels in pre-treatment sera from rectal adenocarcinoma patients (n = 52) were assessed by liquid chromatography mass spectrometry (LC-MS) and correlated with subsequent pathological response to neoCRT. (A) PC ae C36:0, (B) PC ae C36:3, (C) PC ae C38:1, (D) PC ae C38:2, (E) PC ae C40:1, (F) PC ae C40:3, (G) PC ae C42:2 and (H) PC ae C42:2 levels were significantly decreased with increasing TRG and worse therapeutic response. TRG 0, n = 4; TRG 1, n = 14; TRG 2, n = 22; TRG 3, n = 12. Data are presented as medians ± minima/maxima. Statistical analysis was performed by post hoc unpaired GLM analysis. * p < 0.05, ** p < 0.01, *** p < 0.001.

Similar articles

Cited by

References

    1. Sung H., Ferlay J., Siegel R.L., Laversanne M., Soerjomataram I., Jemal A., Bray F. Global Cancer Statistics 2020: GLOBOCAN Estimates of Incidence and Mortality Worldwide for 36 Cancers in 185 Countries. CA Cancer J. Clin. 2021;71:209–249. doi: 10.3322/caac.21660. - DOI - PubMed
    1. National Cancer Registry Ireland (NCRI) Cancer Incidence Projections for Ireland 2020–2045. National Cancer Registry; Cork, Ireland: 2019.
    1. McCarthy K., Pearson K., Fulton R., Hewitt J. Pre-operative chemoradiation for non-metastatic locally advanced rectal cancer. Cochrane Database Syst. Rev. 2012;12:Cd008368. doi: 10.1002/14651858.CD008368.pub2. - DOI - PMC - PubMed
    1. Glynne-Jones R., Wyrwicz L., Tiret E., Brown G., Rödel C.D., Cervantes A., Arnold D. Rectal cancer: ESMO Clinical Practice Guidelines for diagnosis, treatment and follow-up. Ann. Oncol. 2017;28((Suppl. S4)):iv22–iv40. doi: 10.1093/annonc/mdx224. - DOI - PubMed
    1. Ferrari L., Fichera A. Neoadjuvant chemoradiation therapy and pathological complete response in rectal cancer. Gastroenterol. Rep. 2015;3:277–288. doi: 10.1093/gastro/gov039. - DOI - PMC - PubMed

LinkOut - more resources