. 2023 Apr 12;24(8):7106.
doi: 10.3390/ijms24087106.

The Duration of Oxygen and Glucose Deprivation (OGD) Determines the Effects of Subsequent Reperfusion on Rat Pheochromocytoma (PC12) Cells and Primary Cortical Neurons

Affiliations

The Duration of Oxygen and Glucose Deprivation (OGD) Determines the Effects of Subsequent Reperfusion on Rat Pheochromocytoma (PC12) Cells and Primary Cortical Neurons

Ayesha Singh et al. Int J Mol Sci. .

Abstract

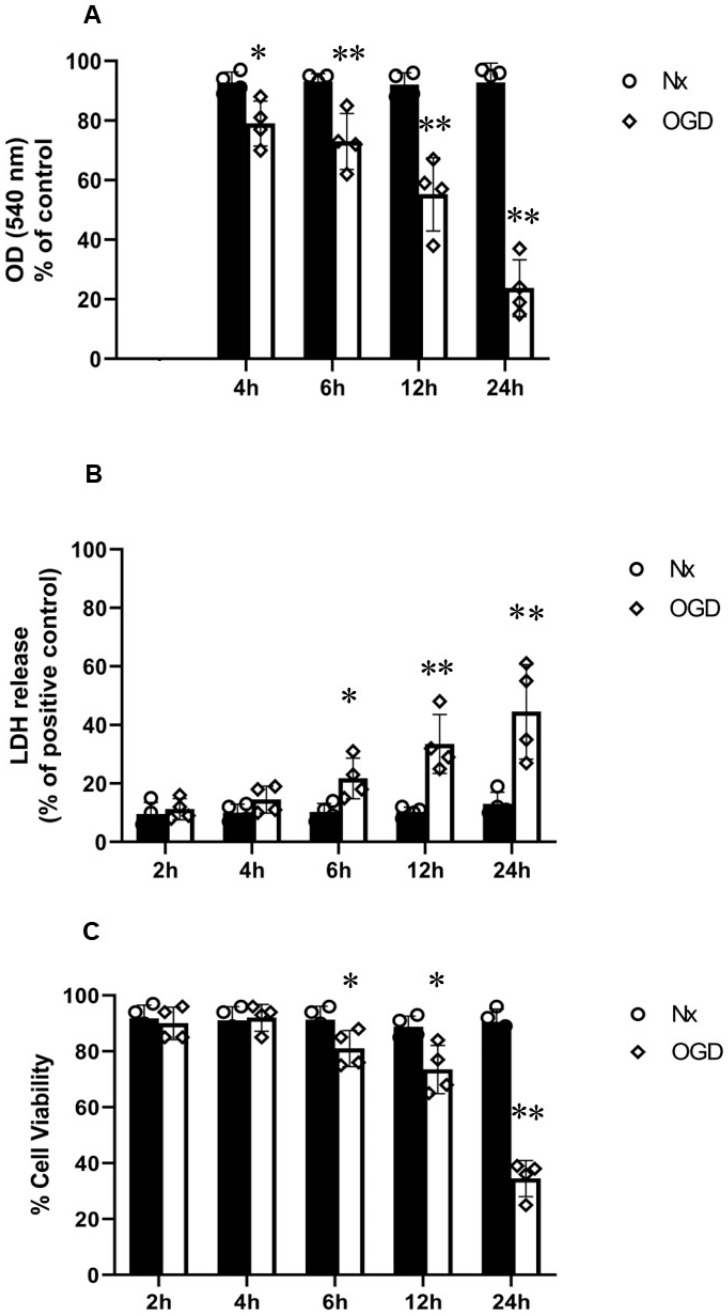
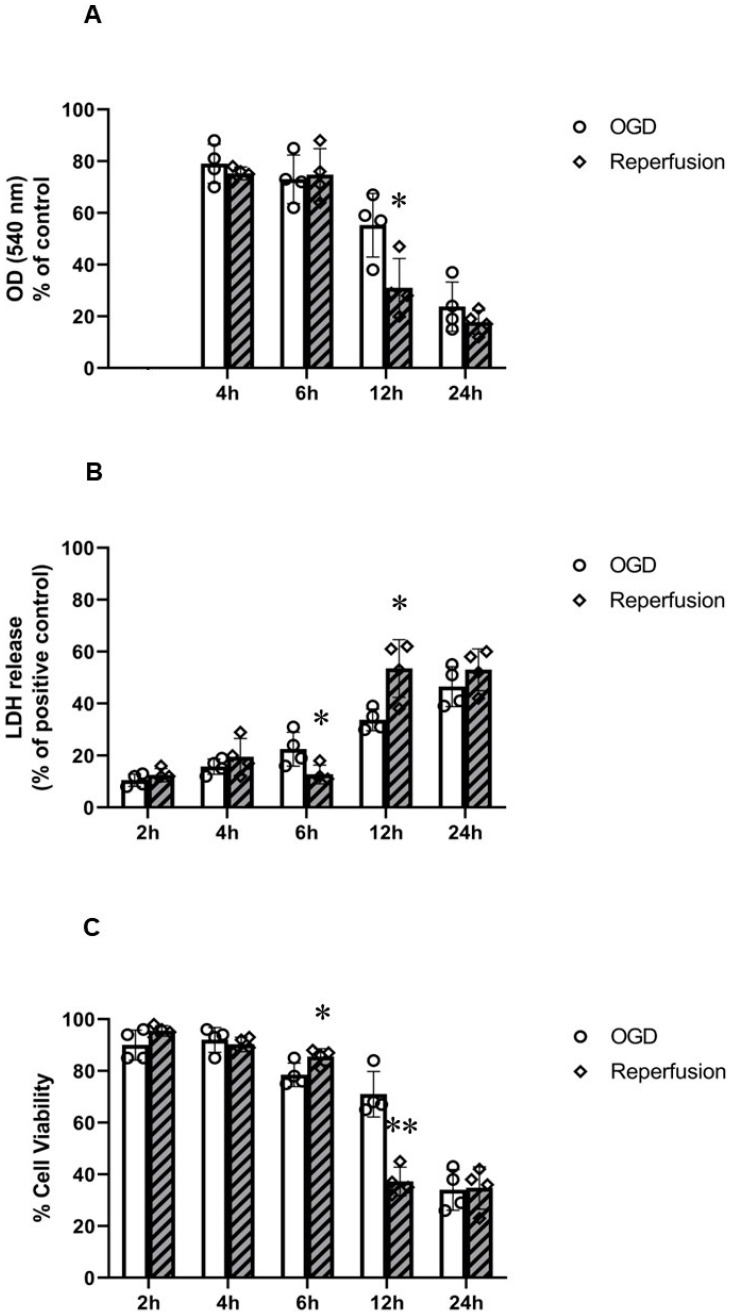
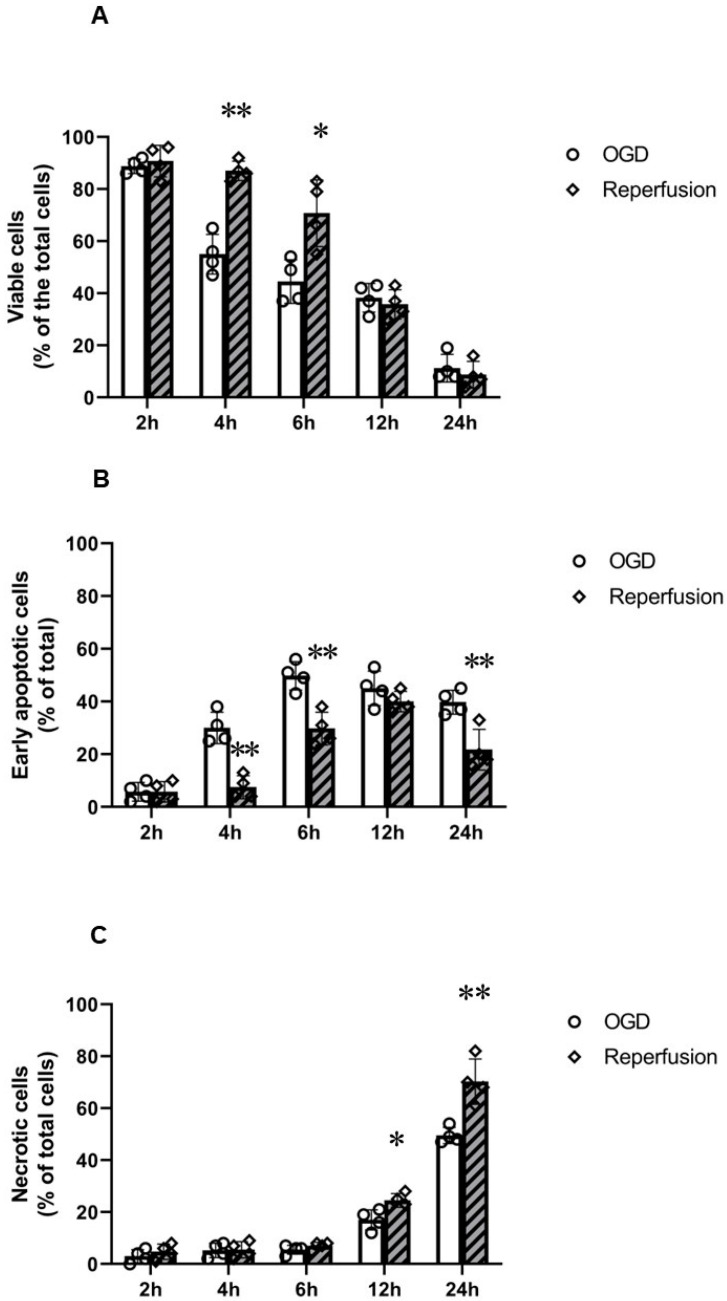
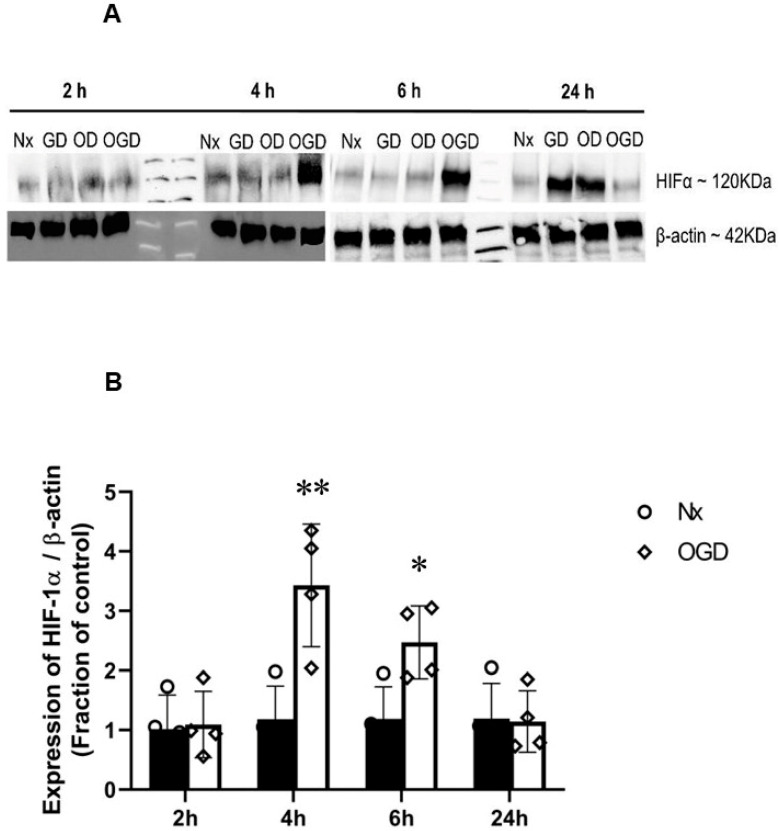
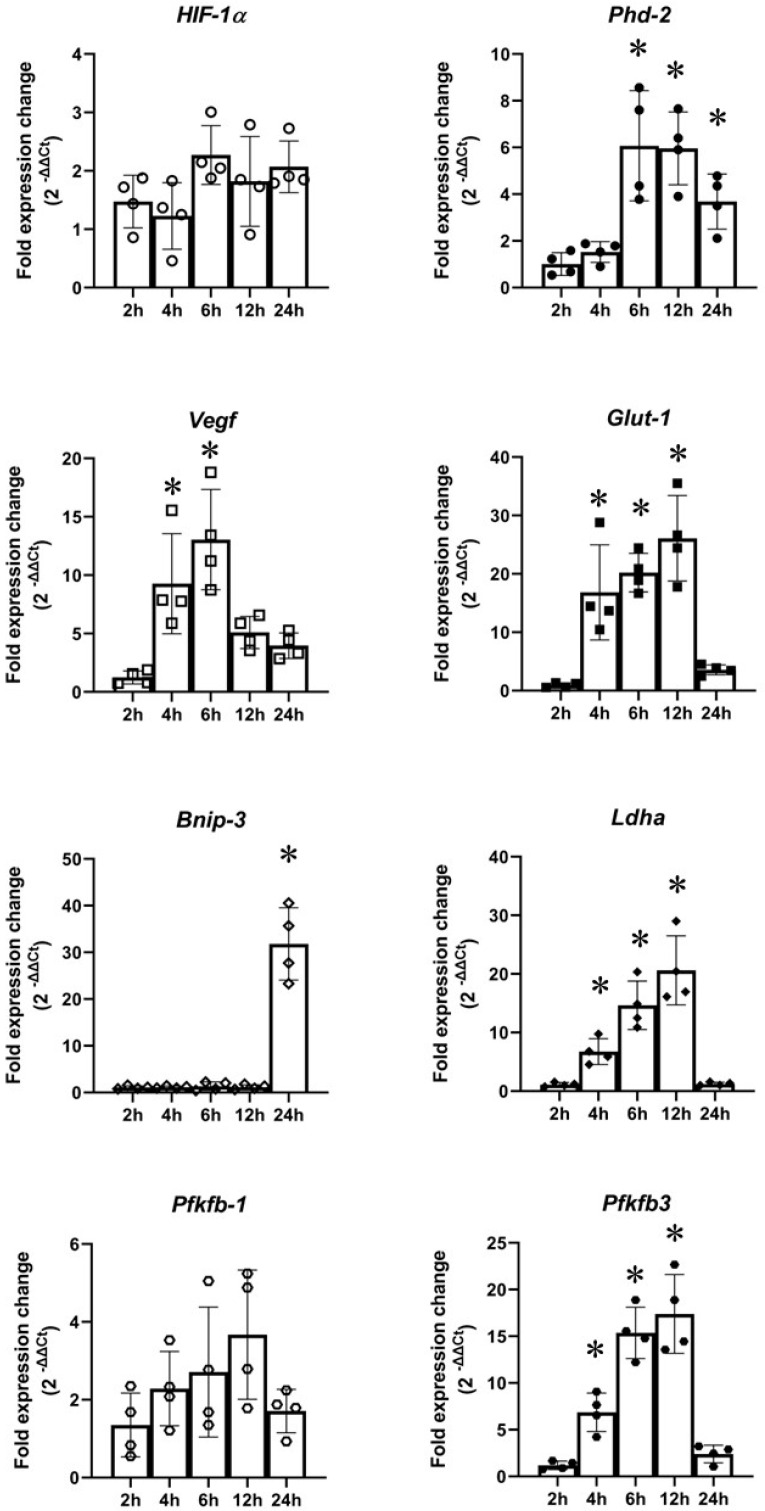
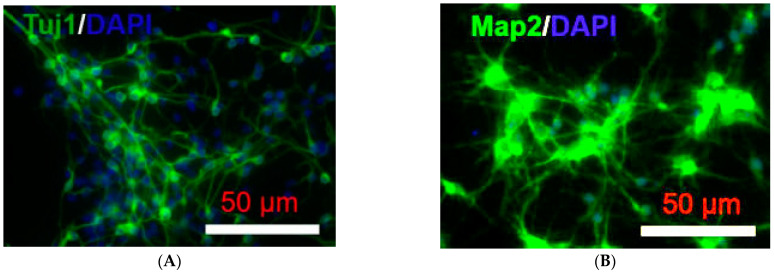
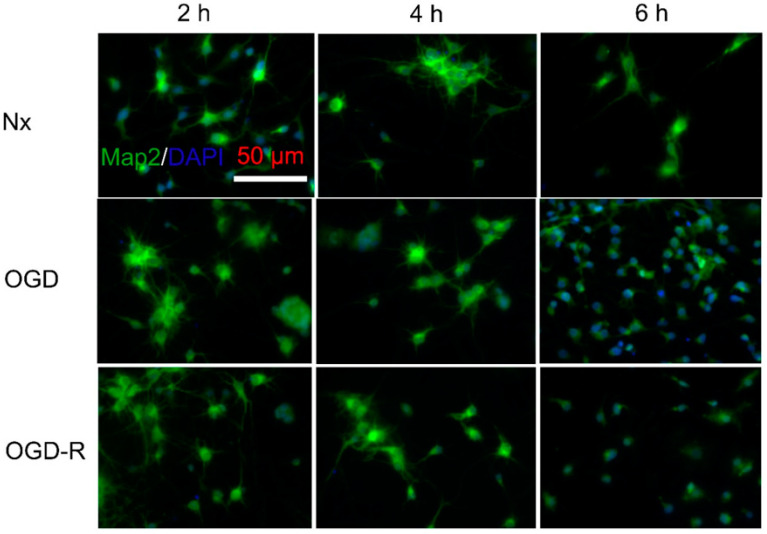
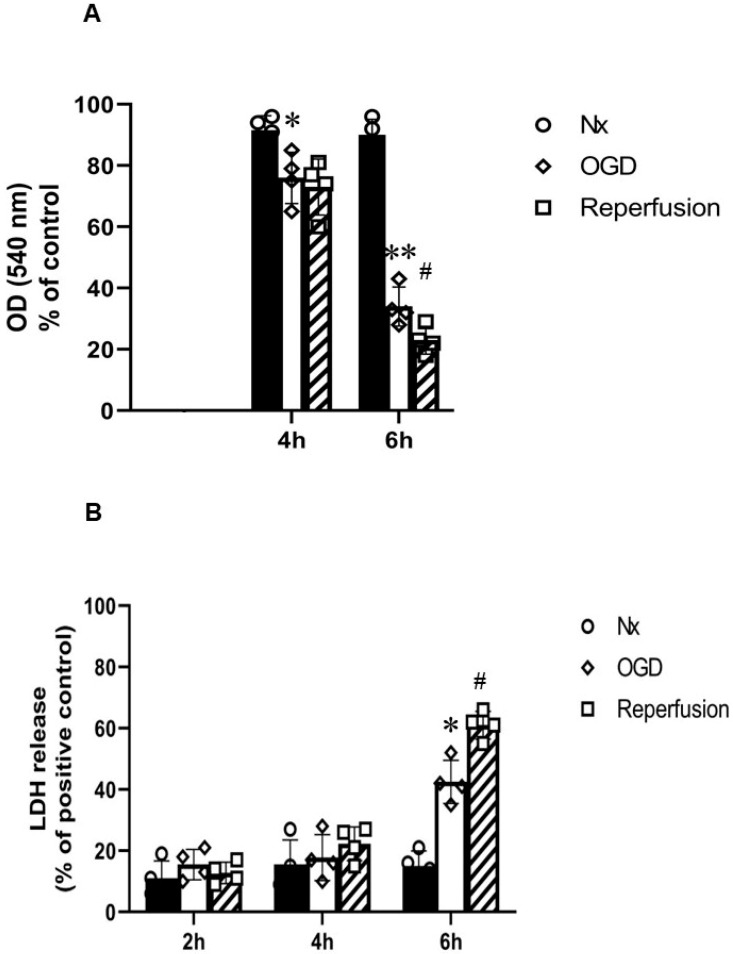
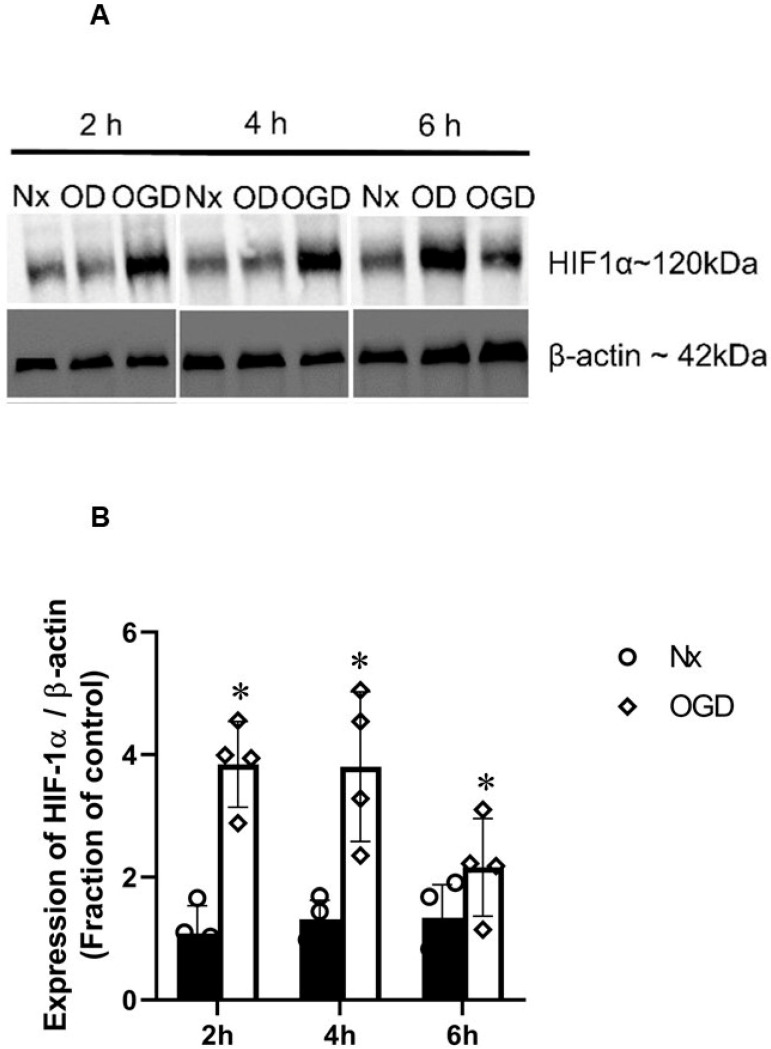
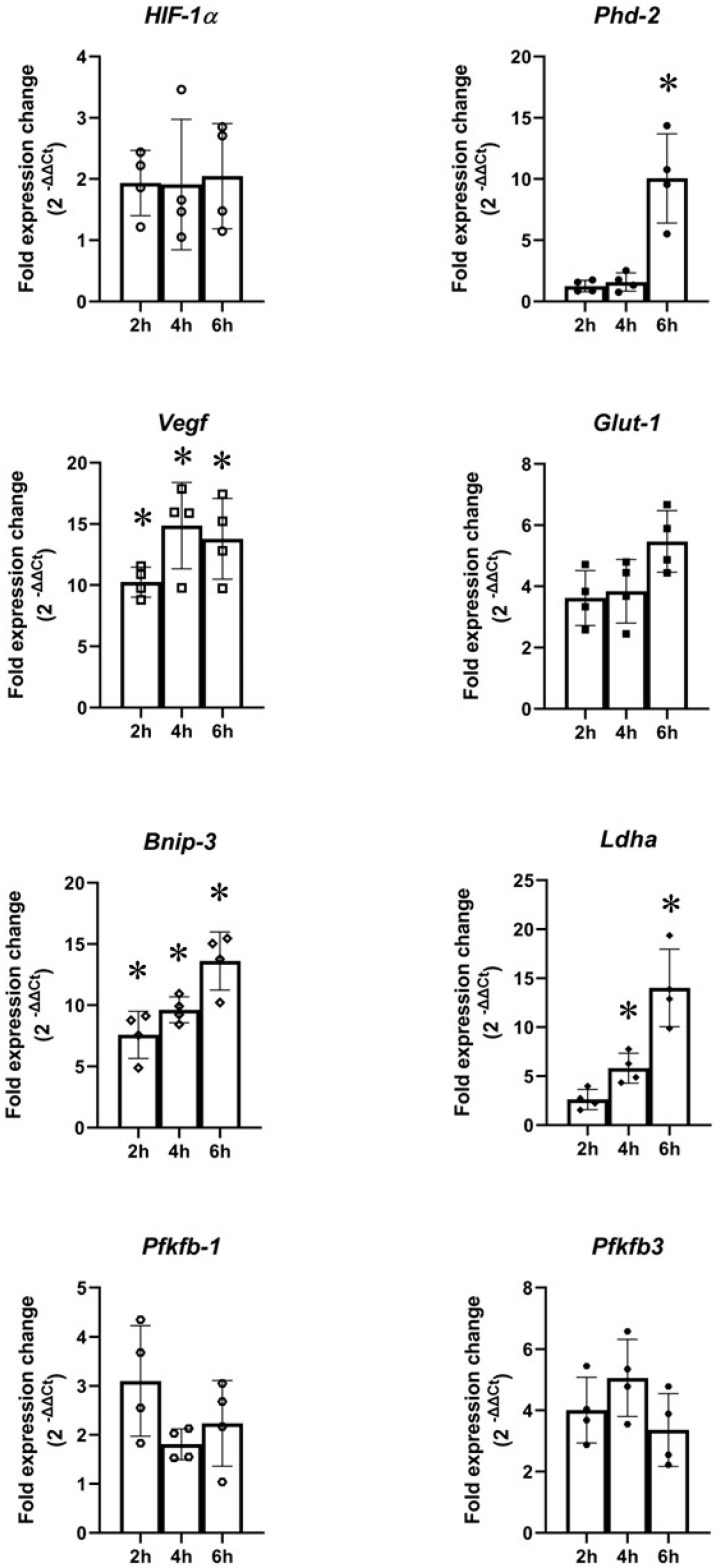
Reperfusion is the fundamental treatment for ischaemic stroke; however, many ischaemic stroke patients cannot undergo reperfusion treatment. Furthermore, reperfusion can cause ischaemic reperfusion injuries. This study aimed to determine the effects of reperfusion in an in vitro ischaemic stroke model-oxygen and glucose deprivation (OGD) (0.3% O2)-with rat pheochromocytoma (PC12) cells and cortical neurons. In PC12 cells, OGD resulted in a time-dependent increase in cytotoxicity and apoptosis, and reduction in MTT activity from 2 h onwards. Reperfusion following shorter periods (4 and 6 h) of OGD recovered apoptotic PC12 cells, whereas after 12 h, OGD increased LDH release. In primary neurons, 6 h OGD led to significant increase in cytotoxicity, reduction in MTT activity and dendritic MAP2 staining. Reperfusion following 6 h OGD increased the cytotoxicity. HIF-1a was stabilised by 4 and 6 h OGD in PC12 cells and 2 h OGD onwards in primary neurons. A panel of hypoxic genes were upregulated by the OGD treatments depending on the duration. In conclusion, the duration of OGD determines the mitochondrial activity, cell viability, HIF-1a stabilization, and hypoxic gene expression in both cell types. Reperfusion following OGD of short duration is neuroprotective, whereas OGD of long duration is cytotoxic.

Keywords: HIF; OGD; PC12 cell; duration; neuron; rat; reperfusion.


Conflict of interest statement

The authors declare no competing interests.

Figures

Figure 1
Figure 1
PC12 cells in normoxia (Nx) and subjected to oxygen–glucose deprivation (OGD). (A) MTT assay (n = 4) showed a significant reduction in MTT activity over time in cells subjected to OGD; (B) LDH assay (n = 4) showed a significant increase in LDH release in cells subjected to OGD from 6 h OGD onwards; (C) trypan blue exclusion assay (n = 4) showed a significant reduction in % of live cells from 6 h OGD onwards. Error bars represent ± S.D. * Indicates p < 0.05, ** p < 0.01, compared to Nx controls.
Figure 2
Figure 2
Effects of 24 h reperfusion on PC12 cells following oxygen–glucose deprivation (OGD). (A) MTT assay (n = 4) showed a significant reduction in MTT activity after 24 h reperfusion in cells previously exposed to 12 h OGD; (B) LDH assay (n = 4) showed an increase in LDH release in cells pre-exposed to 12 h OGD, but reduced LDH release in cells pre-exposed to 6 h OGD; (C) trypan blue assay (n = 4) showed a significant reduction in % of live cells in cells pre-exposed to 12 h OGD. Greater viability was seen in cells pre-exposed to 6 h OGD. Error bars represent ± S.D. * Indicates p < 0.05, ** p < 0.01, for comparison of the treatments of OGD and reperfusion.
Figure 3
Figure 3
Annexin-V and 7-AAD FACS analysis of PC12 cells following oxygen–glucose deprivation (OGD) before and after 24 h reperfusion. (A) Graph of group data (n = 4) representing % of live cells (AV/7-AAD); 24 h reperfusion increased % live cells after 4 and 6 h OGD. (B) Graph of group data (n = 4) representing % of early apoptotic cells (AV+/7-AAD); 24 h reperfusion reduced % of early apoptotic cells after 4 and 6 h OGD but increased % of early apoptotic cells after 24 h OGD. (C) Graph of group data (n = 4) representing % of late apoptotic or necrotic cells (AV+/7-AAD+); 24 h reperfusion increased % of late apoptotic or necrotic cells after 12 and 24 h OGD. Error bars represent ± S.D. * Indicates p < 0.05, ** p < 0.01, for comparison of the treatments of OGD and reperfusion.
Figure 4
Figure 4
HIF-1α protein stabilisation by oxygen–glucose deprivation (OGD) in PC12 cells. (A) Representative Western blots of HIF-1α and corresponding β-actin of cells exposed to 2, 4, 6, and 24 h of OGD. The protein levels were quantified by densitometric analysis using Image J. Values were normalised to β-actin and corresponding Nx control (Figure S1). (B) Graph (n = 4) showing the normalised HIF-1α level measured after 2, 4, 6, and 24 h OGD. There were significantly higher HIF-1α/β-actin ratios with OGD (4 and 6 h) treatments compared to Nx controls. Error bars represent ± S.D. * Indicates p < 0.05, ** p < 0.05, against Nx controls.
Figure 5
Figure 5
Gene expression in PC12 cells subjected to oxygen–glucose deprivation (OGD). There were no changes in Hif1α and Pfkfb1 expression. There were significant increases in Phd2 expression from 6 h OGD onwards; significant changes in Vegf expression in cells subjected to 4 and 6 h OGD; significant changes in Glut1 expression in cells exposed to 4, 6, and 12 h OGD; significant changes in Bnip3 gene expression in cells exposed to 24 h OGD; significant upregulation of Ldha in cells subjected to 4, 6, and 12 h OGD; significant upregulation of Pfkfb3 in cells subjected to 4, 6, and 12 h OGD. The gene expression was measured against housekeeping gene β-actin. Error bars represent ± S.D. n = 4. * Indicates p < 0.05 against normoxia controls.
Figure 6
Figure 6
Immunofluorescence images of primary rat cortical neurons. (A) Representative double merged (FITC-labelled Tuj1 immunofluorescence (green) and DAPI-stained nuclei) of primary rat cortical neuron culture. The healthy neurons showed various long axons; (B) Representative double merged (FITC-labelled MAP2 immunofluorescence (green) and DAPI-stained nuclei) of primary rat cortical neuron culture. The healthy neurons showed numerous dendrites.
Figure 7
Figure 7
Immunofluorescence images (with MAP2) of primary cortical neurons subjected to oxygen–glucose deprivation (OGD) before and after reperfusion by. Representative double merged (FITC-labelled MAP2 immunofluorescence (green) and DAPI-stained nuclei) revealed control neuron with numerous dendrites; similar neurons were in neurons subjected to 2 and 4 h OGD before and after 24 h reperfusion. Neurons subjected to 6 h OGD, however, displayed neurons without dendrites; and reduced nuclei/microscopic field was found following 24 h reperfusion.
Figure 8
Figure 8
Primary rat cortical neurons in normoxia (Nx) and subjected to oxygen–glucose deprivation (OGD) before and after reperfusion. (A) MTT assay (n = 4) showed significant reduction in MTT activity over time in primary neurons subjected to 4 and 6 h OGD. A further reduction in MTT activity was found with 24 h reperfusion after 6 h OGD; (B) LDH assay (n = 4) showed significant increase in LDH release at 6 h OGD, and a further significant increase in LDH release after 24 h reperfusion. Error bars represent ± S.D. * Indicates p < 0.05, ** p < 0.01, against Nx controls; # indicates p < 0.05 for comparison of the treatments of OGD and reperfusion.
Figure 9
Figure 9
HIF-1α protein stabilisation by oxygen–glucose deprivation (OGD) in primary rat cortical neurons. (A) Representative Western blots of HIF-1α and corresponding β-actin of cells exposed to 2, 4, and 6 h of OGD. The protein levels were quantified by densitometric analysis using Image J. Values were normalised to β-actin and corresponding Nx control (Figure S2). (B) Graph (n = 4) showed the normalised HIF-1α level measured after 2, 4, and 6 h OGD. There was significant higher HIF-1α/β-actin ratios by OGD (2, 4 and 6 h) treatments compared to Nx controls. Error bars represent ± S.D. * Indicates p < 0.05 against Nx controls.
Figure 10
Figure 10
Gene expression in primary rat cortical neurons subjected to oxygen–glucose deprivation (OGD). There were no changes in Hif1α, Glut1, Pfkfb1, or Pfkfb3. There were significant increases in Phd2 expression by 6 h OGD; significant changes in Vegf expression in cells subjected to 2, 4, and 6 h OGD; significant changes in Bnip3 expression in cells exposed to 2, 4, and 6 h OGD; significant upregulation of Ldha in cells subjected to 4 and 6 h. The gene expression was measured against housekeeping gene β-actin. Error bars represent ± S.D. n = 4. * Indicates p < 0.05 against normoxia controls.

Similar articles

Cited by

References

    1. Ermine C.M., Bivard A., Parsons M.W., Baron J.-C. The ischemic penumbra: From concept to reality. Int. J. Stroke. 2021;16:497–509. doi: 10.1177/1747493020975229. - DOI - PubMed
    1. Chen R., Lai U.H., Zhu L., Singh A., Ahmed M., Forsyth N.R. Reactive Oxygen Species Formation in the Brain at Different Oxygen Levels: The Role of Hypoxia Inducible Factors. Front. Cell Dev. Biol. 2018;6:132. doi: 10.3389/fcell.2018.00132. - DOI - PMC - PubMed
    1. Chia N.H., Leyden J.M., Newbury J., Jannes J., Kleinig T.J. Determining the Number of Ischemic Strokes Potentially Eligible for Endovascular Thrombectomy: A Population-Based Study. Stroke. 2016;47:1377–1380. doi: 10.1161/STROKEAHA.116.013165. - DOI - PubMed
    1. Tsivgoulis G., Katsanos A.H., Sandset E.C., Turc G., Nguyen T.N., Bivard A., Fischer U., Khatri P. Thrombolysis for acute ischaemic stroke: Current status and future perspectives. Lancet Neurol. 2023 doi: 10.1016/S1474-4422(22)00519-1. - DOI - PubMed
    1. Lee N.T., Selan C., Chia J.S.J., Sturgeon S.A., Wright D.K., Zamani A., Pereira M., Nandurkar H.H., Sashindranath M. Characterization of a novel model of global forebrain ischaemia–reperfusion injury in mice and comparison with focal ischaemic and haemorrhagic stroke. Sci. Rep. 2020;10:18170. doi: 10.1038/s41598-020-75034-4. - DOI - PMC - PubMed