

Strategy for Pre-Clinical Development of Active Targeting MicroRNA Oligonucleotide Therapeutics for Unmet Medical Needs
- PMID: 37108289
- PMCID: PMC10138879
- DOI: 10.3390/ijms24087126
Strategy for Pre-Clinical Development of Active Targeting MicroRNA Oligonucleotide Therapeutics for Unmet Medical Needs
Abstract
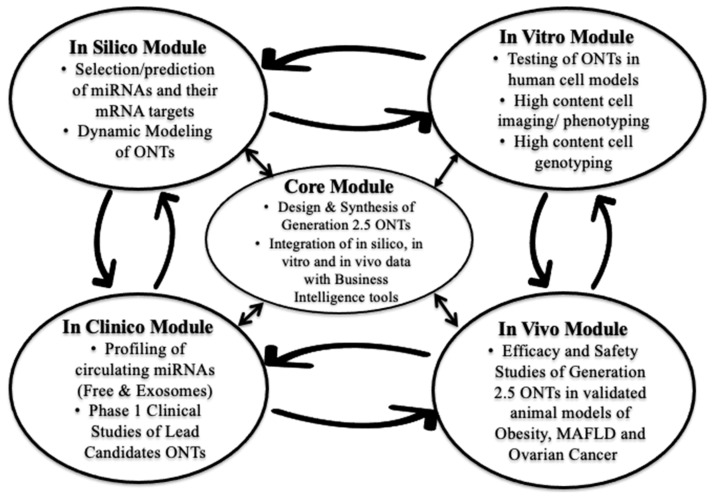
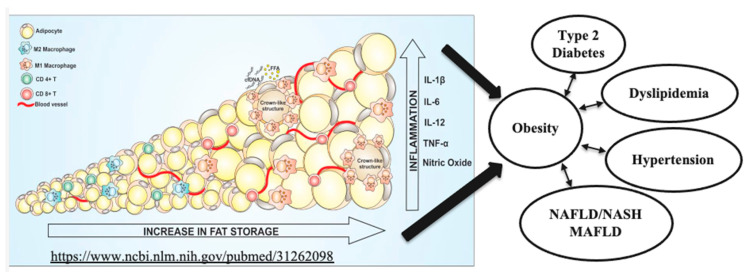
We present here an innovative modular and outsourced model of drug research and development for microRNA oligonucleotide therapeutics (miRNA ONTs). This model is being implemented by a biotechnology company, namely AptamiR Therapeutics, in collaboration with Centers of Excellence in Academic Institutions. Our aim is to develop safe, effective and convenient active targeting miRNA ONT agents for the metabolic pandemic of obesity and metabolic-associated fatty liver disease (MAFLD), as well as deadly ovarian cancer.
Keywords: MAFLD; active targeted delivery; diabetes; microRNAs; obesity; oligonucleotide therapeutics; ovarian cancer.
Conflict of interest statement
The authors declare no conflict of interest. Thibonnier was involved in the design of study protocols, analyses and interpretation of data, the writing of the manuscript and the decision to publish the results. Marc Thibonnier is the founder and a shareholder of AptamiR Therapeutics, Inc.
Figures
Similar articles
-
Liver as a target for oligonucleotide therapeutics.J Hepatol. 2013 Dec;59(6):1354-9. doi: 10.1016/j.jhep.2013.05.045. Epub 2013 Jun 12. J Hepatol. 2013. PMID: 23770039
-
Engineered microRNA therapeutics.J R Coll Physicians Edinb. 2014;44(3):196-200. doi: 10.4997/JRCPE.2014.302. J R Coll Physicians Edinb. 2014. PMID: 25318394 Review.
-
MicroRNAs in non-alcoholic fatty liver disease: Progress and perspectives.Mol Metab. 2022 Nov;65:101581. doi: 10.1016/j.molmet.2022.101581. Epub 2022 Aug 23. Mol Metab. 2022. PMID: 36028120 Free PMC article. Review.
-
Considerations of the Japanese Research Working Group for the ICH S6 & Related Issues Regarding Nonclinical Safety Assessments of Oligonucleotide Therapeutics: Comparison with Those of Biopharmaceuticals.Nucleic Acid Ther. 2021 Apr;31(2):114-125. doi: 10.1089/nat.2020.0879. Epub 2021 Jan 19. Nucleic Acid Ther. 2021. PMID: 33470890 Free PMC article.
-
Leveraging microphysiological systems to address challenges encountered during development of oligonucleotide therapeutics.ALTEX. 2022;39(2):273–296. doi: 10.14573/altex.2108241. Epub 2021 Nov 11. ALTEX. 2022. PMID: 34766620 Review.
Cited by
-
MicroRNA-218-5p accelerates malignant behaviors of breast cancer through LRIG1.Clinics (Sao Paulo). 2023 Oct 28;78:100302. doi: 10.1016/j.clinsp.2023.100302. eCollection 2024. Clinics (Sao Paulo). 2023. PMID: 39491279 Free PMC article.
-
The Role of MicroRNA in the Pathogenesis of Acute Kidney Injury.Cells. 2024 Sep 16;13(18):1559. doi: 10.3390/cells13181559. Cells. 2024. PMID: 39329743 Free PMC article. Review.
-
Review of the Different Outcomes Produced by Genetic Knock Out of the Long Non-coding microRNA-host-gene MIR22HG versus Pharmacologic Antagonism of its Intragenic microRNA product miR-22-3p.Microrna. 2025;14(1):19-41. doi: 10.2174/0122115366282339240604042154. Microrna. 2025. PMID: 38952162 Review.
-
Recent Advances in miRNA-Based Therapy for MASLD/MASH and MASH-Associated HCC.Int J Mol Sci. 2024 Nov 14;25(22):12229. doi: 10.3390/ijms252212229. Int J Mol Sci. 2024. PMID: 39596297 Free PMC article. Review.
-
The use of circulating miRNAs for the diagnosis, prognosis, and personalized treatment of MASLD.J Physiol Biochem. 2025 Aug;81(3):589-609. doi: 10.1007/s13105-025-01110-w. Epub 2025 Jul 16. J Physiol Biochem. 2025. PMID: 40668532 Free PMC article. Review.
References
MeSH terms
Substances
LinkOut - more resources
Full Text Sources
Other Literature Sources
Medical
