. 2023 Apr 13;24(8):7219.
doi: 10.3390/ijms24087219.

Lipid-Independent Regulation of PLIN5 via IL-6 through the JAK/STAT3 Axis in Hep3B Cells

Affiliations

Lipid-Independent Regulation of PLIN5 via IL-6 through the JAK/STAT3 Axis in Hep3B Cells

Marinela Krizanac et al. Int J Mol Sci. .

Abstract

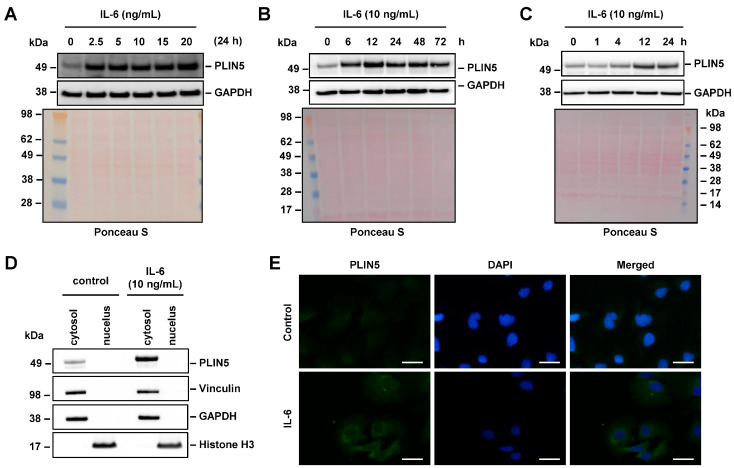
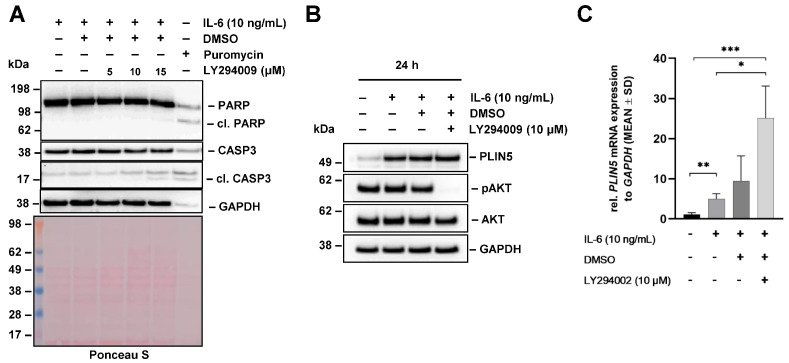
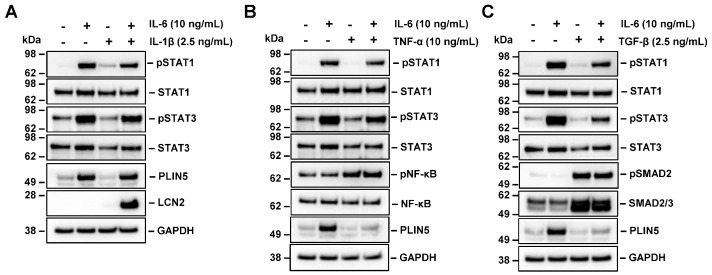
Perilipin 5 (PLIN5) is a lipid droplet coat protein that is highly expressed in oxidative tissues such as those of muscles, the heart and the liver. PLIN5 expression is regulated by a family of peroxisome proliferator-activated receptors (PPARs) and modulated by the cellular lipid status. So far, research has focused on the role of PLIN5 in the context of non-alcoholic fatty liver disease (NAFLD) and specifically in lipid droplet formation and lipolysis, where PLIN5 serves as a regulator of lipid metabolism. In addition, there are only limited studies connecting PLIN5 to hepatocellular carcinoma (HCC), where PLIN5 expression is proven to be upregulated in hepatic tissue. Considering that HCC development is highly driven by cytokines present throughout NAFLD development and in the tumor microenvironment, we here explore the possible regulation of PLIN5 by cytokines known to be involved in HCC and NAFLD progression. We demonstrate that PLIN5 expression is strongly induced by interleukin-6 (IL-6) in a dose- and time-dependent manner in Hep3B cells. Moreover, IL-6-dependent PLIN5 upregulation is mediated by the JAK/STAT3 signaling pathway, which can be blocked by transforming growth factor-β (TGF-β) and tumor necrosis factor-α (TNF-α). Furthermore, IL-6-mediated PLIN5 upregulation changes when IL-6 trans-signaling is stimulated through the addition of soluble IL-6R. In sum, this study sheds light on lipid-independent regulation of PLIN5 expression in the liver, making PLIN5 a crucial target for NAFLD-induced HCC.

Keywords: HCC; IL-6; JAK/STAT3; NAFLD; NASH; cytokines; fat metabolism; perilipin; transforming growth factor-β; tumor necrosis factor-α.


Conflict of interest statement

The authors declare no conflict of interest.

Figures

Figure 1
Figure 1
Differential cytokine regulation of PLIN5 expression in Hep3B cells. Hep3B cells were stimulated with the indicated concentrations of different cytokines and combinations thereof for 24 h. (A) Representative Western blot demonstrating induction of PLIN5 protein expression by IL-6 in Hep3B cells. GAPDH expression and Ponceau S staining served as controls to demonstrate equal protein loading. (B) Relative mRNA expression of PLIN5 in Hep3B cells after stimulation with IL-6 (10 ng/mL) for 24 h provoked significant upregulation of PLIN5 mRNA. (C) Western blot analysis of PLIN5 protein expression after stimulation with indicated cytokines and combinations thereof. (D) Relative PLIN5 mRNA expression in Hep3B cells after stimulation with indicated cytokines and their combination for 24 h revealing that IL-6-mediated PLIN5 upregulation is prevented by TNF-α and TGF-β, but not IL-1β. Data from RT-qPCR are shown as mean ± SD of three independent experiments performed in triplicate and measured in duplicate. Significant differences between the groups are indicated by asterisks (*** p < 0.001).
Figure 2
Figure 2
Basal expression of PLIN5, IL-6R, and sIL-6R after IL-6 stimulation in liver cancer cell lines. (A) Western blot of PLIN5 protein (left) and relative mRNA expression (right) in Hep3B, Huh7 and HepG2 cells reveal differences in PLIN5 expression between the different cell lines. (B) Western blot analysis of IL-6R and sIL-6R expression in cell extracts (left) and supernatants (middle) of Hep3B, Huh7 and HepG2 cells. In addition, the relative mRNA expression of IL-6RA in the three cell lines is depicted (right). Representative Western blot analysis (C) and RT-qPCR results (D) demonstrating induction of PLIN5 protein and relative mRNA expression in Hep3B, Huh, and HepG2 cells after treatment with IL-6 (10 ng/mL) for 24 h. For all Western blots, GAPDH detection and Ponceau S staining served as controls to demonstrate equal protein loading. Data for RT-qPCR results are shown as mean ± SD of three independent experiments performed in triplicate, measured in duplicate. Differences between the groups reaching significance are marked by asterisks (* p < 0.05, ** p < 0.01, *** p < 0.001).
Figure 3
Figure 3
IL-6-mediated PLIN5 upregulation is dose- and time-dependent. (A) Hep3B cells were stimulated with rising IL-6 concentrations for 24 h and the cell extract probed for PLIN5 expression. (B,C) Hep3B cells were stimulated with IL-6 for the indicated time intervals and analyzed for expression of PLIN5 by Western blot analysis. (D) Western blot analysis depicting cytoplasmatic localization of PLIN5. For nuclear extraction, Histone H3 was used as control for the nuclear fraction, while the expression of Vinculin served as a marker for the cytoplasmic protein fraction. For all Western blots, GAPDH detection and Ponceau S staining served as controls to demonstrate equal protein loading. (E) Immunofluorescent staining of PLIN5 protein in Hep3B cell line after 24 h of IL-6 (10 ng/mL) stimulation confirmed cytoplasmic localization. Space bars represent 25 µm.
Figure 4
Figure 4
Effect of IL-6 stimulation on downstream signaling pathways in Hep3B cells. Hep3B cells were stimulated with IL-6 (10 ng/mL) for 0, 15, 30, 45, 60 min and 24 h and the activation of IL-6 downstream signaling components analyzed by Western blot analysis. GAPDH detection and Ponceau S staining served as controls to demonstrate equal protein loading.
Figure 5
Figure 5
Effects of JAK inhibitor Ruxolitinib on IL-6-mediated PLIN5 upregulation in Hep3B cells. Hep3B cells were pretreated with the JAK inhibitor Ruxolitinib (5 µM) for 1 h and subsequently incubated with IL-6 (10 ng/mL) for 24 h. (A) None of the Ruxolitinib concentrations used induced apoptosis as demonstrated by the lack of elevated cleaved PARP or CASP3 quantities when compared with the apoptosis inducing control Puromycin (5 µg/mL). (B) PLIN5 expression and STAT3 phosphorylation, a downstream target of JAK, were analyzed by Western blot, demonstrating that Ruxolitinib blocked IL-6-induced PLIN5 protein expression. (C) Effect of Ruxolitinib and IL-6 treatment was assessed on PLIN5 mRNA expression by RT-qPCR. GAPDH expression and Ponceau S staining served as controls to demonstrate equal protein loading. Significant differences between the groups are marked by asterisks (* p < 0.05, *** p < 0.001).
Figure 6
Figure 6
Effects of STATTIC on IL-6-mediated PLIN5 upregulation in Hep3B. (A) Hep3B cells were pretreated with STAT3 phosphorylation inhibitor STATTIC (10 µM) for 1 h and then treated for 24 h with IL-6 (10 ng/mL) and the expression of poly (ADP-ribose) polymerase (PARP), cleaved PARP, caspase-3 (CASP3), and cleaved CASP3 was analyzed by Western blot. (B) PLIN5 expression and STAT3 phosphorylation was analyzed by Western blot analysis demonstrating that STATTIC blocked IL-6-induced PLIN5 protein expression. The quantities of GAPDH and Ponceau S staining served as controls to demonstrate equal protein loading. (C) Effect of STATTIC on PLIN5 mRNA expression was tested by RT-qPCR. Significant differences between the groups are marked by asterisks (* p < 0.05, ** p < 0.01, *** p < 0.001).
Figure 7
Figure 7
Effects of PI3K inhibitor LY294002 on IL-6-mediated PLIN5 upregulation in Hep3B cells. (A) Hep3B cells were pretreated with the indicated concentrations of PI3K inhibitor LY294002 for 1 h and then treated with IL-6 (10 ng/mL) for 24 h. Cell extracts were prepared and tested by Western blot analysis for PARP and cleaved caspase-3 (CASP3). Cell extracts prepared from cells that were treated with Puromycin served as control. GAPDH detection and Ponceau S staining served as controls to demonstrate equal protein loading. (B) PLIN5 expression and phosphorylation of AKT (downstream target of PI3K) analyzed by Western blot demonstrated that LY294002 has no influence on IL-6-induced PLIN5 protein expression. (C) Effect of LY294002 on PLIN5 mRNA expression was tested by RT-qPCR. Significant differences between the groups are marked by asterisks (* p < 0.05, ** p < 0.01, *** p < 0.001).
Figure 8
Figure 8
Effect of IL-1β, TNF-α and TGF-β on IL-6-mediated PLIN5 upregulation in Hep3B cells. (AC) Hep3B cells were treated with IL-6 in combination with IL-1β, TNF-α and TGF-β for 24 h. PLIN5 expression and phosphorylation of STAT3 analyzed by Western blot demonstrated that (A) IL-1β has no effect on STAT3 signaling and PLIN5 expression while (B,C) TNF-α and TGF-β partially block STAT3 phosphorylation and IL-6-induced PLIN5 protein upregulation. GAPDH served as loading control.
Figure 9
Figure 9
Effects on PLIN5 expression after simultaneous stimulation with IL-6 stimulation and sIL-6R in liver cancer cell lines. (A) Representative Western blot and (B) RT-qPCR results demonstrating the induction of PLIN5 protein and relative mRNA expression after IL-6 (15 ng/mL) stimulation alone or in combination with sIL-6R (100 ng/mL) for 24 h. GAPDH detection and Ponceau S staining served as controls to demonstrate equal protein loading. For RT-qPCR results, data are shown as mean ± SD of three independent experiments performed in triplicate and measured in technical replicates. Differences between the groups reaching significance are marked by asterisks (* p < 0.05, ** p < 0.01, *** p < 0.001).

Similar articles

Cited by

References

    1. Samant H., Amiri H.S., Zibari G.B. Addressing the worldwide hepatocellular carcinoma: Epidemiology, prevention and management. J. Gastrointest. Oncol. 2021;12((Suppl. S2)):S361–S373. doi: 10.21037/jgo.2020.02.08. - DOI - PMC - PubMed
    1. Suresh D., Srinivas A.N., Kumar D.P. Etiology of Hepatocellular Carcinoma: Special Focus on Fatty Liver Disease. Front. Oncol. 2020;10:601710. doi: 10.3389/fonc.2020.601710. - DOI - PMC - PubMed
    1. Grgurevic I., Bozin T., Mikus M., Kukla M., O’Beirne J. Hepatocellular Carcinoma in Non-Alcoholic Fatty Liver Disease: From Epidemiology to Diagnostic Approach. Cancers. 2021;13:5844. doi: 10.3390/cancers13225844. - DOI - PMC - PubMed
    1. Buers I., Hofnagel O., Ruebel A., Severs N.J., Robenek H. Lipid droplet associated proteins: An emerging role in atherogenesis. Histol. Histopathol. 2011;26:631–642. doi: 10.14670/HH-26.631. - DOI - PubMed
    1. Dalen K.T., Dahl T., Holter E., Arntsen B., Londos C., Sztalryd C., Nebb H.I. LSDP5 is a PAT protein specifically expressed in fatty acid oxidizing tissues. Biochim. Biophys. Acta (BBA)—Mol. Cell Biol. Lipids. 2007;1771:210–227. doi: 10.1016/j.bbalip.2006.11.011. - DOI - PubMed

MeSH terms