

Transcriptome Analysis of Roots from Wheat (Triticum aestivum L.) Varieties in Response to Drought Stress
- PMID: 37108408
- PMCID: PMC10139362
- DOI: 10.3390/ijms24087245
Transcriptome Analysis of Roots from Wheat (Triticum aestivum L.) Varieties in Response to Drought Stress
Abstract
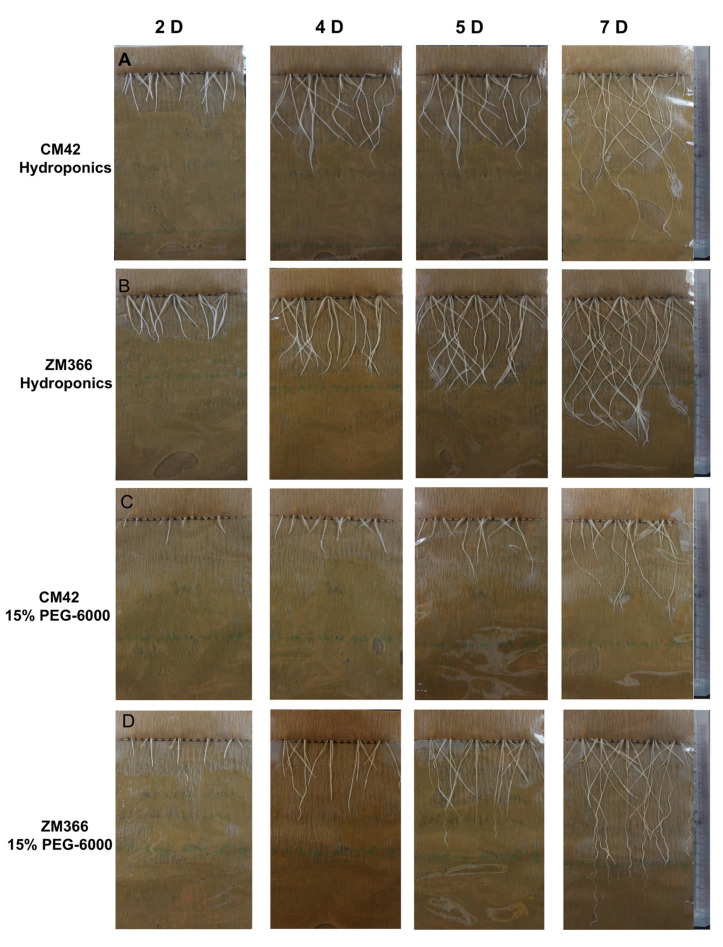
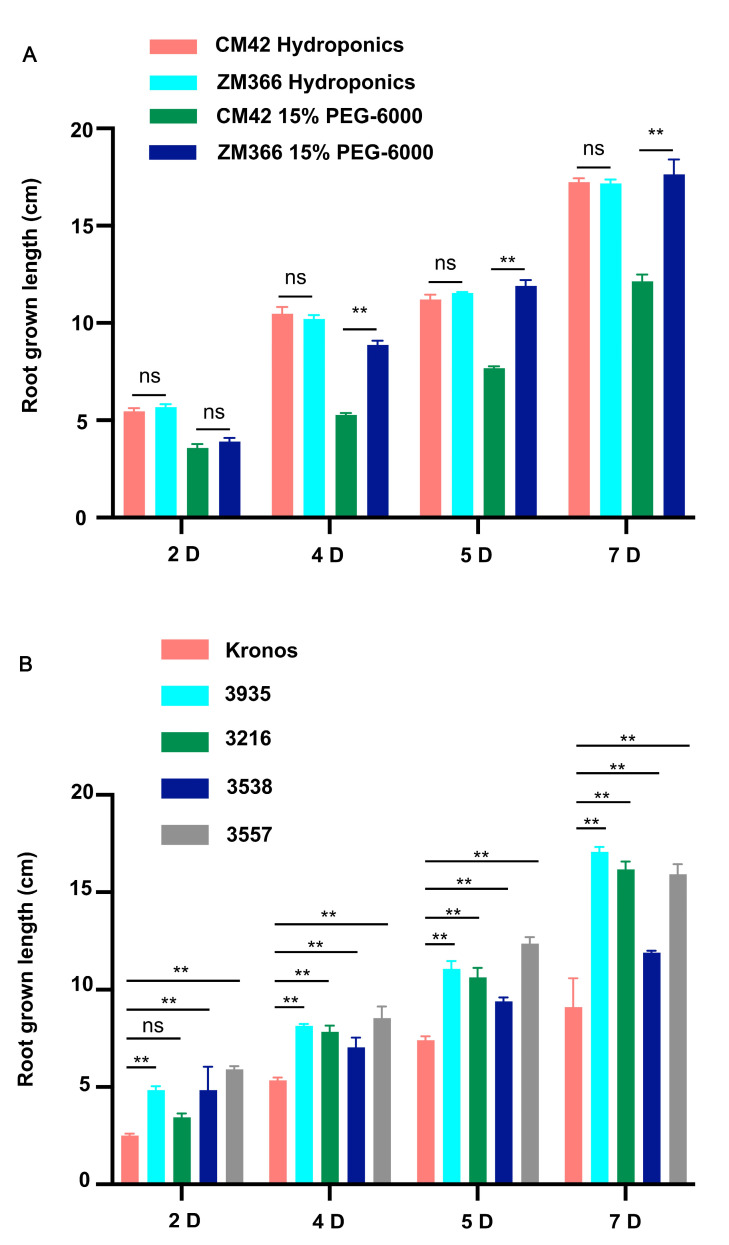
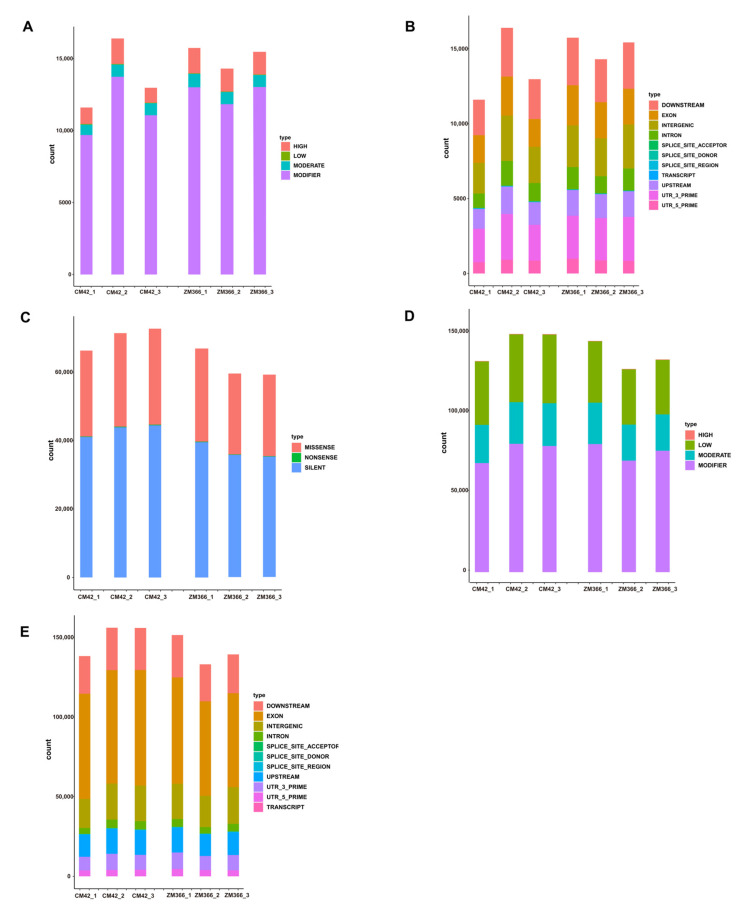
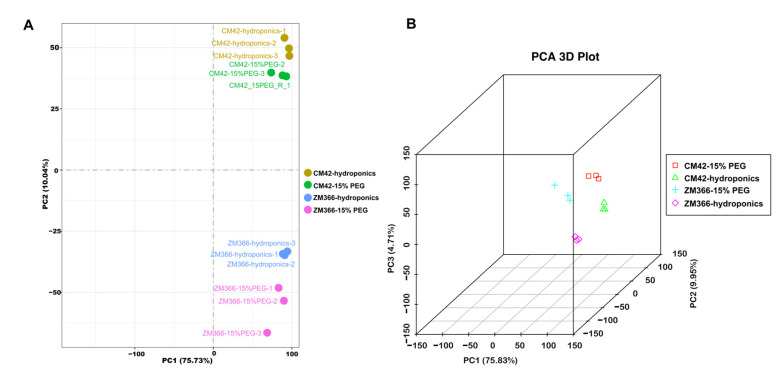
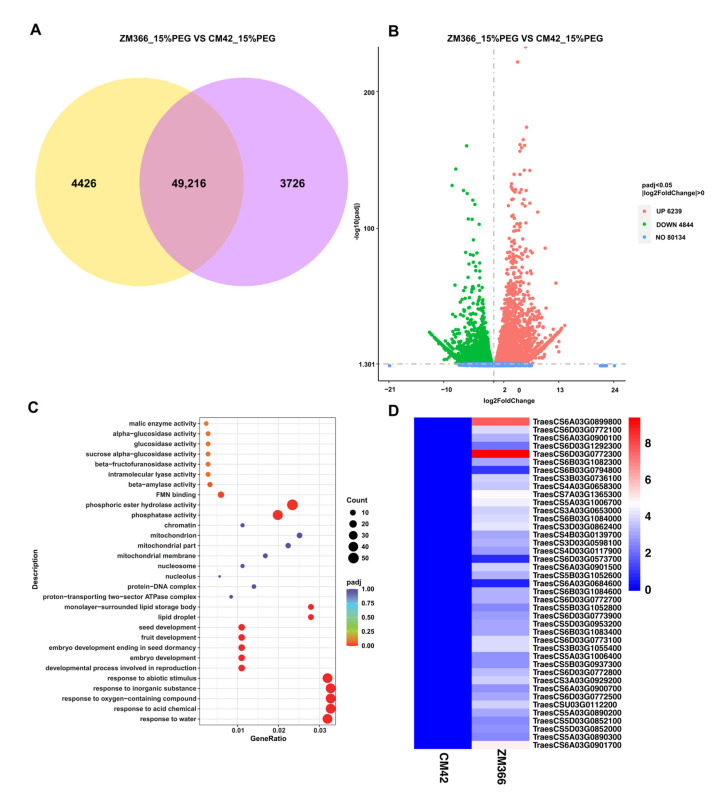
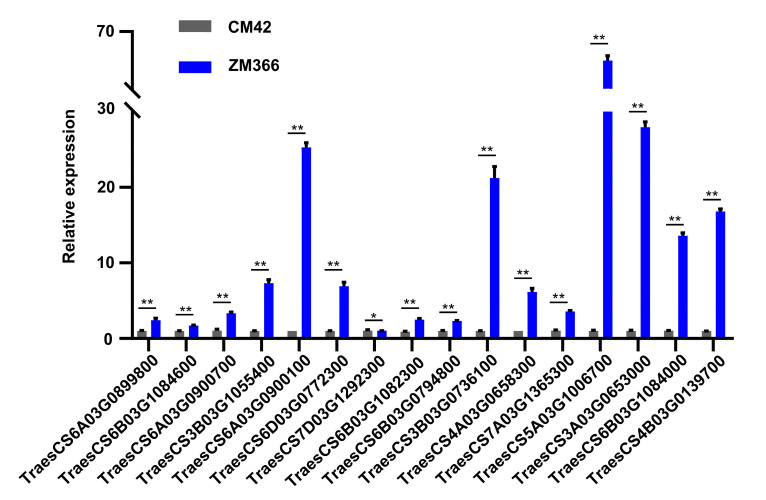
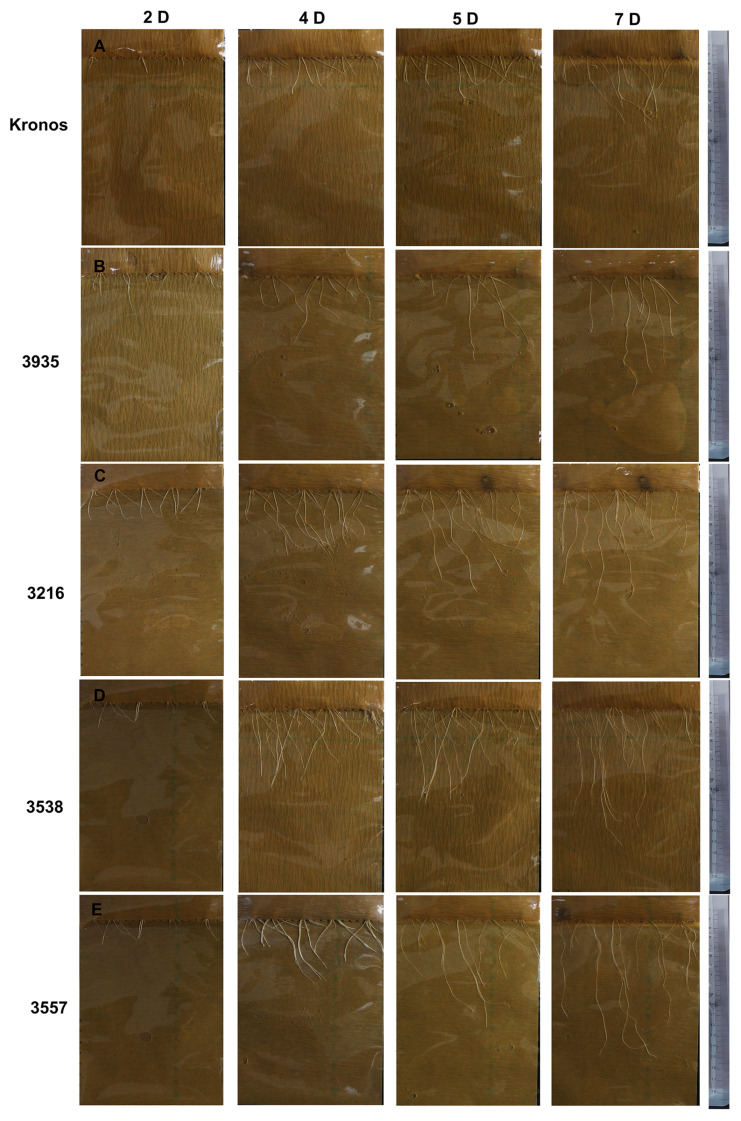
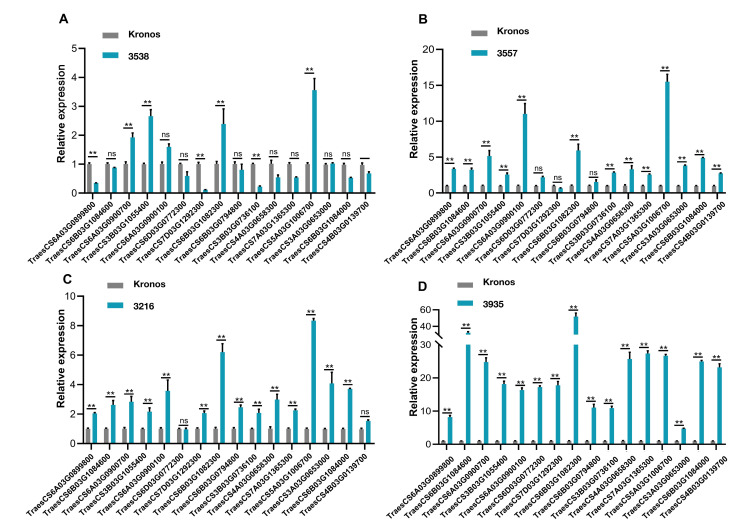
Under climate change, drought is one of the most limiting factors that influences wheat (Triticum aestivum L.) production. Exploring stress-related genes is vital for wheat breeding. To identify genes related to the drought tolerance response, two common wheat cultivars, Zhengmai 366 (ZM366) and Chuanmai 42 (CM42), were selected based on their obvious difference in root length under 15% PEG-6000 treatment. The root length of the ZM366 cultivar was significantly longer than that of CM42. Stress-related genes were identified by RNA-seq in samples treated with 15% PEG-6000 for 7 days. In total, 11,083 differentially expressed genes (DEGs) and numerous single nucleotide polymorphisms (SNPs) and insertions/deletions (InDels) were identified. GO enrichment analysis revealed that the upregulated genes were mainly related to the response to water, acidic chemicals, oxygen-containing compounds, inorganic substances, and abiotic stimuli. Among the DEGs, the expression levels of 16 genes in ZM366 were higher than those in CM42 after the 15% PEG-6000 treatment based on RT-qPCR. Furthermore, EMS-induced mutants in Kronos (T. turgidum L.) of 4 representative DEGs possessed longer roots than the WT after the 15% PEG-6000 treatment. Altogether, the drought stress genes identified in this study represent useful gene resources for wheat breeding.
Keywords: DEGs; GO; RNA-seq; RT-qPCR; stress treatment; wheat.
Conflict of interest statement
The authors declare no conflict of interest.
Figures
Similar articles
-
Exploring Drought Resistance Genes from the Roots of the Wheat Cultivar Yunhan1818.Int J Mol Sci. 2024 Dec 16;25(24):13458. doi: 10.3390/ijms252413458. Int J Mol Sci. 2024. PMID: 39769221 Free PMC article.
-
Transcriptome unveiled the gene expression patterns of root architecture in drought-tolerant and sensitive wheat genotypes.Plant Physiol Biochem. 2022 May 1;178:20-30. doi: 10.1016/j.plaphy.2022.02.025. Epub 2022 Mar 1. Plant Physiol Biochem. 2022. PMID: 35247694
-
Comparative transcriptome analysis reveals the key genes and pathways involved in drought stress response of two wheat (Triticum aestivum L) varieties.Genomics. 2023 Sep;115(5):110688. doi: 10.1016/j.ygeno.2023.110688. Epub 2023 Jul 18. Genomics. 2023. PMID: 37474013
-
Transcriptomic and Metabolomic Profiling of Root Tissue in Drought-Tolerant and Drought-Susceptible Wheat Genotypes in Response to Water Stress.Int J Mol Sci. 2024 Sep 27;25(19):10430. doi: 10.3390/ijms251910430. Int J Mol Sci. 2024. PMID: 39408761 Free PMC article.
-
Research on the regulation mechanism of drought tolerance in wheat.Plant Cell Rep. 2025 Mar 20;44(4):77. doi: 10.1007/s00299-025-03465-2. Plant Cell Rep. 2025. PMID: 40111482 Review.
Cited by
-
Transcriptome Analysis Reveals Candidate Pathways and Genes Involved in Wheat (Triticum aestivum L.) Response to Zinc Deficiency.Biology (Basel). 2025 Aug 2;14(8):985. doi: 10.3390/biology14080985. Biology (Basel). 2025. PMID: 40906163 Free PMC article.
-
Mitigating drought-induced oxidative stress in wheat (Triticum aestivum L.) through foliar application of sulfhydryl thiourea.Sci Rep. 2024 Jul 10;14(1):15985. doi: 10.1038/s41598-024-66506-y. Sci Rep. 2024. PMID: 38987560 Free PMC article.
-
The Proteomic and Peptidomic Response of Wheat (Triticum aestivum L.) to Drought Stress.Plants (Basel). 2025 Jul 14;14(14):2168. doi: 10.3390/plants14142168. Plants (Basel). 2025. PMID: 40733406 Free PMC article.
-
Omics-driven exploration and mining of key functional genes for the improvement of food and fiber crops.Front Plant Sci. 2024 Jan 8;14:1273859. doi: 10.3389/fpls.2023.1273859. eCollection 2023. Front Plant Sci. 2024. PMID: 38259913 Free PMC article. Review.
-
Exploring Drought Resistance Genes from the Roots of the Wheat Cultivar Yunhan1818.Int J Mol Sci. 2024 Dec 16;25(24):13458. doi: 10.3390/ijms252413458. Int J Mol Sci. 2024. PMID: 39769221 Free PMC article.
References
-
- Dong Y.C. Genepools of Common Wheat. J. Triticeae Crops. 2000;20:78–81.
-
- Fu X.D., Liu Q., Li Z.S., Zhang A.M., Ling H.Q., Tong Y.P., Liu Z.Y. Research achievement and prospect development on wheat genome. Bull. Chin. Acad. Sci. 2018;33:909–914.
-
- Wang M., Xia G.M. The landscape of molecular mechanisms for salt tolerance in wheat. Crop J. 2018;6:42–47. doi: 10.1016/j.cj.2017.09.002. - DOI
MeSH terms
Substances
LinkOut - more resources
Full Text Sources
